AN INITIAL REPORT INTO THERMAL PERFORMANCE OF
HEMP AND LIME WALL SECTIONS IN THE WISE BUILDING
AT CAT.
Ranyl Rhydwen
1, Simon Tucker
1, Arthur Butler
1, Chitral Wijeyesekera
21. Graduate School of the Environment at the Centre of Alternative Technology (GSE_CAT) 2. School of Computing, IT and Engineering, University of East London (UEL)
[email protected], [email protected]
Abstract: Hemp and binder (e.g. Lime) is an insulating wall matrix formed around a timber frame. It has multiple environmental benefits including sequestering carbon dioxide from the atmosphere into a building‟s walls and is thus of interest in the current climate situation. However the thermal performance of the matrix when evaluated using the steady state thermal conductivity (i.e. rate of heat transfer) is not as effective for the same thickness as other insulations. The world however is dynamic and in the Haverhill Housing Project monitored by the Building Research Establishment (UK) two hemp and lime houses, despite having a worse steady state thermal performance on paper, significantly outperformed comparative standard houses (BRE 2002, 2003).
The reasons for this unexpected performance are not clarified although the heat storage capacity and the moisture handling ability of the matrix are possibilities. Hemp and binder matrix has been shown to have considerable moisture handling and heat storage capabilities but how or whether these improve thermal performance is not clear. All the tests reported so far have been on the same binder yet there are many potential binders and each will change the properties of the matrix and each has a different environmental legacy.
To further clarify the in-building performance and to compare a range of binders, 5 different binder test wall sections in the Welsh Institute of Sustainable Education building at the Centre of Alternative Technology are being extensively monitored for heat flux, temperature and moisture movements. This paper is an initial report of this experiment.
1. Introduction
There is an urgent need to reduce carbon dioxide (CO2) intensive energy use and to
remove CO2 from the atmosphere to
mitigate against serious global warming (Rockström et al 2009). Space heating and the manufacture of building materials respectively account for ~14% and ~20% of all CO2 emissions in the UK (Allwood et al
2010, Jackson et al 2009). It is therefore imperative to “create buildings that are
energy efficient and use low carbon construction materials” (Costello et al 2009).
efficiency of buildings (saving CO2)
sequester (lock away) CO2 from the
atmosphere and increase biodiversity.
Hemp and binder (e.g. clay / lime) combines hemp shiv (the woody inner core of the hemp stem) with a binder to create a solid matrix that is either formed around a timber frame to create an insulating wall or is adhered to an existing wall as an insulating render.
Hemp has impressive environmental credentials (Rhydwen 2006) increasing biodiversity and removing atmospheric CO2
(Small 2002, Pervaiz 2003). Therefore hemp and binder is an insulating building material that potentially does, due to the hemp, sequester CO2 and increase biodiversity
although the former is dependent on the binder used (Miskin 2010).
The extent to which hemp and binder insulation improves the energy efficiency of a building however is unknown. The main parameter used to assess the thermal performance of insulations is their conductivity or λ-value (W/m.K.) which indicates the steady state rate of heat loss though the material per degree oC and unit thickness.
As conductivity is heat loss per unit of thickness to assess the total rate of heat loss through a wall per unit area it is necessary to account for the thickness of the wall by dividing its λ by its thickness (l) to derive the thermal conductance (W/m2.K) for the solid elements of wall. The total conductance or U-value of a whole wall is this thermal conductance plus the thermal resistances of the interior and exterior surface air layers. As hemp and binder has a higher λ than most fibrous insulations it follows that for the same thickness of wall, fibrous insulations should have a significantly better thermal performance. However λ is a steady state measurement and the world is dynamic. The fragility of
this measure is demonstrated in the Haverhill Housing project run by BRE where two hemp houses significantly outperformed two comparative brick and block cavity wall insulated houses despite the U-values for the hemp houses and the standard houses being 0.58W/m.K. and 0.35W/m.K. respectively (BRE 2002, 2003). There are several possible reasons for this unexpected thermal performance. The hemp matrix should reduce thermal bridging (heat loss through high conductivity elements in a building) and improve air tightness; both improving thermal performance. Hemp and binder also has more thermal mass than other insulations which can potentially store and re-release heat saving energy (Coulson 2009).
It is also possible that as hemp and binder is „breathable‟ (water vapour permeable), hygroscopic (adsorbs and releases moisture through hydrostatic bonds as relative humidity (RH) varies) and has a high capillarity, it could potentially advantageously utilise the latent heat exchanges associated with the condensation and evaporation of water vapour, akin to a phase change material (Arnaud 2009). These moisture handling properties also tend to buffer internal relative humidity fluctuations in a building which also potentially saves energy as less ventilation is require to prevent condensation.
behaviour of the hemp and binder matrix (Arnaud 2009). Further the binder used and the way the matrix is formed (e.g. blown, tamped) also affect all the basic thermal parameters and moisture handling abilities of the hemp insulation matrix.
A further possibility is that the Haverhill results do not reflect the hemp homes out performing their U-value but rather demonstrate the brick and block houses not behaving as their U-values suggest. This could be because ventilation within the cavity can undermine thermal performance if the insulation is poorly fitted (Hens et al 2007), or the insulation could get wet if the protective vapour barriers are not perfectly fitted or damaged, and also by liquid water suffusion from the exterior under certain conditions, all of which would significantly reduce thermal performance.
Therefore despite intensive investigations there is still no accurate assessment of the actual in-situ thermal performance of the hemp matrix. It is also unclear exactly how the different potential binders will affect the final performance of the matrix.
Overall if the thermal performance of hemp and binder is as impressive as the Haverhill housing project suggests, hemp and binder is an environmental material that does save energy in use, increase biodiversity and sequester carbon dioxide.
To shed further light on the complex issue of the thermal performance of hemp binder the WISE building (Figure 1) walls experiment (Figure 2) was established. There several fundamental questions are being asked;
1. What is the energy efficiency of the walls and can this be defined or refined into a single understandable measure?
2. Can the thermal behaviour observed be accurately represented using
statistical, deterministic or stochastic models?
3. How do the moisture fluctuations in the walls relate to their energy efficiency?
4. Do the walls out perform estimated U-values or not?
5. How do the internal heating patterns affect the performance of the wall in-situ?
[image:3.595.307.522.287.395.2]6. Do the different binders used make a significant difference to the above?
Figure 1. The WISE Building at CAT
2. Experimental Design
Figure 2 Wall lay out & binder type -top, Monitoring through wall -bottom (NHL = Natural Hydraulic Lime)
The next four sections were completed 6 months later in November 08 and each of these sections was tamped into place by hand. The different lime based binder mixes are given in Figure 2. The rational behind the mixes was to test the commercial hemp lime product against non commercial lime mixes, with a varying amount of hydraulic activity.
The more hydraulic a lime is the faster in sets under water (pure lime does not set under water, NHL 5 sets within ~12-24hrs). The commercial binders have a strong hydraulic set as they contain a significant quantity of cement. It is well recognised that
the more hydraulic a lime is the less porous it is (increasing conductivity) and the less vapour permeable it is, meaning that in theory its thermal and hygric performance should when dry be inferior to a pure lime (Everard 2005). However the pure limes will take longer to dry and set.
Initially 5 platinum resistance sensor probes and 3 capacitance chip relative humidity probes with a linear voltage output where placed within the walls at the same height. In wall sections 1, 2 and 3 additional temperature probes were added to the internal and external surfaces in November 09 after the render had to be removed for other reasons. Each section also has an interior Hukseflux (HFP01) heat flux pad placed just under the internal plaster, such that positive values indicate energy passing into the wall and negative value indicate energy flowing back into the internal space (see Figure 2).
As can be seen in Figure 2 relative humidity (RH) and temperature are also being measured externally just by the walls and in each internal space that the walls sections face. This extensive monitoring allows the temperature profiles, Relative Humidity fluctuations and energy input to be assessed in real time throughout the wall.
3. Initial Findings
When the temperature increases above a certain level the RH suddenly falls and remains low until the temperature falls again when the RH rises again (Figure 3). There are two possibilities for this; either the RH chips are faulty or the temperature rise is the front of a penetrating heat wave that is acutely drying the wall to this depth until the heat wave withdraws again allowing the moisture from the still wet wall to return again. The latter seems plausible as the RH does not always drop to the 0% (probe fault value) although further exploration is needed to define this phenomenon.
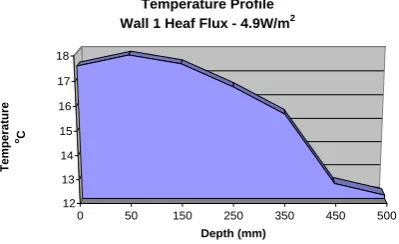
Thermal capacitor behaviour has been observed with the heat flux becoming negative as the surface temperature of the wall drops below the temperature of the wall at 50mm in Figure 4.
Using the heat equation (1) two attempts have been made to try and estimate effective U-values of the hemp walls.
Q = λ (T1 – T2) / d (1)
Where Q =Heat flux, λ = Conductivity T1 = Temp. inner, T2 = Temp outer, d = distance between T1 & T2.
Firstly λ was directly calculated for each time step from the temperature gradient across the whole wall and heat flux. Then a probability distribution of the values was plotted. This revealed a skewed profile for every wall section with several out-lying values and thus the median of the values was taken as most likely value.
Relative Humidity and Temperautre vs Time Wall 4
13 15 17 19 21 23 25 27
Time
Tempe
rature
o C
-25 -5 15 35 55 75 95 115
Re
lati
ve
Humidit
y %
Temp. Wall 4 RH Wall 4
Relative Humidity and Temperautre vs Time Wall2
14 15 16 17 18 19 20 21 22 23
Time
Tempe
rature
oC
85 90 95 100 105 110
Re
lati
ve
Humidit
y %
[image:5.595.309.516.110.389.2]Temp. Wall 2 RH Wall 2
Figure 3 RH and Temperature Time (minutes) Series
0 50 150 250 350 450 500
12 13 14 15 16 17 18
Tem
perat
ure
oC
Depth (mm)
Temperature Profile Wall 1 Heaf Flux - 4.9W/m2
Figure 4. Temperature profile with Heat Flowing back into room, 0mm = Inside 500mm = Outside
[image:5.595.311.511.445.567.2]0 50 150 250 350
450 500
16 16.5 17 17.5 18 18.5 19 19.5
Tempe
rature
oC
Depth in Wall (mm)
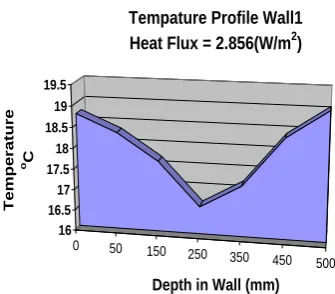
[image:6.595.96.264.112.259.2]Tempature Profile Wall1 Heat Flux = 2.856(W/m2)
Figure 5. Temperature difference across wall zero with large dip in centre driving heat flux.
This method did seem to give reasonable results however when the value was used to obtain calculated heat fluxes the correlation between these and the actual measurements was very poor.
In the second method of calculating the λ value, a range of λ values were sequentially used in each time step to obtain a total heat flux across the wall over an 8 day period. When this calculated total heat flux value was as close to the actual heat flux measured as possible, the λ used was taken to be the effective λ value of the wall from which the U-value for the wall was then calculated. In the first iteration the whole wall temperature difference were used and this gave the lowest λ -value and when the calculated time stepped heat fluxes were correlated against the measured heat flux values there was no correlation as would predicted from the implications of Figure 5. If the 250mm temperature difference was used the calculated λ -value increased and the correlation increased as expected. When the 50mm temperature difference was used the calculated λ -value was closer still to the expected value and the correlation between the time stepped calculated heat flux values and measured values increased further.
the λ values and Figure 7 gives the calculated U-values.
This suggests that temperature differential across the first 50mm of the wall is a more significant determinant of the dynamic flow of heat flux into the internal surface of a wall and not the temperature potential across the whole wall as is used in steady equations. It is also shows that if this simplified steady state model is used to calculate a wall‟s thermal performance from the internal and external temperatures it is likely be inaccurate on many occasions. The effects of radiant heat inputs, dynamic changes in moisture content, phase change of water and the volumetric heat storage capacity of the wall on the measured heat flux are also not accounted for in these steady state based calculations and further analysis is necessary to tease out the affect of these factors.
For comparative purposes however it is reasonable to suggest that the walls thermal performance is significantly differently at the present time which could be due to different drying times and / or the different binder types.
Heat Flux Measured vs Calculated (Temp. 50mm - Temp. Inside)
R2 = 0.7391
-6 -5 -4 -3 -2 -1 0 1 2 3 4
-4 -3 -2 -1 0 1 2 3 4
Measured (W/m2)
Calcu
late
d (W
/m
2)
Heat Flux Measured vs Calculated (Temp. 250mm - Temp. inside)
R2 = 0.4488
0 0.2 0.4 0.6 0.8 1 1.2 1.4 1.6 1.8
-6 -4 -2 0 2 4
Measured (W/m2)
Calcu
late
d (W
/m
2)
B: Conductivity 0.13W/m.K
Heat Flux Measured vs Calculated (Temp. outside -Temp. inside)
R2 = 0.064
-6 -5 -4 -3 -2 -1 0 1 2 3 4
0 1 2 3 4 5
Measured (W/m2)
Calculated (W/m
2)
C: Conductivity 0.108W/m.K
Figure 6: Correlations measured v calculated A =50mm B=250mm C=500mm
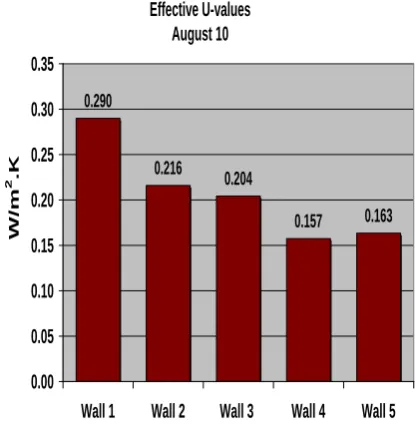
Effective U-values August 10
0.290
0.216
0.204
0.157 0.163
0.00 0.05 0.10 0.15 0.20 0.25 0.30 0.35
Wall 1 Wall 2 Wall 3 Wall 4 Wall 5
W/
m
[image:7.595.312.520.114.332.2]2.K
[image:7.595.80.284.114.451.2]Figure 7 50mm U-values
Figure 7 above shows the U-value estimates for each of the wall sections and there are clear differences at present although no firm conclusions can be drawn until they are fully dried.
4. Conclusions
The monitoring equipment appears to be working as expected and is providing a wealth of interesting data to be analysed. It is also clear that in the dynamic situation a simple measure of energy efficiency based on steady state condition equations is likely to be inadequate when assessing the thermal efficiency of a wall that has thermal mass and moisture handling abilities.
5. References
Allwood J. M., Cullen J.M., Milford R.L., “Options for Achieving a 50% Cut in Industrial Carbon Emissions by 2050”, Environmental Science & Technology, VOL. 44, NO. 6, 2010 Arnaud L., Comparative study of hygro thermal performances of building materials. Proceedings, NOCMAT, Bath 2009
BRE; “Final Report on the Construction of the Hemp Houses at Haverhill, Suffolk”, Client report number 209-717 Rev.1. 2002.
BRE , “Thermographic Inspection of the Masonry and Hemp Homes- Haverhill, Suffolk:”
Client Report Number 212020, BRE 2003 Butchart S.H.M., Walpole M, Collen B, Van Strien A, Scharlemann J.P.W, Almond R.E.A., Baillie J.E.M, Bomhard B, et al, “Global Biodiversity: Indicators of Recent Declines”
Science 328, 1164, 2010
Coulson R “An investigation into the thermal properties of hemp and lime walls” MSc(AEES) UEL, 2009
Costello A,, Abbas M, Allen A., Ball S., Bell S., Bellamy R., Friel S., Groce N., Johnson A., Kett M., Lee M., Levy C., Maslin M., McCoy D., McGuire B. Montgomery H., Napier D., Pagel C., Patel J., Antonio J. Puppim de Oliveira, Redclift N, Rees H, Rogger D., Scott J, Stephenson J., Twigg J, Wolff J , Patterson C.
“Managing the health effects of climate change”,
Lancet, Vol. 373, 1693–733, May 16, 2009 Evrard A "Bioclimatic envelopes made of lime and hemp concrete", published in the proceedings from conference CISBAT, pp.25-30, Lausanne, Switzerland, 2005.
Evrard, A and De Herde, A. „Dynamical interactions between heat and mass flows in Lime-Hemp Concrete‟ in Research in Building Physics and Building Engineering, London, Taylor & Francis Group: ISBN 0-415-41675-2;2006
Hens H., A. Janssens, W. Depraetere, J. Carmeliet, J. Lecompte “Brick Cavity Walls: A Performance Analysis Based on Measurements and Simulations” Journal of Building Physics; 31; 95; 2007
Jackson, J. Li, Y. Murrells, T. Passant, N. Sneddon, S. Thomas, J. Thistlethwaite, G. Dyson, K. Cardenas, L. Greenhouse gas inventories for England, Scotland, Wales and Northern Ireland: 1990 – 2007, Pivot Tables.2009
Miskin, N. “The Carbon Sequestration Potential of Hemp-binder A study of embodied carbon in hemp-binder compared with dry lining solutions for insulating solid walls.” AEES MSC. UEL, GSE_CAT. Jan. 2010
Pervaiz M.), “Carbon storage potential in natural fiber Composites”; Resources, Conservation and Recycling 39; 325_/340;2003
Rhydwen G. R. “A model for UK hemp cultivation and processing to supply the building industry with hurds for hemp and lime concrete”
Thesis, MSc Architecture: AEES, UEL, GSE_CAT.2006