Infrequent Behaviour from Business Processes using Process Mining
A. Dayanalizy
1G. Gayathri
21
M.Phil Student
2Assistant Professor
1,2Prist University, Thanjavur, India
Abstract— Process mining is considered a discipline that contains a set of techniques, algorithms and methods for discovering, monitoring and optimizing business processes through event logs extracted from transactional systems. Based on this discipline, a model is proposed that allows the evaluation of the performance and behaviour of business processes through a set of control metrics. As a result of the model evaluation, six control metrics were analyzed in the logistic process of a Peruvian retail enterprise using ProM Tools for the application of Process Mining techniques and Qlikview for the implementation of the Process Cube and results presentation.
Key words: Process Mining; Event Logs; Business Process Intelligence; Process Cubes
I. INTRODUCTION
It is not new that companies are currently in a continuous search for improvements for the execution of their processes. Therefore, they are immersed in the choice of new technologies that provide tools and techniques to improve the control of their operations the current approaches for process improvement have a high probability of failure, as is the case of process re-engineering where there is a probability of failure of between 60 and 70% [1]. It is in response to this need that Process Mining emerged. This field of research is defined as a discipline that uses event logs generated by information systems to discover, analyze and improve business processes [2]. However, as an emerging technology, it still presents many challenges for its application. These include: poor understanding of inexperienced users, integrating Process Mining with other types of analysis and the complexity of using existing tools [2]. These challenges are reflected in the lack of reports and visualizations that clearly reflect to the end user the outcome of the process analysis, which is extremely important because transforming data into valuable information requires an understanding of the data context and the ability to visualize large volumes of data [3]. On the other hand, it should be considered the complexity of replicating the workflow, which requires analysts to perform many analysis steps in a specific order [4], despite the fact that multiple iterations are usually required in order to fine-tune the report so that it provides the highest level of understanding for the end user. Therefore, with the objective of addressing these challenges, a solution is developed to meet the obstacles involved in the execution of this technique, allowing a greater ease in the application and interpretation of results by using business process control metrics that provide the user a clear view of the current situation of behavior and execution of their processes.
The rest of the paper is structured as follows. Section 2 presents the state of the art. In Section 3, we present the proposed model. Section 4 presents the results of the implementation of the proposal in a real scenario. We conclude the work in Section 5.
II. STATE OF THE ART
In this section, we address the state of art wich has been divided in three sub-sections based on the explored topics:
A. Process Cubes
A Process Cube can be defined as a collection of events or process models organized through different dimensions (e. g. time, resources, roles, etc.) [6] allowing to manipulate the collection of events with traditional OLAP (On-Line Transactional Processing) operations (Slice, Dice, Drill Down, etc.) as commonly used in Business Intelligence [5]. Different approaches have been explored on the subject, giving positive results. The work of Ribeiro and Weijters demonstrates the advantages of developing an Event Cube (a similar term to refer to a Process Cube) where it allowed process analysts to apply Process Mining from different perspectives of the process in a simple way [7]. Similarly, the work of Bolt and Van der Aalst implements the Process Cube concept in a practical way in an application called "Process Mining Cube" that demonstrated good performance results compared to previous approaches [8].
B. Process Mining: Methods & Metrics
Process Mining has received great attention in recent years from the academic community, resulting in a large number of process discovery techniques, techniques for event log data analysis, techniques for trace classifications, process control metrics and specific application areas [1]. In the area of metrics, Minsu Cho proposes a methodology which focuses on the investigation of process metrics. This methodology includes two sets of indicators. The first group mentions a set of BPI best practice metrics, which were already proposed by Reijers and Mansar in 2005. The second set of indicators is designed to measure process performance (Process Performance Indicator) taking time, cost, quality and process flexibility as the main factors [9]. On the other hand, one of the main problems observed in the Process Mining application was the integration of Event Logs related to the process to analyze. Under this precedent, Claes and Poels developed a rules-based algorithm for merging Event Logs implemented in ProM Tools that allows to overcome one of the obstacles when applying Process Mining with multiple Event Logs [10].
As far as quality metrics are concerned, Kherbouche, Laga and Masse propose a model to ensure the quality of the Event Logs, to subsequently apply the algorithms of Process Mining. For this purpose, the model comprises a set of metrics based on complexity, precision, consistency and completeness [11]. Janssenswillen et al. present a comparative study on various quality metrics in the discovery phase of Process Mining based on Fitness, Precision, Generalization and Simplicity criteria [12].
detailed. In particular, it attempts to investigate how we can choose an effective Process Mining algorithm without extensive evaluation of each algorithm, allowing us to obtain the most optimal and reliable results based on the analysis process [13]; in the Conformance Checking phase, Adryansyah et al. present a compliance method based on measuring the precision of the observed behaviour in the event log and the process model generated previously in the discovery phase, the particularity of its approach stands out in that it allows to work with incomplete event logs and reduce the propensity to incorrect discoveries [14].
From another point of view, Conforti, La Rosa and ter Hofstede address the challenge of discovering high-quality process models in the presence of noise in event logs, through a technique to remove the infrequent behavior of these records [15]. The technique was implemented in ProM Tools as a plugin under the name of "Infrequent Behavior Filter". The plugin gives the user the freedom to select Gurobi or LPsolve as ILP solver.
C. PM2 Methodology
The PM2 methodology seeks to provide a guide for the implementation of Process Mining projects, which, unlike other existing methodologies, stands out for its scope to be applied to different types of projects [16]. PM2 consists of six phases: planning, extraction, data processing, mining and analysis, evaluation and finally, process improvement and support. The main contribution of the methodology is the data processing phase, which specifies various tasks such as filtering, adding different types of perspectives, among others, which together aim to have information that can allow optimal analysis in later phases [16].
III. CONTROL METRICS EVALUATION MODEL
A. Background
The proposed model takes concepts from the PM2 methodology for its design, since its approach seeks to evaluate performance and compliance with the rules and regulations of the process, and also covers a wide range of Process Mining techniques and other types of analysis techniques useful for the study of structured and unstructured processes in an iterative way [16]. The phases of the methodology that represented the greatest contribution were Extraction, Data Processing, Mining and Analysis and Evaluation. It is important to consider the minimum requirements to apply Process Mining. The first consideration is that the information of the process to be analyzed must be hosted in some data repository (database, csv file, transaction log, business suite, etc), from which the event logs will be extracted. The second one is that, with respect to the extracted event log, in order to apply Process Mining it must contain at least the following fields: Case identifier, Activity name and Time stamp.
In addition, the model makes use of Qlikview 12 for the visualization of data and ProM Tools 6.7 for the processing of event logs.
B. Model Phases
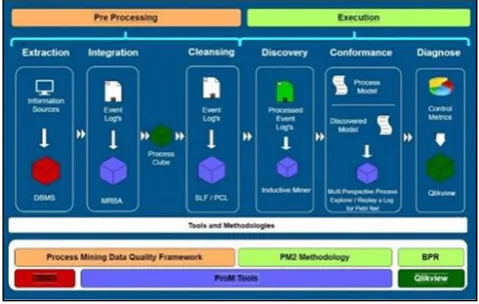
The main objective of the model is to evaluate control metrics to provide a diagnosis of the analyzed process. The model
consists of six phases that can be grouped into two main groups (Pre-processing and execution). Each of them is detailed below, as shown in Figure 1.
1) Extraction
The objective of this phase is to extract Event Data from the information systems that support the process to be analyzed under the format of an Event Log, so that Process Mining techniques can be applied. The minimum Event Log requirement must be a process instance identifier (CaseID), activity name and time stamp.
2) Integration
The aim of this phase is to integrate the Event Logs obtained in the extraction phase into a single Event Log, so that a holistic approach is taken to the process (end-to-end).
3) Cleansing
This phase aims to ensure that the Event Log information is consistent. To do this, the Event Log is filtered by removing the information that may negatively affect the analysis (lack of data, null values, etc.), in the same way incomplete or infrequent traces are eliminated.
4) Discovery
This phase aims to discover a process model based on the Event Log already processed.
5) Conformance
In this phase the model generated in the previous phase is compared with the model that currently follows the process, in addition the deviations and control metrics are calculated in this phase.
6) Diagnose
The objective of this phase is to evaluate previously calculated control metrics and provide visual representation of the results for the end users understanding.
C. Structural & Control Metrics
[image:2.595.308.548.549.701.2]For the structural analysis of the event log, the model contemplates metrics proposed in Kherbouche work, of which the following are used to calculate the level of complexity and variability of the process based on the information contained in the Event log [11]. The metrics are Average Trace Size (ATS), Average Trace Lenght (ATL), and Average Loops per Trace (ALT), Density (DN) and Trace Heterogeneity Rate (THR).
Fig. 1: Proposed Model
IV. RESULTS
company in the retail sector. The evaluation of the model allows to measure its performance and behavior through the previously explained phases.
A. Extraction Phase
For the extraction of the event data, the master tables were identified in the system database used by the organization, along with the help of the database administrator; the information from the tables was then interrelated through a query in SQL language to extract the event records. The extracted information from the system decanted in the generation of three Event Logs that contemplate the information of the management of purchase orders, generation of the invoice and the inventory receipts.
Table I shows the structural characteristics of the extracted Event Logs
Structural Characteristics of Event Logs
Metric EvLog1 EvLog2 EvLog3
# Events 26515 4367 12303
# Instances 4669 2414 3795
# Activities 8 5 5
# Resources 42 37 40
Table 1: Structural Characteristics of Event Logs
B. Integration Phase
In this phase, the three previously extracted Event Logs are unified into a single Event Log with the complete process information (end-to-end approach). The procedure carried out through the application of ProM Tools plugin is described below:
1) Analysis of Identifiers
In this step it is analyzed that the Event Logs share the instance identifier field (CaseID), so that the activities based on this field can be integrated. If you do not have such a shared common field, CaseIDs must be transformed in such a way that they are related to the other Event logs to be integrated. For the present case of application, the organization manages its processes through an RMS information system divided into modules, so this phase manages the same CaseID.
2) Running the Plugin
To unify the Event Logs, the "Merge two Event Logs using a rule based algorithm" plugin is used in ProM Tools [10]. The results of the integration phase are shown in Table II:
Basic structural characteristics of the Integrated Event Log
Metric Integrated Event Log
# Events 43185
# Instances 4669
# Activities 18
[image:3.595.303.550.229.517.2]# Resources 71
Table 2: Basic Structural Characteristics of the Integrated Event Log
If the total number of events and activities is the sum of all the events logs, it indicates that the process was successful since this means that all the executed events are included, on the other hand for the instances the maximum value observed in the events logs should be obtained, otherwise this would mean that there are executions of the process that are not being considered because a CaseID represents an execution of the process.
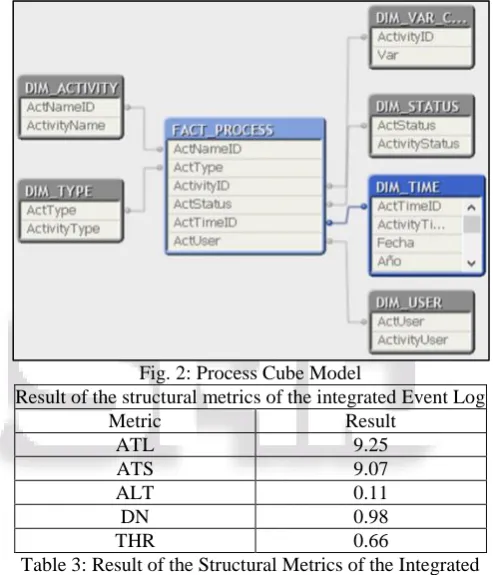
3) Application of the Process Cube
It is important to analyze the basic process information in the unified Event Log, in order to help the user define which will be the points relevant to the process for review. For this purpose, the Process Cube will allow us to analyze the Event Log of the retail company based on the following perspectives shown on Figure 2. It is important to note that the dimensions were defined based on the information available to extract. However, it is possible to include as many dimensions as considered necessary according to the user's need for analysis and they are, in that sense, not mandatory and only allow to enrich the analysis. The Process Cube application was implemented in Qlikview, the results of structural metrics can be seen in Table III:
Fig. 2: Process Cube Model
Result of the structural metrics of the integrated Event Log
Metric Result
ATL 9.25
ATS 9.07
ALT 0.11
DN 0.98
[image:3.595.54.265.247.332.2]THR 0.66
Table 3: Result of the Structural Metrics of the Integrated Event Log
The results of the structural metrics, specifically density (DN) and trace heterogeneity ratio (THR), indicate that this is a process with a low level of loops, i. e. the activities for a process execution are not repeated. However, if we analyze the THR, we can see that it is traced from a process of high variability.
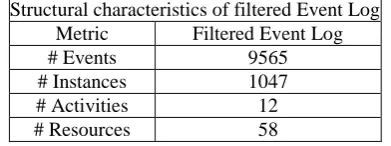
C. Cleansing Phase
Structural characteristics of filtered Event Log
Metric Filtered Event Log
# Events 9565
# Instances 1047
# Activities 12
[image:4.595.69.265.69.142.2]# Resources 58
Table 4: Structural Characteristics of Filtered Event Log To measure the effectiveness of this phase, the precision metric was evaluated before and after applying the filtering tasks with the “Multi-Perspective Process Explorer” plugin wich analyses how many events can be replayed correctly on the generated model given a dataset. The results can be observed in Table V:
Precision results in the cleaning phase
Metric Pre Post Δ P.P
Precision 83.50 % 97.40 % 13.9 # Correct Events 85.00 % 97.30 % 12.38 # Incorrect Events 15.00 % 2.70 % 12.38 # Missing Events 8.9 % 1.20 % -7.76 Table 5: Precision Results in the Cleaning Phase The results were positive, achieving 97.40% accuracy.
D. Discovery Phase
In order to generate the model, the Inductive Miner method is used. It is important to configure the process start and end activities in advance. By default, the method will analyze the possible activities. However, it also gives the possibility to perform the selection manually.
E. Conformance Phase
In the Conformance phase, we will test the model discovered in the previous phase with the model currently implemented in the company. The plugin used for this task is the "Multi Perspective Process Explorer", which indicates the degree of deviation of the process activities.
Metric #1: Percent Transition Fitness: Percent of instances that are reproducible in a Petri net [17]. Measurement Method
Multi Perspective Process Explorer plugin was used to calculate this metric, which uses the data attributes associated with events to analyze processes from multiple perspectives [18]. In this case, the conformity perspective will be used, which will show us the percentage of instances of the event log that are reproducible in the Petri net of the company process model based on the number of reproducible events, non- reproducible events and the number of missing events. Metric #2: Inconsistency Ratio Activity frequency with
respect to the total instances of initial activity. Mesaurement Method
For the calculation of this metric, the Log Inspector was used with its Log Summary utility, which shows the activity, the number of instances that count each one and their respective relative frequency. The Explore Event Log utility was also used to find the sequence pattern and initial process activity. Additionally, a calculation was made to find the metric. This calculation is composed of the following formula:
(1) In (1) AIN is the activity instance number, NIA is the number of initial activity and IR is the Inconsistency Ratio metric.
Metric #3: Arrival rate per hour: Number of case arrivals into the process per time unit [17].
Mesaurement Method
To calculate this metric, the Replay a Log for Petri Net plugin was used, which uses a Petri Net and an event log to create advanced alignments between each trace in the registry and the network [13]. It is possible to obtain from the execution of this plugin the waiting time, the sojourn time and the frequency occurrence by activity. Based on these values, the average duration of the process is computed. The arrival rate per hour is then computed as the number of instances divided by the sojourn time.
Metric #4: Percentage of execution duration per activity: Shows the percentage of the execution duration of each activity with respect to the total duration of the process. Mesaurement Method
The Replay a Log for Petri Net plugin was also used to calculate this metric, making use of the Waiting time, sourjourn time and frequency of occurrence by activity variables, calculating the total duration time of the process, and the Percentage of execution duration by activity with respect to the total execution time.
Metric #5: Resource Saturation: It will calculate the number of instances executing a resource per hour. Mesaurement Method
For the calculation of this metric, the Inductive Visual Miner plugin was used, which given an event log, the Inductive Visual Miner automatically discovers a process model, compares this model with the event log and displays several improvements such as performance measures, queue lengths [20]. Obtaining from this execution the variables instance frequency and the sourjourn time in hours.
Metric #6: Percentage of execution duration per resource: It shows us the percentage of time it takes a resource to execute its activities with respect to the total time of the process.
Mesaurement Method
The Inductive Visual Miner plugin was also used to calculate this metric, obtaining from its execution the variable sourjourn time in hours. It is on the basis of this variable that the total duration time is calculated, and then we proceed to calculate the percentage of duration per resource using the formula:
(2) Metric #1: Transition Fitness
The low level of transition fitness is a sign of a deviation in the process execution flow. Looking at the result obtained, it can be seen that the activities: 1ST Box of PO and Creation of the Invoice / Last Box of PO present deviations in their execution. Performing a more in-depth analysis it could be concluded that currently, the main cause of disagreement of the process is given in activity 1ST BOX of OC with the registration of events given is due to the fact that, as can be seen in the image, it is usual to start receiving products without having completed the flow of approvals.
Metric #2: Inconsistencies with respect to the total instances of the initial activity:
created in the analyzed process, which is expected to generate the same invoice amount in this process, but as can be observed this activity only has a frequency of 14.42% with respect to the initial activity, as well as income creation activity that presents a frequency of 53.20%.
Metric #3: Arrival rate per hour:
The average number of instances per hour that the process executes is 2.50 and when comparing this figure with that of each activity, it can be observed that there are 4 activities below this ratio. This would be a clear indication that there is a possibility of bottlenecks in these activities.
Metric #4: Percentage of execution duration per activity: Since the average percentage of total execution duration is 9.09%, when comparing this with the percentage of each activity, it can be observed that there are four activities below this ratio. This would be a clear indication that there is a possibility of bottlenecks in these activities since they have a higher percentage of duration than the calculated average. Metric #5: Resource Saturation:
By having on average 6.25 executions per hour in the process, we compare this figure with the result of the metric for each resource, evidencing that the Head of category, Head of warehouse, GG. DIV. RETAIL and the Commercial P. Analyst perform fewer activities per hour than the average. This is an indication that these resources
In (2) DPR is the execution duration per resource, TD is the total execution duration and PED is the percentage of execution duration per resource metric.
F. Diagnose Phase
As a result of the application of the model, the following control metrics and their respective evaluation of results could be obtained: are saturated due to the high demand for execution of the instances they execute.
Metric #6: Percentage of execution duration per resource:
Since the average percentage of total execution duration is 14%, when comparing this figure with the percentage of each resource, it can be seen that there are 2 resources below this ratio. This would be a clear indication that there is the possibility that these resources generate a bottleneck in the process and complemented by metric 5, we can deduce that in the case of the category head this delay is due to the overload presented by the resource.
V. CONCLUSIONS
This article presents a model that allows the evaluation of business process performance and behavior through a set of control metrics using Process Mining techniques. It was developed to facilitate the evaluation of metrics that are useful for the analysis and detection of bottlenecks, deviations and resources involved in the analyzed process. The proposal was validated in a company in the retail sector where the event log of the purchasing management process was analyzed giving as a result of the application of the model and the evaluation of the proposed metrics, the identification of anomalies. The model was capable of assuring the quality of the analysis in the pre-processing phase, at the same time the application of the Process Mining methods for discovery, diagnose and conformance analysis were derived in control
metrics through the application of the algorithms and plugins implemented in the open source tool ProM Tools and the use of Qlikview for the presentation of results and application of the Process Cube.
REFERENCES
[1] Y. Wang, F. Caron, J. Vanthienen, L. Huang, and Y. Guo. “Acquiring logistics process intelligence: Methodology and an application for a Chinese bulk port”, Expert Systems with Applications, vol. 41, pp. 195–209. 2014
[2] W. van der Aalst. “Process Mining: Overview and Opportunities”. ACM Trans. Manage. Inf. Syst., vol. 3, pp. 7:1--7:17, 2012.
[3] W. M. P. van der Aalst, J. L. Zhao, and H. J. Wang. “Business Process Intelligence: Connecting Data and Processes”, ACM Transactions on Management Information Systems, vol. 5, pp. 1–7, 2015.
[4] A. Bolt, M. de Leoni, W. M. P. van der Aalst, and P. Gorissen. “Business Process Reporting Using Process Mining, Analytic Workflows and Process Cubes: A Case Study in Education”, Data-Driven Process Discovery and Analysis: 5th IFIP WG 2.6 International Symposium, vol. 244, pp. 28–53, 2017.
[5] M. Castellanos, A. K. Alves de Medeiros, J. Mendling, B. Weber, and A. J. M. M. Weijters, “Business Process Intelligence”. Handbook of Research on Business Process Modeling, pp. 456–480, 2009.
[6] W. M. P. van der Aalst. “Process Cubes: Slicing, Dicing, Rolling Up and Drilling Down Event Data for Process Mining”. Asia Pacific Business Process Management: First Asia Pacific Conference, Lecture Notes in Business Information Processing, vol 159, pp. 1–22, 2013. [7] J. T. S. Ribeiro, and A. J. M. M. Weijters. “Event Cube:
Another Perspective on Business Processes”, On the Move to Meaningful Internet Systems: OTM 2011, Lecture Notes in Computer Science, vol 7044 ,pp. 274– 283, 2011.
[8] A. Bolt, and W. M. P. van der Aalst, “Multidimensional Process Mining Using Process Cubes”, Enterprise, Business- Process and Information Systems Modeling: 16th International Conference, pp. 102–116, 2015. [9] M. Cho, M. Song, M. Comuzzi, and S. Yoo. “Evaluating
the effect of best practices for business process redesign: An evidence-based approach based on process mining techniques”, Decision Support Systems, vol. 104, pp. 92-103, 2017.
[10]J. Claes, and G. Poels. “Merging event logs for process mining: A rule based merging method and rule suggestion algorithm”, Expert Systems with Applications, vol. 41, pp. 7291–7306, 2014.
[11]M. O. Kherbouche, N. Laga, and P. A. Masse. “Towards a better assessment of event logs quality”. 2016 IEEE Symposium Series on Computational Intelligence, pp. 1-6, 2016.
[13]J. Wang, R. K. Wong, J. Ding, Q. Guo, and L. Wen. “Efficient Selection of Process Mining Algorithms”. IEEE Trans. Serv. Comput., vol. 6, pp. 484–496, 2013. [14]A. Adriansyah, J. Munoz-Gama, J. Carmona, B. F. van
Dongen, and W. M. P. van der Aalst. “Measuring precision of modeled behavior”. Information Systems and e-Business Management. vol. 13, pp. 37-67, 2015. [15]R. Conforti, M. La Rosa, and A. H. M. ter Hofstede.
“Filtering Out Infrequent Behavior from Business Process Event Logs”. IEEE Transactions on Knowledge and Data Engineering, vol. 29, pp. 300–314, 2017. [16]M. L. van Eck , X. Lu, , S. J. J. Leemans, and W. M. P.
van der Aalst. “PM 2 : A Process Mining Project Methodology”, Advanced Information Systems Engineering, Lecture Notes in Computer Science, vol 9097, pp. 297–313, 2015.
[17]P. T. Hornix. “Performance analysis of business processes through process mining”. Master’s Thesis, Eindhoven University of Technology, 2007.
[18]F. Mannhardt, M. de Leoni, and H. A. Reijers. “The Multi- perspective Process Explorer”. CEUR Workshop Proceedings, vol. 1418, pp. 130-134, 2015.
[19]F. Bezerra, J. Wainer, and W. M. P. van der Aalst. “Anomaly Detection Using Process Mining”. Lecture Notes in Business Information Processing, vol. 29, pp. 149-161, and 2009.