http://dx.doi.org/10.4236/am.2015.69142
From Nonparametric Density Estimation to
Parametric Estimation of Multidimensional
Diffusion Processes
Julien Apala N’drin1, Ouagnina Hili2
1Laboratory of Applied Mathematics and Computer Science, University Felix Houphouët Boigny, Abidjan,
Côte d’Ivoire
2Laboratory of Mathematics and New Technologies of Information, National Polytechnique Institute
Houphouët-Boigny of Yamoussoukro, Yamoussoukro, Côte d’Ivoire Email: [email protected], [email protected]
Received 17 June 2015; accepted 18 August 2015; published 21 August 2015 Copyright © 2015 by authors and Scientific Research Publishing Inc.
This work is licensed under the Creative Commons Attribution International License (CC BY).
http://creativecommons.org/licenses/by/4.0/
Abstract
The paper deals with the estimation of parameters of multidimensional diffusion processes that are discretely observed. We construct estimator of the parameters based on the minimum Hellin-ger distance method. This method is based on the minimization of the HellinHellin-ger distance between the density of the invariant distribution of the diffusion process and a nonparametric estimator of this density. We give conditions which ensure the existence of an invariant measure that admits density with respect to the Lebesgue measure and the strong mixing property with exponential rate for the Markov process. Under this condition, we define an estimator of the density based on kernel function and study his properties (almost sure convergence and asymptotic normality). After, using the estimator of the density, we construct the minimum Hellinger distance estimator of the parameters of the diffusion process and establish the almost sure convergence and the asymptotic normality of this estimator. To illustrate the properties of the estimator of the para-meters, we apply the method to two examples of multidimensional diffusion processes.
Keywords
Hellinger Distance Estimation, Multidimensional Diffusion Processes, Strong Mixing Process, Consistence, Asymptotic Normality
1. Introduction
are devoted to the parameter estimation of the drift and diffusion coefficients of diffusion processes by discrete observation. As a diffusion process is Markovian, the maximum likelihood estimation is the natural choice for parameter estimation to get consistent and asymptotical normally estimator when the transition probability den-sity is known [1]. However, in the discrete case, for most diffusion processes, the transition probability density is difficult to calculate explicitly which prevents the use of this method. To solve this problem, several methods have been developed such as the approximation of the likelihood function [2] [3], the approximation of the tran-sition density [4], schemes of approximation of the diffusion [5] or methods based on martingale estimating functions [6].
In this paper, we study the multidimensional diffusion model
(
)
(
)
dXt =a Xt,θ dt+b Xt,θ dWt, t≥0
under the condition that Xt is positive recurrent and exponentially strong mixing. We assume that the
diffu-sion process is observed at regular spaced times tk = ∆k where ∆ is a positive constant. Using the density of
the invariant distribution of the diffusion, we construct an estimator of θ based on minimum Hellinger distance method.
Let fθ denote the density of the invariant distribution of the diffusion. The estimator of θ is that value (or values) ˆθn in the parameter space Θ which minimizes the Hellinger distance between fθ and ˆfn, where
ˆ
n
f is a nonparametric density estimator of fθ.
The interest for this method of parametric estimation is that the minimum Hellinger distance estimation me-thod gives efficient and robust estimators [7]. The minimum Hellinger distance estimators have been used in parameter estimation for independent observations [7], for nonlinear time series models [8] and recently for un-ivariate diffusion processes [9].
The paper is organized as follows. In Section 2, we present the statistical model and some conditions which imply that Xt is positive recurrent and exponentially strong mixing. Consistence and asymptotic normality of
the kernel estimator of the density of the invariant distribution are studied in the same section. Section 3 defines the minimum Hellinger distance estimator of θ and studies its properties (consistence and asymptotic normal-ity). Section 4 is devoted to some examples and simulations. Proofs of some results are presented in Appendix.
2. Nonparametric Density Estimation
We consider the d-dimensional diffusion process solution of the multivariate stochastic differential equation:
(
)
(
)
dXt=a Xt,θ dt+b Xt,θ dWt, t≥0, (1) where
{ }
Wt t≥0 is a standard l-dimensional Wiener process, θ is an unknown parameter which varies in acompact subset Θ of s
, : d d
a × Θ → is the drift coefficient and : d d l
b × Θ → × is the diffu-sion coefficient.
We assume that the functions a and b are known up to the parameter θ and b is bounded. We denote by θ0 the unknown true value of the parameter.
For a matrix A, the notation t
A denote the transpose of the matrix A. We will use the notation . to de-note a vectorial norm or a matricial norm.
The process Xt is observed at discrete time tk = ∆k where ∆ is a positive constant.
We make the following assumptions on the model: (A1): there exists a constant C such that
( ) (
, ,)
( ) (
, ,)
a xθ −a yθ +b xθ −b yθ ≤C x−y
(A2): there exist constants M0>0 and r>0 such that
( )
, , , 0 where .,. denotes the scalar product ind
a xθ x ≤ −r x x ≥M
(A3): the matrix function b x
(
,θ)
is non degenerate, that is(
) (
)
| | 1
inf inf t , , t 0, d.
Assumptions (A1)-(A3) ensure the existence of a unique strong solution for the Equation (1) and an invariant
measure for the process
{ }
Xt that admits a density with respect to the Lebesgue measure and the strongmix-ing property for
{ }
Xt with exponential rate [10]-[12]. We denote by α the strong mixing coefficient.In the sequel, we assume that the initial value X0 follows the invariant law; which implies that the process
{ }
Xt is strictly stationary.We consider the kernel estimator fˆn
( )
x of fθ( )
x that is,( )
1
1
ˆ n k , d
n d
k n
n
x X
f x K x
b nb =
−
= ∈
∑
where
( )
bn is a sequence of bandwidths such that bn→0 and d nnb → +∞ as n→ +∞ and K:d →+ is a non negative kernel function which satisfies the following assumptions:
(A4)
(1) There exists N1>0 such that K
( )
. ≤N1< +∞,(2)
∫
K x( )
dx=1 and x K xd( )
→0 as x → ∞, (A5)∫
u K ui( )
du=0 and( )
2 d
i
u K u u< ∞
∫
for i=1,,d.We finish with assumptions concerning the density of the invariant distribution: (A6) fθ
( )
. is twice continuously differentiable with respect to x.(A7) θ1≠θ2 implies that fθ1
( )
x ≠ fθ2( )
x for all dx∈ .
Properties (consistence and asymptotic normality) of the kernel density estimator are examined in the follow-ing theorems. The proof of the two theorems can be found in the Appendix.
Theorem 1. Under assumptions (A1)-(A4), if the function fθ
( )
x is continuous with respect to x for all θ ∈ Θ, then for any positive sequence( )
bn such that bn→0 andd n
nb → +∞ as n→ +∞, fˆn
( )
x → fθ( )
xalmost surely.
Theorem 2. Under assumptions (A1)-(A6), if
( )
bn is such that4
0
d n
nb + → as n→ +∞ then the limiting distribution of nbnd
(
fˆn( )
x −fθ( )
x)
is(
( )
)
2 0,
N τ x where
( )
( )
( )
2 2
d .
d
x fθ x K u u
τ =
∫
3. Estimation of the Parameter
The minimum Hellinger distance estimator of θ is defined by:
(
)
2 ˆ
ˆ Arg min ,
n θ H fn fθ θ
∈Θ
=
where
(
)
{
( )
( )
2}
1 21 2 1 2
2 ˆn, d ˆn d .
H f fθ =
∫
f x −fθ x xLet denote the set of squared integrable functions with respect to the Lebesgue measure on d
. Define the functional T:→ Θ as follows: let g∈ and denote:
( )
{
: 2(
,)
min 2(
,)
}
A g H fθ g H fγ g
γ
θ
∈Θ
= ∈ Θ =
where H2 is the Hellinger distance.
If A g
( )
is reduced to an unique element, then T g( )
is defined as the value of this element. Elsewhere, we choose an arbitrary but unique element of A g( )
and call it T g( )
.Theorem 3. (almost sure consistency)
Assume that assumptions (A1)-(A4) and (A7) hold. If for all
d
x∈ , fθ
( )
x is continuous at θ0, then forany positive sequence
( )
bn such that bn →0 and d nnb → +∞, ˆθn converges almost surely to θ0 as
n→ +∞.
Using the inequality
(
a1 2−b1 2)
2≤ −a b for a b, ≥0, we get(
)
( )
2( )
( )
2 1 2 1 2
2 ˆn, d ˆn ( ) d d ˆn d .
H f fθ =
∫
f x − fθ x x≤∫
f x − fθ x x
Since
( )
( )
ˆ d d 1,
dfn x x= dfθ x x=
∫
∫
(
0)
2
2 ˆ ,n 0
H f fθ → almost surely [13] [14].
By theorem 1 [7], T f
( )
θ0 =θ0 uniquely on Θ; then the functional T is continuous at fθ0 in the Hellin- ger topology. Therefore θˆn=T f( )
ˆn →T f( )
θ0 =θ0 almost surely.This achieves the proof of the theorem. Denote
2 1 2
, g , tg
gθ fθ gθ θθ gθ θ θθ
∂ ∂
= = =
∂ ∂ ∂
when these quantities exist. Furthermore, let
( )
{
( ) ( )
}
1( )
( )
( )
1 2
d and ( ) .
2
d
t g x
V x g x g x x g x h x
f x
θ
θ θ θ θ θ
θ −
=
∫
= To prove asymptotic normality of the estimator of the parameter, we begin with two lemmas.
Lemma 1. Let E be a subset of n
d
and denote E the complementary set of nc En. Assume that
(1) assumptions (A1)-(A5) are satisfied,
(2) hθ0
( )
. is twice continuously differentiable with respect to x and( )
0( )
( )
0 0
2
2 2
2
d 0 d 0 1, , ,
n n
n E n E
i
h y
nb f y y and nb f y y for i d
y θ
θ θ
∂
→ → =
∂
∫
∫
(3)
(
(
) ( )
)
( )
( )
( )
0 0 0 0
1 2
d d 0 d 0,
c d c
n n n
E E
n
∫ ∫
hθ y ub+ K u u fθ y y→ and n∫
gθ y fθ y y→ (4) h20( )
X1 for some 0,δ
θ+ < ∞ δ >
then for any positive sequence
( )
bn such that bn→0, the limiting distribution of( ) ( )
( )
( ) ( )
0 0 0
1
ˆ d is 0, where d .
4
d
t n
nhθ x f x x N Γ Γ = gθ x gθ x x
∫
∫
The proof can be found in the Appendix.
Remark 1. The two dimensional stochastic process (see Section 4) with invariant density
( )
(
2 2)
, exp
π
fθ x y = βσ −βx −σy , β >0, σ >0
where θ=
(
β σ,)
, satisfies the conditions of Lemma 1 with for example En =[
wn;+∞ ×[ [
wn;+∞[
a subset of2
where wn=n.
Lemma 2. Let G be a compact set of n
d
and denote by c n
G the complementary set of Gn. Suppose that
assumptions (A1)-(A6) are satisfied and:
(1) 1 21 0
( )
01( )
(
d 2( ) (
0)
d d)
0n n
d G n
h x f x K t f x tb t x
n b θ θ θ
− − →
∫
∫
( )
( )
( ) (
)
0 0 0
1 1
1 2
3 2
1
d d 0
d n
q r n
d d p G n
h x f x K t f x tb t x
n b θ θ θ
+ −
+
∫
∫
− →(3)
( )
( )
0( )
0 0
2 2
1 2 4 1
2
1 d 0 for 1, ,
n
n G
i
f x
n b h x f x x i d
x
θ
θ θ−
∂
+ → =
∂
∫
(4) c 0
( )
1 20( )
d 0n
G
n
∫
gθ x fθ x x→(5)
( )
(
( ) (
)
)
0 0 d d 0
c d
n n
G
n
∫
hθ x∫
K u fθ x ub+ u x→ then( )
(
( )
( )
)
0 0
2
1 2 1 2
ˆ d 0 in probability as .
d
n n
R =
∫
nhθ x f x − fθ x x→ n→ +∞
The proof can be found in the Appendix.
Remark 2. Let Gn= −
[
v vn; n] [
× −v vn; n]
a compact set of 2 where
{
v nn, ≥1}
is a sequence of positivenumbers diverging to infinity. Let
(
( )
)
1 2
log
n r
n b
n
= , 1 1
8< <r 4 and
(
log( )
)
q n
v = n , 1 1
2< <q , then the two dimensional stochastic process with invariant density
( )
(
2 2)
, exp
π
fθ x y = βσ −βx −σy , β >0, σ >0 where θ=
(
β σ,)
, satisfies the conditions of Lemma 2.Theorem 4. (asymptotic normality)
Under assumption (A7) and conditions of Lemma 1 and Lemma 2, if
(1) for all d
x∈ , gθ is twice continuously differentiable at θ0,
(2) the components of 0 gθ and
0
gθ belong to L2 and if the norms of these components are continuous
functions at θ0,
(3) θ0 is in the interior of Θ and
∫
gθ0( ) ( )
x gθ0 x dx is a non-singular matrix, then the limitingdistribu-tion of nθˆn−θ0 is
(
)
2 0,N λ where
( ) ( )
{
0 0}
1
2 1
d . 4 d
t
gθ x gθ x x
λ =
∫
−Proof. From Theorem 2 [7], we have:
( )
( )
( )
{
}
( )
( )
( )
{
}
( ) ( )
{
}
( )
( )
( )
( )
( )
( )
0 0
0 0
0 0 0 0
0 0
1 2 1 2
0
1 2 1 2
1
1 2 1 2
1 2 1 2
ˆ
ˆ d
ˆ d
ˆ
d d
ˆ d
d
d
d d
d
n n
n n
t
n
n n
n n V x f x f x x
n A g x f x f x x
g x g x x ng x f x f x x
A ng x f x f x x
θ θ
θ θ
θ θ θ θ
θ θ
θ θ
−
− = −
+ −
= −
+ −
∫
∫
∫
∫
∫
where An is a (m × m) matrix which tends to 0 as n→ +∞.
We have
( )
( )
( )
( )
0( )
(
( )
( )
0( )
)
00 0
2
1 2 1 2
1 2 1 2
1 2 1 2
ˆ ˆ
ˆ .
2 2
n n
n
f x f x
f x f x
f x f x
f x f x
θ θ
θ
θ θ
− −
− = −
Denote
( )
( )
( )
0 0
1 2 1 2
ˆ d .
d
n n
D =
∫
ngθ x f x − fθ x x
( )
( )
( )
( )
( )
(
( )
( )
( )
)
( )
( )
( )
( )
( )
( ) ( )
0 0
0 0
0 0
0
0 0
0
0
2
1 2 1 2
1 2 1 2
1 2 1 2
ˆ ˆ
d d
2 2
1
ˆ d d
2 2
ˆ d
d d
d d
d
n n
n
n n
n n
f x f x
f x f x
D ng x x ng x x
f x f x
g x
n f x x ng x f x x R
f x
nh x f x x R
θ θ
θ θ
θ θ
θ
θ θ
θ
θ
− −
= −
= − −
= −
∫
∫
∫
∫
∫
where
( )
(
( )
( )
)
0 0
2
1 2 1 2
ˆ d .
d
n n
R =
∫
nhθ x f x − fθ x x
By Lemma 2, Rn →0 in probability as → ∞; then, the limiting distribution of nθˆn−θ0 is reduced to
that of
( ) ( )
{
0 0}
0( ) ( )
1
ˆ
d d
d d
t
n
gθ x gθ x x − nhθ x f x x
∫
∫
since An →0. But
( ) ( )
( )
( ) ( )
0 0 0
1
ˆ d 0, with d from lemma 1.
4
d d
t n
nhθ x f x x→N Γ Γ = gθ x gθ x x
∫
∫
Therefore the limiting distribution of
( ) ( )
{
0 0}
0( ) ( )
(
)
1
2 ˆ
d d is 0,
d d
t
n
gθ x gθ x x nhθ x f x x N λ
−
∫
∫
where
( ) ( )
{
0 0}
2 0( ) ( )
0{
0( ) ( )
0}
12 1 1
d d d .
4 4
d d d
t t t
gθ x gθ x x gθ x gθ x x gθ x gθ x x
λ =
∫
−∫
=∫
−This completes the proof of the theorem.
4. Examples and Simulations
4.1. Example 1
We consider the two-dimensional Ornstein-Uhlenbeck process solution of the stochastic differential equation
0 0
dZt =AZ ttd +dWt, Z =z (2) where
0
, 0, 0
0
A β β σ
σ −
= > > −
Let Z=
(
X Y,)
and z=( )
x y, , we have:( )
, 0 ,( )
, 1 0 and(
,)
0 0 1
x
a z b z b
y
β
θ θ θ β σ
σ −
= = = =
−
a z
( )
,θ and b z( )
,θ satisfy assumptions (A1)-(A3). Therefore, Zt is exponentially strong mixing andthe invariant distribution µθ admits a density fθ with respect to the Lebesgue measure. Furthermore [15], µ =θ N
( )
0,Γ , the Gaussian distribution on 2with Γ the unique symmetric solution of the equation is
0 where .
t t
The solution of the Equation (3) is
1 0 2
1 0
2 β
σ
Γ =
.
Therefore [16], the density of the invariant distribution is
( )
(
2 2)
, exp
π
fθ x y x y
βσ β σ
= − −
The minimum Hellinger distance estimator of θ is defined by:
(
)
2 ˆ ˆ Arg min ,
n θ H fn fθ
θ
∈Θ
=
where
(
)
{
2( )
( )
}
1 2 2
1 2 1 2
2 ˆn, ˆn , , d d
H f fθ =
∫
f x y −fθ x y x y with( )
( )
(
2 2)
1 1
2 1
1
ˆ , and , exp
π
n
k k
n
k n n
n
x X y Y
f x y K K f x y x y
b b
nb θ
βσ β σ
=
− −
= = − −
∑
where K1 is a kernel function which satisfies conditions (A4) and (A5) such that K1
( ) ( )
x K1 y =K x y( )
, .Let W =
(
W( )1,W( )2)
, we can write Equation (2) as follows:( )
( )
1 2
d 0 d
d
d 0 d
t t t
t t t
X X W
t
Y Y W
β σ
−
= +
−
which gives the the following system
( )
( )
1 2
d d d
d d d
t t t
t t t
X X t W
Y Y t W
β σ = − +
= − +
Thus,
( )
Xt t≥0 and( )
Yt t≥0 are two independent univariate Ornstein-Uhlenbeck processes of parameters βand σ respectively.
We now give simulations for different parameter values using the R language. For each process, we generate sample paths using the package “sde” [17] and to compute a value of the estimator, we use the function “nlm” [18] of the R language. The kernel function K1 is the density of the standard normal distribution. We use the
bandwidth n log0.24
( )
n b
n
= according to conditions on the bandwidth in the paper.
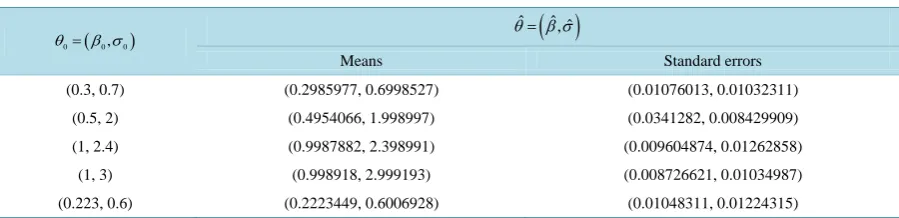
[image:7.595.89.539.611.720.2]Simulations are based on 1000 observations of the Ornstein-Uhlenbeck process with 200 replications. Simulation results are given in theTable 1.
Table 1. Means and standard errors of the minimum Hellinger distance estimator.
( )
0 0, 0
θ = β σ θˆ=
( )
β σˆ ˆ,Means Standard errors
(0.3, 0.7) (0.2985977, 0.6998527) (0.01076013, 0.01032311)
(0.5, 2) (0.4954066, 1.998997) (0.0341282, 0.008429909)
(1, 2.4) (0.9987882, 2.398991) (0.009604874, 0.01262858)
(1, 3) (0.998918, 2.999193) (0.008726621, 0.01034987)
In Table 1, θ0 denotes the true value of the parameter and ˆθ denotes an estimation of θ0 given by the
minimum Hellinger distance estimator. Simulation results illustrate the good properties of the estimator. Indeed, the means of the estimator are quite close to the true values of the parameter in all cases and the standard errors are low.
4.2. Example 2
We consider the Homogeneous Gaussian diffusion process [19] solution of the stochastic differential equation
(
)
0 0dXt = A+BXt dt+σdWt, X =x (4) where σ >0 is known, W is a two-dimensional Brownian motion, B is a 2 2× matrix with eigenvalues with strictly negative parts and A is a 2 1× matrix. By condition on the matrix B, X has an invariant probability
(
,)
N m
µ = Γ where m= −B A−1 and Γ is the unique symetric solution of the equation 1 0
0 where and with .
0 1
t t
C+ Γ + Γ =B B C=DD D=σI I =
(5)
Let
1 11 12
11 22
2 12 22
and wit 0 and 0.
A α B β β h β β
α β β
= = < <
As in [19], we suppose that σ = 2. In the following, we suppose that β β11 22−β122 ≠0.
Then we have
22 12 2 12 1 22
1
2 2
12 11 1 12 2 11
11 22 12 11 22 12
1 1
and .
B β β m α β α β
β β α β α β
β β β β β β
− = − = −
− −
− −
Let a b
b d
Γ =
, we have
2 0 0 2 C=
.
(
)
11 12
12 11 22 12
12 22
1
0 0
1
t
a b
C B B a b d
b d
β β
β β β β
β β
+ = −
+ Γ + Γ = ⇔ + + + =
+ = −
11 12
12 11 22 12
12 22
0 1
0
0 1
a b d
β β
β β β β
β β
−
⇔ + =
−
Let
11 12
12 11 22 12
12 22
0 0
G
β β
β β β β
β β
= +
and
1 0
1
H
− = −
, we have det
( ) (
G = β11+β22)
(
β β11 22−β122)
≠0; G isinvertible and we have
22
22 12 1
12
2 2
12 11
11 22 12 11 22 12
11
1 1
and .
a
b G H
d
β
β β β
β β
β β β β β β β
−
−
−
= = Γ =
− − −
−
Γ is invertible and we have 1 11 12
12 22
β β
β β
− − −
Γ = − −
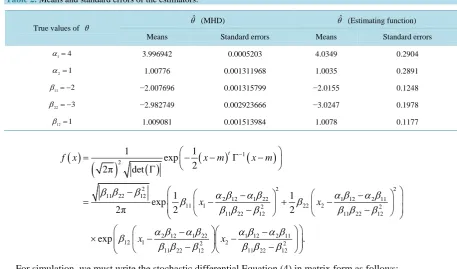
Table 2. Means and standard errors of the estimators.
True values of θ
ˆ
θ (MHD) θˆ (Estimating function)
Means Standard errors Means Standard errors
1 4
α = 3.996942 0.0005203 4.0349 0.2904
2 1
α = 1.00776 0.001311968 1.0035 0.2891
11 2
β = − −2.007696 0.001315799 −2.0155 0.1248
22 3
β = − −2.982749 0.002923666 −3.0247 0.1978
12 1
β = 1.009081 0.001513984 1.0078 0.1177
( )
( )
( )
(
)
(
)
1 2
2 2 2
11 22 12
2 12 1 22 1 12 2 11
11 1 2 22 2 2
11 22 12 11 22 12
2 12 1 22 1 12 2 11
12 1 2 2 2
11 22 12 11 22 12
1 1
exp 2 2π det
1 1
exp
2π 2 2
exp
t
f x x m x m
x x
x x
β β β α β α β α β α β
β β
β β β β β β
α β α β α β α β β
β β β β β β
−
= − − Γ −
Γ
− − −
= − + −
− −
− −
× − −
− −
.
For simulation, we must write the stochastic differential Equation (4) in matrix form as follows: ( )
( )
( )
( )
( )
( ) ( )
( ) ( )
( )
( )
1 1 1
1 11 12
(2)
2 2
2 12 22
1 2 1
1 11 12
1 2 2
2 12 22
d 0 d
d
0 d
d
d 0 d
0 d
t t t
t
t t
t t t
t t t
X X W
t
W
X X
X X W
t
X X W
α β β σ
α β β σ
α β β σ
σ
α β β
= + +
+ +
= +
+ +
As in [19], the true values of the parameter θ=
(
α α β β β1, 2, 11, 22, 12)
are θ =0(
4,1, 2, 3,1− −)
and σ = 2.Then, we have
( )
( )
( ) ( )
( ) ( )
( )
( )
1 1 2 1
2 1 2 2
d 4 2 2 0 d
d
0 2
d 1 3 d
t t t t
t t t t
X X X W
t
X X X W
− +
= +
+ −
Now, we can simulate a sample path of the Homogeneous Gaussian diffusion using the “yuima” package of R language [20]. We use the function “nlm” to compute a value of the estimator.
We generate 500 sample paths of the process, each of size 500. The kernel function and the bandwidth are those of the previous example.
We compare the estimator obtained by the minimum Hellinger distance method (MHD) of this paper and the estimator obtained in [19] by estimating function.Table 2 summarizes results of simulation of means and stan-dard errors of the different estimators.
Table 2shows that the two estimators have good behavior. For the two methods, the means of the estimators are close to the true values of the parameter. But the standard errors of the MHD estimator are lower than those of the estimating function estimator.
References
[1] Dacunha-Castelle, D. and Florens-Zmirou, D. (1986) Estimation of the Coefficients of a Diffusion from Discrete Ob-servations. Stochastics, 19, 263-284. http://dx.doi.org/10.1080/17442508608833428
[3] Yoshida, N. (1992) Estimation for Diffusion Processes from Discrete Observation. Journal of Multivariate Analysis, 41, 220-242. http://dx.doi.org/10.1016/0047-259X(92)90068-Q
[4] Aït-Sahalia, Y. (2002) Maximum Likelihood Estimation of Discretely Sampled Diffusions: A Closed-Form Approxi-mation Approach. Econometrica, 70, 223-262. http://dx.doi.org/10.1111/1468-0262.00274
[5] Florens-Zmirou, D. (1989) Approximate Discrete-Time Schemes for Statistics of Diffusion Processes. Statistics, 20, 547-557. http://dx.doi.org/10.1080/02331888908802205
[6] Bibby, B.M. and Sørensen, M. (1995) Martingale Estimation Functions for Discretely Observed Diffusion Processes.
Bernoulli, 1, 17-39. http://dx.doi.org/10.2307/3318679
[7] Beran, R. (1977) Minimum Hellinger Distance Estimates for Parametric Models. Annals of Statistics, 5, 445-463.
http://dx.doi.org/10.1214/aos/1176343842
[8] Hili, O. (1995) On the Estimation of Nonlinear Time Series Models. Stochastics: An International Journal of
Probabil-ity and Stochastic Processes, 52, 207-226. http://dx.doi.org/10.1080/17442509508833972
[9] N’drin, J.A. and Hili, O. (2013) Parameter Estimation of One-Dimensional Diffusion Process by Minimum Hellinger Distance Method. Random Operators and Stochastic Equations, 21, 403-424.
http://dx.doi.org/10.1515/rose-2013-0019
[10] Bianchi, A. (2007) Nonparametric Trend Coefficient Estimation for Multidimensional Diffusions. Comptes Rendus de
l’Académie des Sciences, 345, 101-105.
[11] Pardoux, E. and Veretennikov, Y.A. (2001) On the Poisson Equation and Diffusion Approximation. I. The Annals of
Probability, 29, 1061-1085. http://dx.doi.org/10.1214/aop/1015345596
[12] Veretennikov, Y.A. (1997) On Polynomial Mixing Bounds for Stochastic Differential Equations. Stochastic Process, 70, 115-127. http://dx.doi.org/10.1016/S0304-4149(97)00056-2
[13] Devroye, L. and Györfi, L. (1985) Nonparametric Density Estimation: The L1 View. Wiley, New York.
[14] Glick, N. (1974) Consistency Conditions for Probability Estimators and Integrals of Density Estimators. Utilitas
Ma-thematica, 6, 61-74.
[15] Jacobsen, M. (2001) Examples of Multivariate Diffusions: The Time-Reversibility, a Cox-Ingersoll-Ross Type Process. Department of Statistics and Operations Research, University of Copenhagen, Copenhagen.
[16] Caumel, Y. (2011) Probabilités et processus stochastiques. Springer-Verlag, Paris.
http://dx.doi.org/10.1007/978-2-8178-0163-6
[17] Iacus, S.M. (2008) Simulation and Inference for Stochastic Differential Equations. Springer Series in Statistics, Sprin-ger, New York. http://dx.doi.org/10.1007/978-0-387-75839-8
[18] Lafaye de Micheaux, P., Drouilhet, R. and Liquet, B. (2011) Le logiciel R: Maitriser le langage-Effectuer des analyses statistiques. Springer-Verlag, Paris. http://dx.doi.org/10.1007/978-2-8178-0115-5
[19] Sørensen, H. (2001) Discretely Observed Diffusions: Approximation of the Continuous-Time Score Function.
Scandi-navian Journal of Statistics, 28, 113-121. http://dx.doi.org/10.1111/1467-9469.00227
[20] Iacus, S.M. (2011) Option Pricing and Estimation of Financial Models with R. John Wiley and Sons, Ltd., Chichester.
http://dx.doi.org/10.1002/9781119990079
[21] Roussas, G.G. (1969) Nonparametric Estimation in Markov Processes. Annals of the Institute of Statistical Mathemat-ics, 21, 73-87. http://dx.doi.org/10.1007/BF02532233
[22] Bosq, D. (1998) Nonparametric Statistics for Stochastic Processes: Estimation and Prediction. Second Edition, Sprin-ger-Verlag, New York. http://dx.doi.org/10.1007/978-1-4612-1718-3
[23] Dharmenda, S. and Masry, E. (1996) Minimum Complexity Regression Estimation with Weakly Dependent Observa-tions. IEEE Transactions on Information Theory, 42, 2133-2145. http://dx.doi.org/10.1109/18.556602
Appendix
A1. Proof of Theorem 1
Proof.
( )
( )
(
( )
( )
)
(
( )
)
( )
( )
(
)
(
( )
)
ˆ ˆ ˆ ˆ ( )
ˆ ˆ ˆ ( )
n n n n
n n n
f x f x f x f x f x f x
f x f x f x f x
θ θ
θ
− = − + −
≤ − + −
We have: Step 1:
( )
( )
(
)
( )
1 1
1 1
ˆ
1
d 1
d .
d
d
n
k
n d d
k n n
n n
d
n n
d
n n
x X x X
f x K K
b b
nb b
x u
K f u u
b b
t
K f x t t f x
b b
θ
θ θ
=
− −
= =
−
=
= − →
∑
∫
∫
by Theorem 2.1 [21]. Hence
( )
ˆ ( ) 0.
n
f x −f xθ →
(6) Step 2:
( )
( )
1
1
ˆ ˆ n
n n d k
k n
f x f x Y
nb =
− =
∑
where
k k
k
n n
x X x X
Y K K
b b
− −
= −
( )
Yk =0 Yk ≤2N1Then by theorem 2.1 [9], we have for all >0
2 2
1 1 2 1
1
1 1
2 exp .
2 2
3
d
n n
d n
k k n
d d
k k
n n
nb
Y Y b C
n
nb N b
Y
= =
> = > ≤ −
+
∑
∑
We have
2 2
2 1 1 2 1 1
1
2
2 1 2 1
2
2 1 1
1 1
1 1
n n n n
d d
n d n d
n n
n n
d d
n d n d
n n
n n
x X x X x X x X
Y K K K K
b b b b
x X x X
b K b K
b b
b b
x X x X
b K b K
b b
b b
− − − −
= − = −
− − = −
− −
= −
d
n n
b A
where
( )
2( )
d .
d
n
A → fθ x
∫
K u uThen
2 2 2
1 1 1
1
2 exp 2 exp .
2
2 2
2
3 3
d d
n
n n
k
d d
k
n d n
n n n
nb nb
Y C C
N
nb N b A
b A
=
> ≤ − ≤ −
+ +
∑
Therefore
( )
( )
ˆ ˆ 0 almost surely,
n n
f x −f x → (7) by the Borel-Cantelli’s lemma.
(6) and (7) imply that
( )
( )
ˆ almost surely.
n
f x → fθ x This achieves the proof of the theorem.
A2. Proof of Theorem 2
Proof.
( )
( )
(
ˆ)
(
ˆ( )
ˆ( )
)
(
ˆ( )
( )
)
.d d d
n n n n n n n
nb f x − fθ x = nb f x −f x + nb f x − fθ x (1)
By making the change of variable
n
x u t
b
−
= and using assumptions (A4) and (A5), we get:
( )
( )
(
)
( )
( )
( )
(
)
( )
{
}
( )
( ) ( )
( )
( )
( )
( )
2
2 2
, 2
4 2
2 1 4
ˆ 1
d d 1
d 2!
1
d 1
2 1 2
d
d
d
d
d n n
d
n d
n n d
n n
d d
n i j n n
i j i j
d d
n i
i i
d n
nb f x f x
x u
nb K f u u f x
b b
nb K t f x tb f x t
f x
nb K t t t b o b t
x x
f x
nb t K t t o
x
nb
θ
θ θ
θ θ
θ
θ +
=
+
−
−
= −
= − −
∂
= − +
∂ ∂
∂
= +
∂
=
∫
∫
∑
∫
∑
∫
( )
( )
( )
2
2 2 1
d 1 0 as .
d
d
i
i i
f x
t K t t o n
x θ
=
∂
+ → → +∞
∂
∑
∫
(2)
( )
( )
(
)
( )
1 21
ˆ ˆ n
d d
n n n n k
k
nb f x f x nb − Y
=
− =
∑
where
.
k k
k
n n
x X x X
Y K K
b b
− −
= −
We have
( )
Yk =0 and Yk ≤2N1.Let p= p n
( )
, q=q n( )
and r=r n( )
be positive integers which tend to infinity as n→ ∞ such that(
)
<(
1)
r p+q ≤n r p+ +q . Define Um and Vm by
( )( )
( )( )
( )( )
( )
1
1 1 1 1
, , 1, ,
m p q p m p q
m k m k
k m p q k m p q p
U Y V Y m r
− + + +
= − + + = − + + +
=
∑
=∑
= and
( )
1
1
.
n
r k
k r p q
V+ Y
= + +
=
∑
We have
1
1 1 1
.
n r r
k m m
k m m
Y U V
+
= = =
= +
∑
∑
∑
Step 1: We prove that
( )
1 1 2
1 0
r d
n m
m
nb V
+ −
=
→
∑
in probability. By Minkowski’s inequality, we have( )
( )
(
) (
)
( )
(
) (
)
1 2 2
1 1 2 1 2
1 2 1 2 2 2
1
1 1
1 2 1 2
1 2 2 2
1 1
r r
d d
n m n m r
m m
d
n r
nb V nb V V
nb r V V
+
− −
+
= =
−
+
≤ +
≤ +
∑
∑
(1) Using Billingsley’s inequality [22],
( )
( )
( )
(
)
( )
(
)
( )
( )
( )
( )
2
2 2
1 1
1
1 1
2 2 2
1 1 1 1 1
1 1
1
2 2 2 2
1 1 1 1
1 1
2
2 32
32 with 32 .
p q
k i j
k p i j
p q p q
p j
j p j p
q
j j
V Y q Y Y Y
q Y q Y Y q Y N j p
q Y N j qC C Y N j
α
α α
+
= + <
+ − + −
+ +
= + = +
− ∞
= =
= = +
≤ + ≤ + −
≤ + ≤ = +
∑
∑
∑
∑
∑
∑
(2)
( )
(
(
)
)
( )
( )
2
2 2
1 1
1
2 .
n
r k i j
k r p q i j
V+ Y n r p q Y Y Y rC
= + + <
= = − + + ≤
∑
∑
Hence,
( )
1 2 1 2( )
(
)
1 2 1 2
1
r
d d
n m n
m
nb V C nb r q r
+
− −
=
≤ +
∑
Therefore, choosing q=q n r
( )
, =r n( )
and bn such that0 as ,
d n
r q
n nb
→ → ∞ (8) we get
( )
1 2 1 2 10.
r d
n m
m
nb V
+ −
=
→
∑
which implies that
( )
1 2 1 10 in probability.
r d n m m nb V + − = →
∑
Step 2: asymptotic normality of
( )
1 21
r d
n m
m
nb − U
=
∑
.m
U , m=1,,r have the same distribution; so that
(
)
(
(
1)
)
1
exp exp .
r r m m itU itU = =
∏
From Lemma 4.2 [23], we have
(
)
(
)
(
)
(
)
(
) (
)
( )
1
1 1 1
1 1
exp exp exp exp
exp exp 4 1 1 4 .
r
r r
r
m m m
m m m
r r
m m
m m
it U itU it U itU
itU itU r α q rα q
= = = = = − = − = − ≤ − + ≤
∑
∑
∏
∏
∏
Setting φ1
( )
t =exp(
itU1)
. If q=q n( )
and r=r n( )
are chosen such that( )
0 as ,rα q → n→ ∞ (9) the charasteristic function of
( )
1 21
r d
n m
m
nb − U
=
∑
is 1(
( )
1 2)
r d
n
t nb
φ − which is the charasteristic function of
1 r m m Z =
∑
where Zm, m=1,,r are independent random variables with distribution that of
( )
1 2 1
d n
nb − U . We have
( )
Zm =0 and( ) ( )
( ) ( )
( )
( )
( )
( )
2
1 1
2 2 2
1 1 1
1 2 1 2 2 . p r d d
m n n i j
m i j
p
i j
d d
i j
n n
Z r Z nb r U nb r p Y Y Y
rp r
Y Y Y
nb nb − − = < < = = = + = +
∑
∑
∑
(1)
( )
( )
( )
2
2 2 1 1 2
1 1 1 d . d d n
d d d
n n
n n n
x X x X
rp rp
Y K b K f x K u u
n b b
nb b b θ
− − = − →
∫
(2) Note that α
( )
k ≤exp(
−λk)
=ϕ( )
k with λ >0.( )
(
)
( )
( )
( )
( )
(
)
(
( )
)
( )
(
)
(
( )
)
( )
(
)
1 1 21 1 1
1 1
2 1 1 2 1 1
1 1
1 1
2 1 1
1 2 1 2 1
1 2
1 2 1 2
1 1 1 2 1 2 1 1
2 2 2
16 32 32 32 32 32 p p
i j j
d d d
i j j j
n n n
p p p p
d d
k l k k l k
n n
p p
d k l k n d k l n d i n
r r r
Y Y j Y Y N j j
nb nb nb
N r N r
l l nb nb N r l k nb N r k l nb N r i nb α α α ϕ ϕ ϕ ϕ ϕ − − +
< = =
− − − − = = = = − − = = ∞ ∞ = = ∞ = ≤ ≤ ≤ ≤ ≤ ≤ ≤
∑
∑
∑
∑∑
∑∑
∑∑
∑
∑
∑
20 if d 0 as .
( )
( )
2
2 1
d as .
d
r m m
Z fθ x K u u n
=
→ → ∞
∑
∫
Since the random variables Um
(
m=1,,r)
have the same distribution, then by Lyapunov’s theorem [24], the limiting distribution of( )
1 21
r d
n m
m
nb − U
=
∑
is N(
0,τ2( )
x)
where
( )
( )
( )
2 2
d .
d
x fθ x K u u
τ =
∫
The condition (8), (9) and (10) are satisfied, for example, with
( )
( ) ( )
( )
1 4( )
1 4 log( )
3log , , and with 0 .
log 4
d n
n n
r n n p n n q n n b
n nλ λ
∼ ∼ − ∼ = < <
This achieves the proof of the theorem.
A3. Proof of Lemma 1
Proof. The proof of the lemma is done in two steps. Step 1: we prove that
( ) ( )
( )
0 0
1
1
ˆ d 0 in probability.
d
n
n n i
i
Y n h x f x x h X
n θ θ = = − →
∫
∑
( )
( )
( )
( )
( )
( )
(
) ( )
( )
( )
(
) ( )
( )
( )
0 0 0
0 0 0
0 0 0
0 0 0
1 1 1 2 1 1 d d 1 d d d d d d . d d d d d n c d n n n n d
i n i
n d n n n E n E n n x y
Y n h x K x h y f y y
b n
nb
x y
n h x K x h y f y y
b b
n h y ub K u u h y f y y
n h y ub K u u h y f y y
I I
θ θ θ
θ θ θ
θ θ θ
θ θ θ
= = − = − − = − = + − + + − = +
∑
∑
∫ ∫
∫ ∫
∫ ∫
∫ ∫
With assumptions (A4) and (A5), we have
(
)
( ) ( )
( )
( )
( ) ( )
( )
( )
( )
( )
( )
( )
( )
( )
( )
( )
( )
0 0 0
0 0 0 0 0 0 0 1 2 2 2 , 2 2 2 2 1 2 2 2 2 1 2 d d 1 d d 2! 1
d 1 d
2 1
d 1 d
2 1 2 d n d n d n d n n
n E n
d
i j n n E
i j i j
d
n E i
i i
d
n E i
i i
n E
i
I n h y ub h y K u u f y y
h y
n u u b o b K u u f y y
y y
h y
nb u K u u o f y y
y
h y
nb u K u u o f y y
y
nb f y
θ θ θ
θ θ θ θ θ θ θ = = = = + − ∂ = + ∂ ∂ ∂ = + ∂ ∂ ≤ + ∂ ≤
∫ ∫
∑
∫ ∫
∑
∫ ∫
∑
∫
∫
∫
( )
(
( )
)
( )
0 2 2 2 1d 1 d
0 as .
d
d
i i
h y
u K u u o y