Munich Personal RePEc Archive
US multinational activity abroad and US
jobs: substitutes or complements?
Harrison, Ann and McMillan, Margaret S. and Null, Clair
University of California, Berkeley
2006
US Multinational Activity Abroad and US Jobs: Substitutes or
Complements?
*
Ann E. Harrison Margaret S. McMillan Clair Null
UC Berkeley Tufts University UC Berkeley
NBER NBER
March 2006
*For assistance with data the authors would like to thank Raymond Mataloni, Joan Hamory, Fritz Foley and Stanley Watt. For helpful comments we wish to thank David Card and the fellows at the Radcliffe Institute for Advanced Study, especially Larry Katz. For financial assistance the authors gratefully acknowledge the National Science Foundation. McMillan acknowledges the Radcliffe Institute for Advanced Study for both financial support and time to devote to this project. Views expressed in this paper are those of the authors and do not necessarily reflect those of the Bureau of Economic Analysis. The statistical analysis of firm-level data on U.S. multinational companies was conducted at the International Investment Division, Bureau of Economic Analysis, U.S. Department of Commerce under arrangements that maintain legal confidentiality requirements. The views expressed in this paper are those of the authors and do not reflect official positions of the U.S. Department of Commerce.
329 Giannini Hall, UC Berkeley, Berkeley, California 94720, 510-643-9676, email: [email protected]
Tufts University Department of Economics, 617 627 3137, email: [email protected]
US Multinational Activity Abroad and US Jobs: Substitutes or Complements?
Ann E. Harrison Margaret S. McMillan Clair Null
University of California Berkeley Tufts University UC Berkeley
NBER NBER
I. Introduction
Critics of globalization claim that US firms are shutting down factories at home and
shifting employment abroad to countries with cheaper labor and lower labor standards. Yet the
evidence, beyond anecdotes, is slim. Are US employers really shifting employment abroad,
expanding affiliate employment at the cost to US manufacturing employment? The limited
evidence on this question is inconclusive. Working papers by Brainard and Riker (1997a, 1997b)
find that jobs abroad do substitute for jobs at home but the effect is small. They also find that
employment in developing countries by US firms is very sensitive to the cost of labor. A more
recent working paper by Desai, Foley and Hines (2005) finds the opposite – an increase in the number of jobs abroad is associated with an increase in the number of jobs at home. Amiti and
Wei (2005) also find evidence to support the notion that US multinationals treat US and foreign
labor as complementary: when a US multinational firm expands employment abroad,
employment at home also increases. In a now infamous press release for the Economic Report
of the President (2004), Greg Mankiw pointed out that US outsourcing is good for the US
economy.
Despite the rosy expectations of most of these academic economists, union leaders and
journalists are less optimistic. The newspapers are filled with anecdotes of plants closing
operations in the US to relocate operations abroad. While most of these stories emphasized the
manufacturing sector in the past, interest has recently shifted to services. Stories about textile
and garment factories closing in Texas and elsewhere have been replaced by fears of US
programming jobs being lost to highly skilled Indians in Bangalore. In France, fears of lost jobs
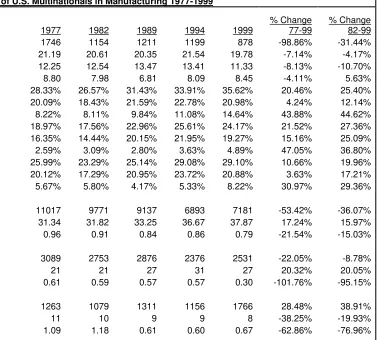
There is no question that the share of jobs and investment by US based multinationals is
increasingly located overseas (see Tables 1 and 2 in this paper). Anecdotal evidence also
suggests that the relocation of jobs overseas is not just confined to low-skill labor. For example,
in a recent survey of firms in the computer industry, researchers found that the second most
important determinant of an overseas production site was the availability and cost of skilled
labor.1 In July, 2003, the New York Times reported that IBM is thinking of accelerating the
relocation of white-collar, high paying jobs to China, India, the Philippines, Russia and other
countries.2 In January 2004, the Wall Street Journal reported that IBM expects to save $168
million dollars annually by shifting several thousand high-paying programming jobs overseas.3
In this paper, we use simple stylized facts to show that the degree of “complementarity” between US and foreign labor depends on (1) the location of foreign affiliates and (2) the level of
aggregation of the data. By doing this, we are able to reconcile the arguments for
“complementarity” between economic activity at home and abroad with anecdotal evidence in
the popular press of factory closings and downward pressure on wages. Our data are firm level
data collected by The Bureau of Economic Analysis (BEA) in Washington, D.C. on
employment, wages, net-income and investment. These firms accounted for approximately 60
percent of US sales and employment in manufacturing, 70 percent of exports, and 80 percent of
private R and D in manufacturing during the 1980s and 1990s (Mataloni et al, 1996). We focus
primarily on trends in employment at home and abroad, separating employment in low-income
countries and employment in other industrialized countries.
1
See McMillan et al (1999)
2
We begin by describing the data and documenting the trends in key variables for US
multinationals in both manufacturing and services. Between 1977 and 1999 multinational
manufacturing firms shed more than 3 million jobs in the United States. Affiliates in
high-income countries shed around half a million jobs while the number of jobs in affiliates in
low-income countries expanded by between half (77-99) and three quarters of a million (82-99). Real
wages increased in the US based multinationals and in high-income country affiliates while they
fell in low-income affiliates. In all three locations, labor’s share of income fell, suggesting that wages increases failed to compensate for aggregate job losses (see Table 1).
We then report correlations between employment at home and abroad at the firm level. At
the firm level, employment expansions and contractions in US multinational parents and their
affiliates on average move in the same direction. This positive correlation between jobs at home
and abroad suggests that foreign employment for US multinationals is complementary to
domestic employment. However, these averages mask significant heterogeneity across different
kinds of enterprises. For parents that hire workers in developing countries – roughly half the sample – the story is different. For these firms, there is substitution between employment at home and employment abroad. This evidence highlights the importance of differentiating
between jobs in low-income countries and jobs in other industrialized countries. It is consistent
with the notion that some firms do relocate activity abroad to reduce their total wage bill. Our
evidence also suggests that while some jobs have been “exported abroad”, this is only part of the
explanation for the sharp contraction in parent employment. While three million jobs were lost in
the United States, the net increase in jobs in developing countries was at most three quarters of a
million, suggesting a general trend in all parts of the globe towards substituting capital for labor.
3
We then examine broad correlations between employment at home and abroad by
aggregating the firm-level data to the industry level. This exercise is important because US firms
could respond to global opportunities in ways other than through substituting employment in the
US for affiliate employment elsewhere. If US firms simply close down operations, then
employment at home could be replaced by employment abroad through substitution across firms.
In other words, substitution can occur both within the same firm and between firms as some
firms exit and their activity is taken over by affiliates of other US firms. This second kind of
substitution is likely to be overlooked if researchers focus purely on within firm effects. Both
Brainard and Riker (1997a, 1997b) and Desai, Foley and Hines (2004) restrict their analysis to
within firm changes, which misses this possible reallocation of employment—from the US to foreign affiliates--across firms within a sector. This kind of substitution can – at least partially – be captured by studying employment patterns at the industry level. Studying employment
patterns at the industry level has the additional advantages of capturing patterns in the data due to
entry and exit or heterogeneity due to firm size.
Our preliminary analysis suggests that some substitution did occur at the industry level.
Some parents reduced employment in the US, while other US parents in the same sector
increased employment abroad through the establishment and expansion of their affiliates.4
While there is broad complementarity between US and foreign jobs for many sectors, foreign
employment in developing countries has replaced US employment in several highly visible
both in the US and abroad. The fact that there were US jobs lost to foreign affiliates in key
sectors, while at the same time there was broad complementarity in hiring (and firing) across
parents and affiliates, helps to explain why economists are painting a rosy picture of
globalization’s impact on US labor and at the same time there is negative news coverage for
declining industries.
This research is part of a larger research agenda among international and labor economists
that aims to identify how globalization is affecting the jobs and lives of American workers.
Many researchers who examine the links between globalization and labor markets conclude that
much of the increase in inequality and falling unskilled worker wages is due to skill-biased
technical change. It is frequently difficult to disentangle technical change from the effects of
globalization. Related work includes research by Slaughter (2001), Rodrik (1997), and
Richardson and Khripounova (1996). These authors have argued that globalization is affecting
labor by increasing the elasticity of labor demand. However, Slaughter’s (2001) study shows that
the rising elasticity of demand for unskilled labor cannot be easily linked to different measures of
globalization. Budd and Slaughter (2000) show that union wage determination in Canada is
affected by changing profits in both Canada and the United States. Their work suggests that
globalization does affect union wages, although they do not test for the impact on labor shares or
for the impact on non-unionized workers. Rob Feenstra and Gordon Hanson have done a
number of studies analyzing the effect of outsourcing on labor market outcomes; their work is
reviewed in Feenstra and Hanson (2003).
4
In Section II, we begin by outlining broad trends in employment and wages for US parent
companies and their affiliates in developed and developing countries. We report these trends
separately for manufacturing and services. The results document the large fall in manufacturing
employment at home, and increasing affiliate employment in developing countries. The results
also point to large increases in activities of US multinationals in services, with expanding
employment both at home and abroad. In Section III, we report the correlations between hiring
and firing at home and abroad for US multinationals. We then turn to the industry-level patterns,
showing the relationship between employment at home and abroad for both manufacturing and
services. Section IV concludes, and points to directions for further research.
II. Broad Trends in US Multinational Activity: the BEA Data
We analyze the firm-level surveys on US direct investment abroad, collected each year
by the Bureau of Economic Analysis (BEA) of the U.S. Department of Commerce. The BEA
collects confidential data on the activities of US based multinationals defined as the combination
of a single US entity that has made the direct investment, called the parent, and at least one
foreign business enterprise called the foreign affiliate. We use the data collected on
majority-owned non-bank foreign affiliates and non-bank US parents for the benchmark years between
1977 and 1999. The benchmark years are 1977, 1982, 1989, 1994 and 1999 and include more
comprehensive information than the annual surveys. To our knowledge, very little work has been
done with the firm-level data using the entire length of the time series from 1977 through 1999.
Creating a panel using the benchmark years of the BEA survey data is a nontrivial task.
years. Second, because we are interested in understanding what is happening at the industry
level, we must consider the implications of the changes to the Standard Industrial Classification
(SIC) codes in 1972 and 1987 and the switch from SIC codes to the North American Industrial
Classification System (NAICS) codes in 1997. Third, because the BEA parent identification
codes changed between 1977 and 1982, we had to create a bridge linking the 1977 parents to the
1982 parents5. And finally, the fact that parents are allowed to consolidate information for
several affiliates in one country on a single form calls for special care in the aggregation and
interpretation of affiliate level data.
All foreign affiliates with sales, assets or net income in excess of a certain amount in
absolute value must report to the BEA. This amount was $.5 million dollars in 1977, $3 million
dollars in 1982, 1989 and 1994 and jumped to $7 million dollars in 1999. In addition, a new
reporting requirement was imposed on parents in 1999. Parents whose sales, assets or net income
exceeded $100 million (in absolute value) were required to provide more extensive information
than parents whose sales, assets or net income fell below $100 million6. To determine whether
the changes in reporting requirements biased our sample toward small firms in the early years,
we imposed a double filter on the data using the uniform cutoff for affiliates of $5.59 million
1982 US dollars and $79.87 1982 US dollars for parents. As it turns out, the reporting
requirements were large enough that imposing the filter on the data makes little difference.
Therefore, we use all of the available data.
5
Prior to our arrival, a bridge had been created but it was incomplete, only linking around 25% of the parents from 1977 to parents in 1982. With our bridge based on employee identification numbers, we are able to link more than 50% of the parents from 1977 to parents in 1982.
6
To document what has happened within industries in manufacturing over time, we
created a concordance that allows us to assign SIC codes to NAICS codes. This was necessary
because in 1999, the BEA collected data on NAICS codes and not SIC codes. We chose to
convert SIC codes to NAICS codes on the grounds that the NAICS codes more accurately
describe production processes. The 1977 and 1982 benchmark years are based on the 1972 SIC
codes. The 1989 and 1994 benchmark years are based on the 1987 SIC codes. The 1999
benchmark data are based on the 1997 NAICS codes. In addition to the fact that the industry
codes are not directly comparable across all benchmark years, the BEA industry codes have been
slightly modified to reflect that fact the these are enterprise data and are called respectively
SIC-ISI and NAICS-SIC-ISI. Working with these codes, we created a program (available upon request)
that assigns the SIC-ISI codes for the years 1977-1994 to NAICS-ISI codes.
Linking parents from 1977 to the remaining benchmark years proved relatively
straightforward. This is because in addition to a parent identification code created by the BEA
(which changed between 1977 and 1982), each parent has an employee identification number
(EIN) assigned to it by the Internal Revenue Service which did not change during the period
1977-1999. Using the EIN number plus the country in which the affiliate operates, we are also
able to track parent/affiliate pairs over time.
While the number of US parents included in the BEA sample may appear small (see
Table 1), these enterprises accounted for the majority of economic activity in US manufacturing
for approximately 60 percent of total manufacturing sales in the United States.7 In 1994, these
enterprises accounted for 66 percent of all exports of goods, and nearly 60 percent of
employment in manufacturing. These enterprises also account for most of US research and
development expenditures: in 1994, the US parents included in the BEA sample accounted for 82
percent of total US research and development expenditures.
The variables we use are reported to the BEA on the basis of the fiscal year. General
trends in employment weighted averages are reported in Table 1 for manufacturing and in Table
2 for services. The numbers in Table 2 include all firms classified in services under the SIC
classification prior to 1997 and under the NAICS system post-1997. Because the NAICS system
classifies some industries as services that were not previously classified as services, the
employment numbers are slightly exaggerated. However, when we restrict our analysis of
services to only those sub-categories that can be exactly matched across years, we get nearly
identical trends.
Table 1 shows that between 1977 and 1999 multinational manufacturing firms shed more
than 3 million jobs in the United States89. In addition, Table 1 also documents that labor’s share of income in the US has fallen from ninety to seventy five percent. The loss of jobs in the U.S.
has been mirrored by job reductions in affiliates in developed countries. In developed country
affiliates, employment fell by roughly half a million. Labor’s share and wages in the developed countries follow the US labor share and wages although in the developed country affiliates,
7See the December 1996 issue of the Survey of Current Business, “Op
erations of US Multinational Companies:
Preliminary Results from the 1994 Benchmark Survey”, by Mataloni and Fahim-Nader, as well as the authors’ own calculations.
8
labor’s share is substantially lower as are real wages. These job losses have been only partially
offset by an increase in the number of jobs in developing countries, where the number of jobs
increased by half a million between 1977 and 1999 and by three quarters of a million between
1982 and 1999. In developing countries, labor’s share also fell. Unlike in the developed countries, real wages paid by US based multinationals to employees in their developing country
affiliates has actually fallen. The evidence for the US parents is in line with the aggregate trends
in the U.S. manufacturing sector. According to the NBER Manufacturing Productivity Database,
labor’s share in value-added declined from .53 to .31 – roughly 50% - over the period 1958 to
1996. Over the period of time for which the two datasets overlap, real wages, employment and
labor’s share in income all move in the same direction – down.
There has been a substantial shift in activity from developed to developing country
affiliates. Affiliate employment as a share of total employment globally for US multinationals
increased from 28 percent in 1977 to 35 percent in 1999. The increase was almost entirely
driven by a doubling of affiliate employment shares in developing countries, from 8 to 15
percent. Affiliate employment in developed countries, as a share of total worldwide
employment, remained roughly constant over the entire period at around 20 percent. Total
affiliate share of employment, employee compensation, and investment in the firms' total has
increased by 26, 27 and 12 percent respectively. This increase in overseas activity has been
largely reserved for developing countries where the respective increases are 78, 89 and 45
percent respectively.
9
The increase in developing country activity has been accompanied by a reduction in
labor's share at the parent level of 18 percent. Labor's share has also fallen overseas: by around
27 percent in developed country affiliates and 39 percent in developing country affiliates.
Although part of the reduction in labor’s share in the parent and in developed country affiliates is
driven by reductions in employment, the reduction in labor's share in developing countries is not:
employment in developing country affiliates increased by 46 percent. Though not shown in the
table, our data indicate that there was a 120 percent increase in the number of non-production
workers hired in developing countries.
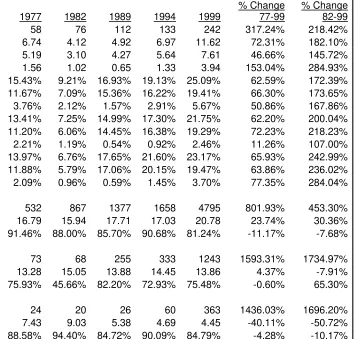
The contraction in domestic jobs in the manufacturing sector has been more than offset
by job creation in the services sector. Table 2 shows that between 1977 and 1999, employment
by US parents increased by more than 4 million or 802 percent. Expansion at home has been
more than matched by expansion abroad. In developed country affiliates employment increased
from 73 thousand in 1977 to 1.2 million in 1999 and in developing country affiliates employment
went from 24 thousand in 1977 to 363 thousand in 1999. While the share of affiliate activity still
counts for less than the share of affiliate activity in manufacturing, it has grown much more
rapidly in services than in manufacturing. Affiliate share of employment, employee
compensation, and investment in the firms' total has risen by 63, 62 and 66 percent respectively.
Except for affiliate share of compensation, this increase in overseas activity has been fairly
evenly spread between developed and developing country affiliates. This increase in developing
country activity has been accompanied by a reduction in labor's share at the parent level of 11
Tables 1 and 2 suggest that job losses in the manufacturing sector may have been offset
by employment increases in the service sector. However, it is important to keep in mind that
throughout the period 1977-1999, real compensation per worker in the service sector amounts to
little more than half of real compensation per worker in the manufacturing sector. This may be
partly a reflection of the change in the mix of workers in the US manufacturing sector-- if
unskilled US workers have been replaced by unskilled foreign workers then the average wage in
the US manufacturing sector reflects the wages of skilled workers. However, the fact that this
differential existed even in 1977 before the big contraction in US manufacturing suggests that
this is not the only reason for the difference. Since data on the composition of employment for
US parents is less detailed than the information on the skill mix of foreign affiliates, it is difficult
to reach any strong conclusions on this point. What tables 1 and 2 do show is that employment
in manufacturing has shifted to services, and that average compensation in services was well
below compensation in manufacturing even at the start of the sample period.
III. Employment at Home and Abroad
This section discusses broad trends in the pattern of employment changes in US parents
and their affiliates. We restrict our analysis to the period 1982 to 1999 for comparability with
the work by Brainard and Riker (1997a, 1997b) and Desai et al (2005) who used these same data
beginning in 1982.10 We begin by reporting activities within the same enterprise over time. To
test whether US parents are substituting US employment with affiliate employment, we created a
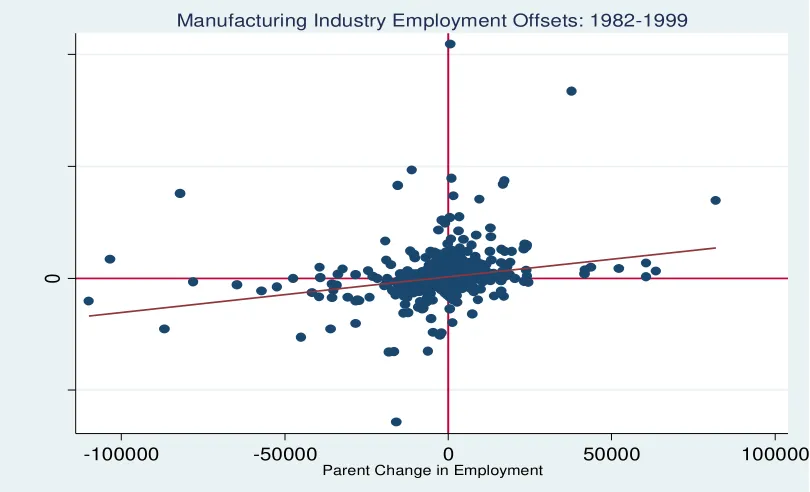
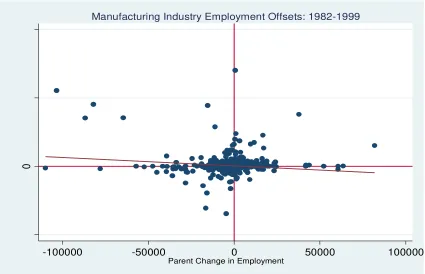
series of employment offsets at the firm level. Figures 1through 3 track the same parent and its
affiliates over time, documenting the extent of hiring and firing within the same parent and its
10
affiliates11. We begin with all affiliates and all parents, for the entire period 1982 through 1999
and then separate the sample to examine employment changes in high and low-income countries.
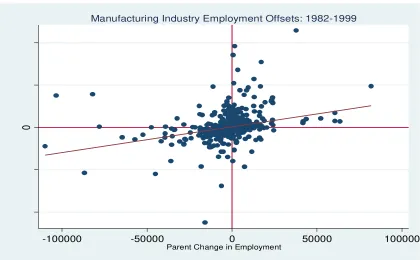
In all three figures, the horizontal axis represents changes in parent employment between 1982
and 1999 while the vertical axis represents changes in affiliate employment over this same
period. Points in the upper right hand side quadrant and lower left hand side quadrant represent
complementarity: firms expanding(contracting) at home are also expanding(contracting) abroad.
Critics of globalization have focused on the upper left hand side quadrant where a contraction at
home corresponds with an expansion abroad.
Figure 1 shows that for all affiliates employment abroad and employment at home are
complementary. Most of the firm activity is on the diagonal quadrants in Figure 1 – this is confirmed by the positively sloped regression line. The cluster of points around zero suggests
that for the majority of firms, employment changes both at home and abroad have been tiny.
Figure 2 plots the relationship between employment at home and employment in high-income
affiliates. The story is similar to that found in Figure 1 with the complementarity slightly more
pronounced. The employment offsets for the US parent and its developing country affiliates
shown in Figure 3 are somewhat different, however. In this case, the majority of firms lie in the
off-diagonal quadrants as confirmed by the downward sloping regression line. However, the fact
that the line is practically flat (albeit downward sloping) suggests that the relationship between
employment in developing countries and employment at home may not be that important.
11
We need to be somewhat careful about calling these changes in employment hires and fires as some of the activity might simply reflect acquisitions and spin-offs. However, at least in the aggregate, since most sales of US
Figures 1 to 3 report trends in employment within the same enterprise. However, it is
possible that much of the substitution away from US employment towards employment abroad
has occurred between enterprises. Some firms may have contracted US employment while other
firms expanded affiliate employment. These possibilities cannot be captured by tracking the
same enterprise over time. By tracking within firm changes in employment, we also miss entry
and exit. This is potentially very important because we miss large firms that may have shut down
altogether. To the extent that this happens in conjunction with small increases in employment at
home and abroad in other firms we would see complementarity in the firm level results and
substitution at the industry level.
Finally, the data in Figures 1 through 3 suggest that it is important to distinguish between
“small” and “large” firms. The positive correlations between employment at home and abroad
could be driven by the small changes that are relatively symmetrically distributed around zero.
Since our focus is employment, we would like to give extra weight to the firms that hire
relatively more workers. An informal way of doing this is aggregating up to the industry level.
The small changes around zero will disappear and we will be left with the net effect of
employment changes in the large firms which are not so symmetrically distributed around zero.
To address all of these possibilities, we turn now to trends in employment at the aggregate
industry level.
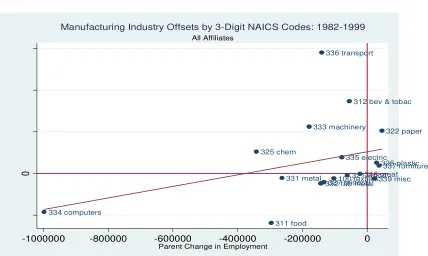
Figure 4 reports employment offsets at the 3-digit level for the manufacturing sector.
Changes in parent (US) total employment are indicated by the horizontal axis and changes in
affiliate total employment are indicated by the vertical axis. A point in the upper right-hand
quadrant indicates contraction at home and abroad. Substitution occurs if data points are either
in the upper left-hand quadrant (indicating contraction at home and expansion in affiliate
employment) or in the lower right-hand quadrant (indicating expansion at home and contraction
abroad). Most US critics of globalization center on supposed activity in the upper left-hand
quadrant, which would indicate expansion of affiliate employment and contraction of
employment in the US; so-called substitution of foreign for US jobs. As Figure 4 shows, most of
the activity of US manufacturing multinational enterprises has taken place in the lower left-hand
quadrant, indicating employment contraction both at home and abroad.
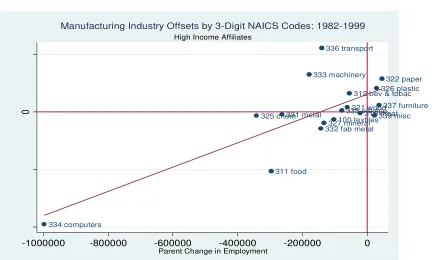
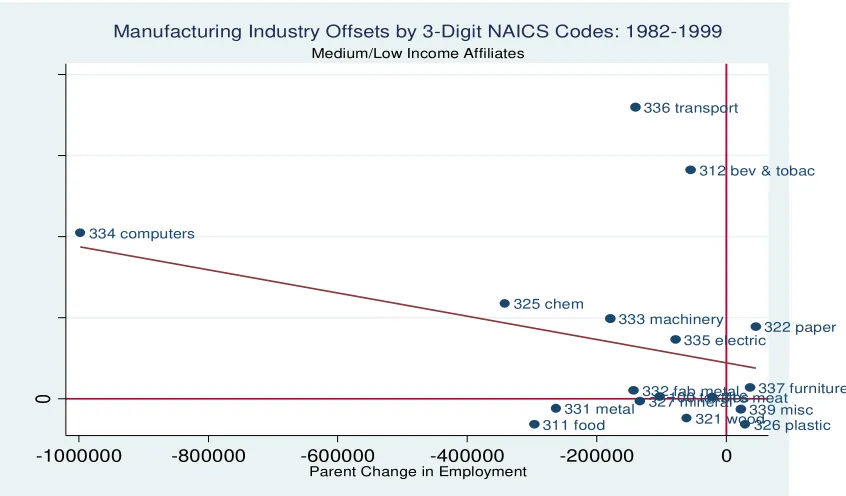
Figures 5 and 6 separate changes in employment from 1982 to 1999 based on the location
of the parent’s affiliates. Figure 5 reports employment offsets at the 3 digit level for developed country affiliates and parents; Figure 6 reports the same trends for developing country affiliates.
The trends are similar across Figures 4 and 5 – employment in high-income affiliates and parent
employment are complementary but that relationship is driven by the contraction in
manufacturing. However, Figure 6 reveals that employment in low-income affiliates substitutes
for employment in the US. Moreover, the downward sloping regression line appears to be driven
by contraction in two key sectors: computers and electronics.
Why are the firm and industry offsets so different? We mentioned three possibilities that
deserve further elaboration: entry and exit, firm size and across firm substitution. Roughly one
quarter of the job losses in our sample are due to firm “deaths” and not a sale or acquisition. Entrants account for a relatively small number of jobs. We do not pick these firms up when we
do the within firm analysis. Additionally, small firms (with less than 15,000 employees) account
affiliates only in high-income countries while the large firms tend to have affiliates in both high
and low-income countries. Since the small firms are more numerous, they cloud somewhat the
story in the within firm offsets.
While the stylized facts reported in this paper are useful for explaining why opinions on
the outsourcing of US jobs are so different, these facts don’t tell us enough about the underlying mechanisms at work. The fact that substitution occurs only between US jobs and jobs in
low-wage countries suggests that labor costs are important. An alternative explanation could be based
on differential demand shocks. Individuals in countries at the low end of the income distribution
may exhibit different preferences than those in high-income countries and/or US multinationals
may be better at marketing their products abroad than at home. Yet the explanation for
substitution of US jobs most popular in the US press is a story about labor costs: labor is
relatively cheaper in developing countries, therefore profit seeking US multinationals fire
expensive US workers and hire workers in low-income countries. To properly identify the causal
mechanisms at work, we are developing a conceptual framework that incorporates both of these
possibilities.
Finally, we wish to emphasize the aggregate employment shift towards services. We saw
in Tables 1 and 2 that the contraction in manufacturing employment by US parents was largely
offset by increasing service sector employment. One recent concern is that the kind of
employment substitution we observe between some developing country affiliates and the US
parent is now occurring in the service sector as well. Though not reported here, our data indicate
that -- at least for the period 1977 to 1999--this was not the case. Unlike the employment offsets
(indicating contraction at home and abroad), the offsets indicate that in services12 all the activity
is in the upper right-hand side quadrant. Although the recent concerns regarding offshoring or
outsourcing of service sector employment may be valid, the aggregate trends for the period
between 1977 and 1999 in the BEA services data do not support such claims.
IV. Concluding Comments
This paper outlines broad trends in US multinational employment at home and abroad.
Over the period 1977 to 1999 multinational manufacturing firms have shed more than 3 million
jobs in the United States. During this period, labor’s share of income has fallen and real wages have increased. The loss of jobs in the U.S. has been partially offset by an increase in the number
of jobs in developing countries. Even overseas, as the number of jobs has increased, real wages
and labor’s share of income have declined. These labor market outcomes have been accompanied
by a substantial shift in the operations of US multinationals abroad.
We then examine the relationship between employment changes at home and abroad for
US multinational firms, presenting evidence on trends in both manufacturing and services. We
also report broad trends in employment patterns both at the US parent and at its affiliates. We
document that whether employment changes in the US parent and its affiliates tend to move in
the same direction depends upon whether the jobs abroad are in low-income or high-income
countries. Jobs in low-income affiliates are substitutes for US jobs while jobs in high-income
affiliates are complementary with US jobs. Thus, the sharp contraction in US manufacturing jobs
between 1977 (1982) and 1999 was accompanied by a contraction in jobs in high-income
12
affiliates. While we focused primarily on the manufacturing sector in this paper, we do find
evidence that in the service sector there has been job expansion both for the US parents and its
foreign affiliates in high and low-income countries.
The substitution of jobs in low-income countries for jobs in the US is even stronger at the
industry level. One reason is because many of the US enterprises that previously manufactured in
the United States are no longer active, indicating that it is necessary to analyze behavior
between, rather than within, enterprises. Another reason is because much of the job relocation to
developing countries has occurred within large enterprises, and industry-level results give more
weight to large enterprises. At the industry level, there has been significant job relocation in a
number of key areas: computers, electronics and transportation. At the industry level,
employment offsets for the US parent and its developing country affiliates indicate that
employment is not complementary: expansion abroad is accompanied by contraction in the
United States.
The kinds of employment shifts documented in this paper are natural in light of the
differences in labor costs in the US and in its developing country affiliates. In addition, the
tables and graphs also make clear that employment in manufacturing has been contracting almost
everywhere, presumably due to technological change which makes it possible to substitute
capital for labor. Our ultimate goal--which is beyond the scope of this paper--is to estimate the
extent to which technological change versus global cost pressures can explain aggregate
employment contraction and rising capital intensity. It is also important to remember that
substitution of foreign jobs for US jobs may have saved some US jobs; some firms were able to
Bibliography
Abowd, John and Thomas Lemieux, “The Effects of Product Market Competition on Collective
Bargaining Agreements: The Case of Foreign Competition in Canada”, Quarterly Journal of
Economics , 1993, 108(4), 983-1014.
Aitken, Brian, Ann Harrison and Robert Lipsey, "Wages and Foreign Ownership: A
Comparative Study of Mexico, Venezuela, and the United States", Journal of International
Economics, May 1996, Vol. 40, Nos. 3/4, pages 345-371.
Amiti, Mary and Shang-Jin Wei, “International Service Outsourcing, Productivity and Employment:
Evidence from the US”, IMF Working Paper WP/05/xx, September 2005.
Blanchard, Olivier, “The Medium Term”, Brookings Papers on Economic Activity, 2:1997.
Brainard, Lael and David Riker, “US Multinationals and Competition from Low Wage Countries”,
NBER Working Paper 5959, March 1997a.
Brainard, Lael and David Riker, “Are US Multinationals Exporting US Jobs?”, NBER Working Paper
5958, March 1997b.
Budd, John W. And Matthew Slaughter, “Are Profits Shared Across Borders? Evidence on
International Rent Sharing”, NBER Working Paper Number 8014, November 2000.
Currie, Janet and Ann Harrison, "Sharing the Costs: the impact of trade reform on capital and labor in
Desai, Mehir, Fritz Foley and James Hines, “Foreign Direct Investment and Domestic Economic
Activity,” Harvard Business School Working Paper, November 2004
Feenstra, Robert C., and Gordon Hanson, “Globalization, Outsourcing, and Wage Inequality,” AER
Papers and Proceedings, 297-322, 1996.
Feenstra and Hanson (2003), “Global Production Sharing and Rising Inequality: A Survey of Trade and
Wages”, Forthcoming, Handbook of International Economics.
Hanson, Gordon, and Ann Harrison, “Who Gains from Trade Reform? Some Remaining Puzzles”,
Journal of Development Economics, No. 59: 125-154, 1999.
Harrison, Ann, “Has Globalization Eroded Labor’s Share? Evidence from Cross-country Data”,
manuscript in progress, 2003.
Kennan, John, “Simultaneous Equations Bias in Disaggregated Econometric Models”, Review of
Economic Studies, No. 56: 151-156, 1989.
Kanbur, Ravi, "Economic Policy, Distribution and Poverty: The Nature of Disagreements", World
Development, 2001.
Mataloni, Raymond J. Jr. “U.S. Mulitnational Companies: Operations in 1997”, Survey of Current
Business, July 1999
Preliminary Results From the 1994 Benchmark Survey”, Survey of Current Business, December
1996
McMillan, Margaret, Selina Pandolfi and Lynn Salinger, "Promoting Labor Intensive Exports in
Developing Countries: Evidence from the Textile and Electronics Industries", Harvard Center for
International Development, CAER working paper no. 22, May 1999.
Poterba, James, “Recent Developments in Corporate Profitability: Patterns and Explanations”, Mimeo,
March 1997.
Rama, Martin and Raquel Artecona, “A Database of Labor Market Indicators Across Countries”,
unpublished manuscript, Washington, DC:The World Bank, June 25, 2002
Richardson, J. David and Elena B. Khripounova, “U.S. Labor Market Power and Linkages to
International Trade: Indentifying Suspects and Measures”, Draft for U.S. Department of
Labor, 1998.
Rodrik, Dani, Has Globalization Gone Too Far?, Institute for International Economics, Washington,
D.C., 1997.
Slaughter, Matthew, “Production transfer within multinational enterprises and American wages”,
Journal of International Economics, 50 (2), 449-472, April, 2000.
Slaughter, Matthew, “International Trade and Labor-Demand Elasticities”, Journal of International
Table 1: Trends of U.S. Multinationals in Manufacturing 1977-1999
Variable 1977 1982 1989 1994 1999
% Change 77-99
% Change 82-99
Number of Parents 1746 1154 1211 1199 878 -98.86% -31.44%
Number of Countries in which Parents Have Affiliates 21.19 20.61 20.35 21.54 19.78 -7.14% -4.17%
Developed Countries 12.25 12.54 13.47 13.41 11.33 -8.13% -10.70%
Developing Countries 8.80 7.98 6.81 8.09 8.45 -4.11% 5.63%
Affiliate Share of Jobs 28.33% 26.57% 31.43% 33.91% 35.62% 20.46% 25.40%
Developed Country Affiliate Share of Jobs 20.09% 18.43% 21.59% 22.78% 20.98% 4.24% 12.14%
Developing Country Affiliate Share of Jobs 8.22% 8.11% 9.84% 11.08% 14.64% 43.88% 44.62%
Affiliate Share of Compensation 18.97% 17.56% 22.96% 25.61% 24.17% 21.52% 27.36%
Developed Country Affiliate Share of Compensation 16.35% 14.44% 20.15% 21.95% 19.27% 15.16% 25.09%
Developing Country Affiliate Share of Compensation 2.59% 3.09% 2.80% 3.63% 4.89% 47.05% 36.80%
Affiliate Share of Total Investment 25.99% 23.29% 25.14% 29.08% 29.10% 10.66% 19.96%
Developed Country Affiliate Share of Investment 20.12% 17.29% 20.95% 23.72% 20.88% 3.63% 17.21%
Developing Country Affiliate Share of Investment 5.67% 5.80% 4.17% 5.33% 8.22% 30.97% 29.36%
Parents
Total Employment 11017 9771 9137 6893 7181 -53.42% -36.07%
Real Total Compensation (per worker) 31.34 31.82 33.25 36.67 37.87 17.24% 15.97%
Labor's Share 0.96 0.91 0.84 0.86 0.79 -21.54% -15.03%
Developed Country Affiliates: All
Total Employment 3089 2753 2876 2376 2531 -22.05% -8.78%
Real Total Compensation (per worker) 21 21 27 31 27 20.32% 20.05%
Labor's Share 0.61 0.59 0.57 0.57 0.30 -101.76% -95.15%
Developing Country Affiliates: All
Total Employment 1263 1079 1311 1156 1766 28.48% 38.91%
Real Total Compensation (per worker) 11 10 9 9 8 -38.25% -19.93%
Labor's Share 1.09 1.18 0.61 0.60 0.67 -62.86% -76.96%
Table 2: Trends of U.S. Multinationals in Services 1977- 1999
Variable 1977 1982 1989 1994 1999
% Change 77-99
% Change 82-99
Number of Parents 58 76 112 133 242 317.24% 218.42%
Number of Countries in which Parents Have Affiliates 6.74 4.12 4.92 6.97 11.62 72.31% 182.10%
Developed Countries 5.19 3.10 4.27 5.64 7.61 46.66% 145.72%
Developing Countries 1.56 1.02 0.65 1.33 3.94 153.04% 284.93%
Affiliate Share of Jobs 15.43% 9.21% 16.93% 19.13% 25.09% 62.59% 172.39% Developed Country Affiliate Share of Jobs 11.67% 7.09% 15.36% 16.22% 19.41% 66.30% 173.65% Developing Country Affiliate Share of Jobs 3.76% 2.12% 1.57% 2.91% 5.67% 50.86% 167.86%
Affiliate Share of Compensation 13.41% 7.25% 14.99% 17.30% 21.75% 62.20% 200.04% Developed Country Affiliate Share of Compensation 11.20% 6.06% 14.45% 16.38% 19.29% 72.23% 218.23% Developing Country Affiliate Share of Compensation 2.21% 1.19% 0.54% 0.92% 2.46% 11.26% 107.00%
Affiliate Share of Total Investment 13.97% 6.76% 17.65% 21.60% 23.17% 65.93% 242.99% Developed Country Affiliate Share of Investment 11.88% 5.79% 17.06% 20.15% 19.47% 63.86% 236.02% Developing Country Affiliate Share of Investment 2.09% 0.96% 0.59% 1.45% 3.70% 77.35% 284.04%
Parents
Total Employment 532 867 1377 1658 4795 801.93% 453.30%
Real Wages (per worker) 16.79 15.94 17.71 17.03 20.78 23.74% 30.36%
Labor's Share 91.46% 88.00% 85.70% 90.68% 81.24% -11.17% -7.68%
Developed Country Affiliates: All
Total Employment 73 68 255 333 1243 1593.31% 1734.97%
Real Wages (per worker) 13.28 15.05 13.88 14.45 13.86 4.37% -7.91%
Labor's Share 75.93% 45.66% 82.20% 72.93% 75.48% -0.60% 65.30%
Developing Country Affiliates: All
Total Employment 24 20 26 60 363 1436.03% 1696.20%
Real Wages (per worker) 7.43 9.03 5.38 4.69 4.45 -40.11% -50.72%
Labor's Share 88.58% 94.40% 84.72% 90.09% 84.79% -4.28% -10.17%
Figure 1: All Affiliates
0
5
00
00
-100000 -50000 0 50000 100000
Parent Change in Employment
Manufacturing Industry Employment Offsets: 1982-1999
S
Figure 2: High Income Affiliates
0
2
00
00
4
00
00
-100000 -50000 0 50000 100000
Parent Change in Employment
Manufacturing Industry Employment Offsets: 1982-1999
S
0
5
0
0
0
0
-100000 -50000 0 50000 100000
Parent Change in Employment
Manufacturing Industry Employment Offsets: 1982-1999
S
[image:31.612.77.502.252.526.2]Soouurrccee::AAuutthhoorr’’ssccaallccuullaattiioonnssbbaasseeddoonnBBEEAA’’ssoouuttwwaarrddFFDDIIddaattaa
Figure 4: All Affiliates
100 textiles
311 food
312 bev & tobac
316 meat 321 wood
322 paper 325 chem
326 plastic 327 mineral
331 metal
332 fab metal 333 machinery
334 computers
335 electric 336 transport
337 furniture 339 misc
0
-1000000 -800000 -600000 -400000 -200000 0
Parent Change in Employment All Affiliates
Manufacturing Industry Offsets by 3-Digit NAICS Codes: 1982-1999
S
Figure 5: High Income Affiliates
100 textiles
311 food
312 bev & tobac 316 meat 321 wood
322 paper
325 chem
326 plastic
327 mineral 331 metal
332 fab metal 333 machinery
334 computers
335 electric 336 transport
337 furniture 339 misc
0
-1000000 -800000 -600000 -400000 -200000 0
Parent Change in Employment High Income Affiliates
Manufacturing Industry Offsets by 3-Digit NAICS Codes: 1982-1999
S
100 textiles 311 food
312 bev & tobac
316 meat 321 wood
322 paper 325 chem
326 plastic 327 mineral
331 metal
332 fab metal 333 machinery 334 computers
335 electric 336 transport
337 furniture 339 misc
0
5
00
00
-1000000 -800000 -600000 -400000 -200000 0
Parent Change in Employment Medium/Low Income Affiliates
Manufacturing Industry Offsets by 3-Digit NAICS Codes: 1982-1999
S
[image:34.612.80.503.119.367.2]Soouurrccee::AAuutthhoorr’’ssccaallccuullaattiioonnssbbaasseeddoonnBBEEAA’’ssoouuttwwaarrddFFDDIIddaattaa