PSO Algorithm to Select Subsets of Q-Gram Features for
Record Duplicate Detection
M.Padmanaban,
Assistant Professor, Department in Computer Science
D.R.B.C.C. Hindu College Dharmamurthy Nagar, Pattabiram, Chennai-6000072
R.Radha, Ph.D
Associate ProfessorShrimathi Devkunvar Nanalal Bhatt Vaishnav College for
Women, Chromepet, Chennai, TamilNadu, India
ABSTRACT
Though data quality issues arise with ever-zooming quantity of data, it is a welcome sign that of late, significant improvement has been made in data engineering. Consequently, there have been significant investments from private and government organizations in developing methods for removing replicas from the data repositories. This phenomenon has caused a significant interest among researchers in developing efficient and effective duplicate detection strategy using modern and emerging techniques. In this paper, we have proposed accordingly. In the previous work duplicate record detection was done using Q-gram concept and the fuzzy classifier. Here, different set of features from the data is found out using the Q-gram concept that leads to computational complex environment. In order to reduce the computational task, a set of important Q-gram-based feature subsets is selected. With this intention, the overall steps of the proposed technique are carried out using three different steps, such as, 1) feature computation, 2) feature selection, and 3) detection. Initially, the features are computed using Q-gram concept and then, the subset of optimal feature sets is identified using particle swarm algorithm (PSO) which is one of the most effective optimization algorithms. Once we select the optimal features sets, the Naïve Bayes Classifier is utilized to detect the duplication records. There are two processes which characterize the proposed Duplicate Record Detection technique such as the training phase and the testing phase. The experimental results showed that the proposed Duplicate Record Detection technique has higher accuracy than that of the existing method. The accuracy obtained for the proposed Duplicate Record Detection is found to be 89%.
Keywords
Duplicate data, Non- Duplicate data, particle swarm algorithm (PSO), Naïve Bayes Classifier, training, testing.
1.
INTRODUCTION
In recent years, as a lot of businesses, government agencies and research projects gather progressively huge quantity of information, methods that let competent processing, examining and mining of such massive databases have drawn a great deal of enthusiasm from both the academia and the industry. One assignment that has been familiar to be of increasing significance in several application domains is the contesting of records that communicate to the similar entities from numerous databases [1] and the removal of unseen predictive data from large databases. In their data warehouses, it is a novel dominant technology with great prospects to assist companies spotlight on the most significant data., Data mining method is relevant to many domains like banking systems, educational systems, airline reservation systems etc [2] in the real world. In the construction of web portals, de-duplication is essential and it is
another area which incorporates information from different pages probably formed in a dispensed way by millions of people. Cite Seer and Cora are examples of such portals that incorporate citations and paper titles parsed and pulled out from a number of personal and publisher WebPages. Discovering a function that can decide when two records refer to the same thing in spite of faults and contradictions in the information [10] is the major hurdle in this assignment.
The method of recognizing references in statistical records that refer to the similar real world entity [6, 14] is known by the term ‘De-duplication’. Data de-duplication is a method to get rid of unneeded data to get better storage utilization in the operational domain. Copied data is removed in the de-duplication process, leaving only one copy of the data to be accumulated, along with references to the single copy of data [4]. Data de-duplication is an important and decisive element of backup systems. It is utmost essential, as it diminishes storage space requirements, and is critical, because the presentation of the whole backup operation depends on its throughput. With high neighborhood [7], traditional backup workloads contain huge data streams. Data linkage and de-duplication can be applied to develop data quality and integrity, to permit decline of presented data sources for novel studies, and to diminish costs and efforts in data achievement. For instance, related data might contain information relating to the health sector which is required to develop health policies, and which conventionally has been put together with time consuming and luxurious survey methods [3, 16]. For the de-duplication because, there are numerous other techniques that have been suggested which sparkle with competence and precision. The techniques are de-duplication by means of genetic algorithm, semantic methods, and cloud services. By the de-duplication techniques, aforesaid problems which are worked out have been modeled by GA. This research has been made to discover the optimization methods that contain certain concert superiority over these presented methods [9].
lists, as inside taxation offices and departments of social security. By the mutual contribution of every individual the majority optimal solution can be worked out in particle swarm optimization algorithm. To illustrate the difficulty of the whole particle swarm, the particle devoid of quality and volume is provided as every individual, and the easy behavioral pattern is legalized for every particle. This algorithm can be applied to solve the composite optimal problems. PSO algorithm is enhanced to levels having restricted parameter to regulate and superior velocity on gathering [18] matches up to other optimizations.
In this paper, we have proposed an efficient technique for Detecting the Duplicate Record and Non- Duplicate Record using particle swarm algorithm (PSO) and naïve bayes classifier. The documents are processed initially with certain similarity measures namely, dice coefficient, Damerau-Levenshtein distance and Tversky index. The proposed technique is done using three different steps, such as, 1) feature computation, 2) feature selection, and 3) detection. The input datasets are given to feature computation to calculate distance and to get various data values using Q-Gram features and similarity metrics. The data values from distance calculation can be used in Feature selection using PSO algorithm and the fitness function to commutate should be the precise and accurate value for detecting the duplicate record with the help of Naïve Bayes Classifier. Finally, we clarify the data values in Training and testing phase, and then proceed to give a new record to find whether it has duplicate or non-duplicate record.
The remainder of the paper is organized as follows: Section 2 provides an analysis of certain associated works about Duplicate Record Detection. Section 3 provides factors of the suggested Methodology. 4th section provides the results and
arguments about the suggested approach and with the 5th section we wind up our research work.
2.
REVIEW OF RELATED WORK
For Duplicate Record Detection, a handful of researches are presented in literature. In recent, times, owing to the requirement of scalability and competence, Record Duplicate Detection is in allocated manner that has drawn the undivided attention of the researchers considerably. At this point, we analyze the latest works accessible in the literature on Record Duplicate Detection and the dissimilar methods used for it. An improved particle swarm optimization named PSO has been proposed by Xin Chen and Yangmin Li [19] with Controllable Random Exploration Velocity (PSO-CREV) to be performed an extra investigational behavior. The revising principle of PSO-CREV was erected in terms of stochastic approximation, dissimilar from other developments on PSO. So a stochastic velocity independent on cognitive and communal elements of PSO might be inserted to the updated principle, so that particles contain stronger investigation ability than that of conservative PSO. The states and main performances of PSO-CREV were explained. Two characters in terms of “divergence before convergence” and “controllable exploration behavior” are offered, which sponsor the presentation of PSO-CREV. Based on a complex experiment function, an experimental technique by which the correct parameters of PSO-CREV are applied in performance, which assures the high exploration ability, as far as the meeting rate was concerned.
Swagatam Das et al [20] have enhanced the presentation of particle swarm optimization (PSO) by a vector differential operator borrowed from differential progression (DE). Presentation comparisons of the technique were offered against (a) the original DE, (b) the canonical PSO, and (c) three recent,
high-performance PSO-variants. For the following presentation measures, the experimental results demonstrated to be statistically considerably superior on a seven-function test collection: solution quality, time to find the solution, frequency of finding the solution, and scalability. A particle swarm optimization/simulated annealing (PSO/SA) algorithm which is discovered a near-optimal task project with sensible time has been proposed by S.N.Sivanandam and P.Visalakshi [22]. The Hybrid PSO executes in a superior manner than that of the local PSO and the Global PSO. They were at the moment conducting their research for applied PSO to work out another edition of the TAP with dependent assignments and the purpose was to reduce the cost of achieving the task implementation in an active environment.
A competent soft calculating by choosing an optimum subset of characteristics has been proposed by Hafiz Muhammad Imran et al [8]. NSL-KDD dataset was favored over KDD-Cup as there were accepted shortages in KDD-Cup for training and testing of system. Features transformation and optimum subset choice were made by Linear Discriminate Analysis (LDA) algorithm and Genetic Algorithm (GA) correspondingly. Radial Basis Function (RBF) was adjusted as characteristics classifier. Empirical outcomes demonstrated that the competent soft computing was found improved and the robust depiction of an idyllic intrusion finding system on the other hand, has decreased the number of features, low false alarms, and achieved high detection rate and minimum computation cost. Michael Spiz [11] has offered de-duplicating evidence which was applied on dormant semantic indexing (LSI). There was frequently a problem of go beyond among the records while merging two datasets from two dissimilar sources. To discover these duplicate evidences could be disputed as the format of the data was frequently dissimilar among databases. Presented techniques for data de-duplication spot-light principally used data cleaning and fairly accurate string matching methods. Whereas these techniques were efficient for detected duplicates in evidences with fewer words, such as names and addresses, they do not augur well for evidences with larger terms such as company names. The experimental outcomes demonstrated that the LSI de-duplicator achieved superior precision on test and real-world data than the presented methods.
An exact de-duplication for records of one type frequently dependent on the combined decisions prepared for records of other kinds has been proposed by Aron Culotta and Andrew McCallum [12]. While almost all earlier approaches have combined records of dissimilar types separately, these interdependencies openly de-duplicate evidences of various types. They then employed the relational partitioning algorithm to jointly de-duplicate evidences and erected a conditional arbitrary field of de-duplication that captured these relational dependencies. Lastly, they assessed the system on two reference matching datasets, which de-duplicate both papers and sites. They demonstrated that cooperatively de-duplicated paper and venue evidences, attained up to a 30% fault reduction in venue duplication, and up to a 20% fault reduction in paper de-duplication over challenging techniques.
was offered to individuals who created the subsequent generation. Experimental consequences were offered for comparing the presentation of dissimilar kinds of EDAs and GAs. The setbacks selected for purpose were combinatorial optimization problems which were generally used.
The active behavior and the union of the simplified (deterministic) PSO algorithm analyzed for used devices from the discrete-time active system theory has been proposed by Peter Christen and Karl Goiser [13]. For the universal (random) algorithm parameter selection, the study offered qualitative guide-lines. Reproduction tests with two parameter sets, three numbers of particles in the swarm and five benchmark functions were executed. The velocity of union robustness tradeoff was argued. Superior to formerly published results attained for four benchmark functions in terms of the anticipated number of objective function were assessed. A hybrid of particle swarm optimization algorithm and RBF neural set of connections to forecast logistics necessity has been proposed by Wenge Zhao et al [17]. Particle swarm optimization algorithm was used to select these parameters of RBF neural set of connections, as the choice of the centers and the widths of unseen nodes and output weight of the RBF neural network have a gigantic power on it to forecast presentation. The experimental effects demonstrated that the hybrid model of particle swarm optimization algorithm and RBF neural set of connections have achieved superior logistics necessity prediction capability than a hybrid model of genetic algorithm and RBF neural network, RBF neural set of connections.
3.
PROPOSED METHODOLOGY: PSO
ALGORITHM TO SELECT SUBSETS
OF Q-GRAM FEATURES FOR
RECORD DUPLICATE DETECTION
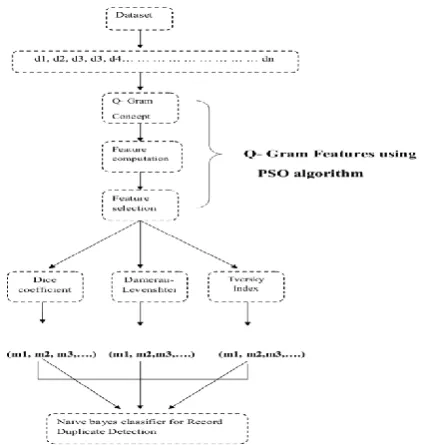
[image:3.595.326.537.72.295.2]Quite a few systems that depend on reliable information to present high quality services, such as digital libraries and e-commerce brokers, may be influenced by the survival of duplicates, quasi-replicas, or near-duplicate entries in their repositories. For the reason that, for eradicating copies from its data repositories there have been important assets from confidential and government organizations in increasing proportions. De-duplicates were prepared by means of three dissimilar resemblance measures Q-gram concept in the previous works as a result. In the earlier work, we have produced feature vector based on resemblance measures and in the next, SVM classifier was applied to locate the duplicate records. We have expanded to develop the presented work by integrating the Q-gram Features in this work, PSO algorithm and the naïve bayes classifier. The general block diagram is demonstrated in figure 1.
Figure 1: Overall block diagram of our proposed approach
To get the model parameters produced from the resemblance functions is the first step in the Duplicate Record Detection based on the PSO algorithm. The resemblance function, which we applied are;
Dice coefficient
Damerau– Levenshtein distance Tversky index
The input which is set to the PSO is the value produced from the above designed resemblance distance measures. The papers are trained with resemblance measures and each of the measure will generate model parameters which are to be experimented for the data redundancy. These parameters are the fundamental processing divisions of the synthetic neural set of connections.
1.Dice coefficient
Dice coefficient is a resemblance measure equal to the Sorensen similarity index, referred to as the Sorensen-Dice coefficient. Dice coefficient is not extremely dissimilar but it has a few dissimilar properties jaccard index as compared to the Jaccard index. Similar to Jaccard the function varies between zero and one. Unlike Jaccard, the consequent difference function
Y X Y X
d1(2/ /)/ is not a suitable distance metric as it does not hold the property of triangle dissimilarity. The resemblance function for the dice’s coefficient can be specified by the following expressions,
Y X
Y X M
2
Where,
M- Signifies the similarity measure
X and Y - documents applied for the comparison
2. Damerau–Levenshtein distance
Damerau–Levenshtein distance is for a while used in some sources as to consider non-adjacent transpositions or not. A set of the replica parameters for the processing of Q-Gram features is presented by the resemblance algorithm of the Damerau-Levenshtein.
3.Tversky Index
To compare an alternative to a prototype is the major operation of the Tversky index. As a simplification of Dice's coefficient and Tanimoto coefficient the Tversky index can be observed. For sets A and B of keywords applied in information recovery, the Tversky index is a number sandwiched between 0 and 1 given by
Y X Y X Y X
UY X V
U M
)
, (
Where,
and
are the parameters of the Tversky index. The resemblance measure also offers a set of model parameters.3.1.
Q- Gram concept
We sort out the data records into splitter blocks in Q gram concept. At this point, we signify the blocks as set of data’s. For instance regarding a person’s address, we fragment the data set as person’s name, house number; phone number and area name. We assign for every block a detach work space. In our Q gram idea, we have executed the following four ways, which are detailed below,
1 gram concept
2 gram concept
3 gram concept
4 gram concept
Regard as a document set S which comprises a set of duplicate and non-duplicate documents. The set of documents can be signified as,
s
s
sn
s
S
S
1
,
2
,...,
,
, and n=1, 2, 3…Currently the set of documents is issued for the processing with the resemblance measures.
3.2.
Q-Gram features
The main goal of this technique is to index the databases that have the similar records, In Q-Gram features, we have put into practice for both features, namely,
3.1) Feature Computation
3.2) Feature Selection using PSO algorithm
3.2.1. Feature Computation
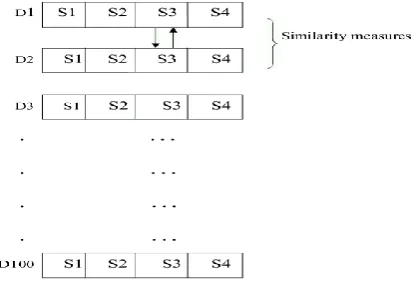
[image:4.595.323.532.78.222.2]In this section, we have split the datasets into four Data Blocks. For example considering a person’s address, we are segmenting the data set as person’s name, house number; phone number and area name. These blocks are taken individually for duplicate detection process of Feature Computation. The similarity measures used in the proposed approach are Dice coefficient (DC), Damerau-Levenshtein (DL) and Tversky Index (TI).These similarity measures are used individually for four separated data record block.
Figure 2: Split Datasets into four Data blocks
The individual Data is measured by Q-Gram concept and Similarity metrics. In our Q gram concept, we have implemented the following four ways,
1 gram concept: By analyzing individually for four separated data record blocks.
2 gram concept: By analyzing the first two blocks and then taking the second and third blocks and then taking the third and fourth blocks.
3 gram concept: By analyzing the first three blocks and then taking the second, third and fourth blocks
4 gram concept: By analyzing the four blocks.
Here also we are using the three similarity measures for analyzing the documents for separating the blocks. In all these steps, user can select appropriate items based on that step.
STEP1:
STEP 2:
STEP 3:
In the first step, by using 1 gram concept and 3 similarity functions, and by calculating distance in datasets we provide 12 data values in these datasets. In the second step, by using 2 gram concept as stated above and 3 similarity functions, and by calculating distance in datasets we provide 15 data values in these datasets. In the third step, by using 3 gram concept as stated above and 3 similarity functions, and by calculating distance in datasets we provide 9 data values in these datasets. In the fourth step, by using 4 gram concept as stated above and 3 similarity functions, and by calculating distance in datasets we provide 3 data values in these datasets. Finally, from the four data blocks, we get 39 data values extracted by calculating the distance using Q- Gram concept and 3 Similarity functions of Dice coefficient (DC), Damerau-Levenshtein (DL) and Tversky Index (TI).
Feature selection and classification process are explained below:
3.3 Feature selection using PSO Algorithm
The data values from distance calculation can be used in Feature selection using PSO algorithm and the fitness function to computation should be precise and accurate value for detecting the duplicate record. We have put into practice for both features, namely
3.3.1 Solution encoding 3.3.2 Fitness function 3.3.1 Solution encoding
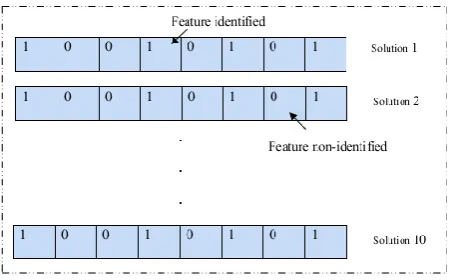
[image:5.595.59.287.454.594.2]This section chooses the data based on the dataset for further processing of our discretionary technique. In the solution encoding process, initially we have assigned all the data randomly. Here, ten pieces of data are taken based on the dataset and these solution attributes contain ‘1’ and ‘0’. For example, in figure 3,’1’ is represents the feature identified and ‘0’ represents the feature non-identified.
Figure 3: Sample solution encoding generation process
3.3.2 Calculate the fitness function (Attractiveness
function):
Firstly, we have developed a modified dataset from the training dataset for this fitness selection purpose. The modified dataset contains only identified attributes (‘1’s). This is created based on the solution encoding. Then this modified dataset is classified using naive bayes classifier. We have given mean and variance to PSO algorithm and selected the optimized fitness. Finally, we obtain some identified attributes (one vector) and corresponding mean and variance. This is the fitness (attractiveness) of solution encoding.
Fitness(Accuracy)= positives false negatives true negatives false positives true of number negatives true of number positives true of number
3.4 Training and Testing phase using naïve
bayes classifier
In Training Classify, whether a given dataset is a Duplicate data or a Non- Duplicate data is estimated based on the measured features. The features include person’s name, house number; phone number and area name. The classifier created from the training set using 80% of the input datasets are taken to calculate distance and get a various data value by using Q-Gram features and similarity metrics. After the Naïve Bayes Classifier is trained, find whether it has duplicate or non-duplicate record. In Testing terms, a naive Bayes classifier takes for granted that the presence or absence of a particular feature is unrelated to the presence or absence of any other feature, given the class variable. A naive Bayes classifier considers each of these features to contribute independently to the probability that this person is a datasets, regardless of the presence or absence of the other features. Then it measures in the following ways, to determine whether the data is duplicate data or Non- duplicate data.
6+
For the classification as Duplicatedatathe posterior
evidence data Duplicate S p data Duplicate P S S S data Duplicate posterior n i i i )) ( ( ) ,... , ( 1 2 1
For the classification as NonDuplicatedatathe posterior is given by evidence data Duplicate Non S p ata Duplicated Non P S S S ata Duplicated Non posterior n i i i )) ( ) ( ) ,... , ( 1 2 1 Where,
ni iPNon DuplicatedatapSiNon Duplicatedata data Duplicate S p data Duplicate P evidence
1 ( ) (
) (
) (
3.5
Classification
Using
Naïve
Bayes
Classifier
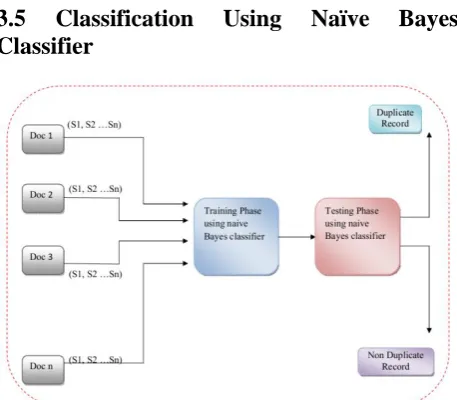
Figure 4:Naïve Bayes Classifier for Duplicate Record Detection
The above is the design of the Naïve Bayes Classifier for the duplication detection purpose. This classifier designed for the proposed Q-Gram Features technique will generate two output values Non- Duplicate data and Duplicate data. The value Non- Duplicate data is specific for the non-duplicate documents and Duplicate data is specific for duplicate documents. In the figure 4 showing the model of the Naïve Bayes Classifier designed for the proposed duplicate detection process. To train the Naïve Bayes Classifier, we need some data features to identify the duplication and duplication records in datasets. The data features will then train the classifier and the classifier will find whether the given records are duplicates or not. The data features which we have chosen for training the Naïve Bayes Classifier are three similarity measures such as Dice coefficient, Damerau-Levenshtein distance, Tversky index. After computing all the data features, we have to give the values to the classifier. For instance, if we are choosing five duplicate records and five non-duplicate records, we need to calculate all the three data features separately for the entire duplicate and Non-duplicate records we had chosen. After calculating all the three data features for every chosen ten duplicate record and ten Non-duplicate records, we have to give the result to the Naïve Bayes Classifier. Using those results we can train the classifier to identify the duplicate record and non-duplicate record from the given dataset. After the Naïve Bayes Classifier is trained, we can give a new record to find whether it has duplicate or
non-duplicate record. Thereafter, the three data features such as Dice coefficient, Damerau–Levenshtein distance, and Tversky index are computed for the new record. The computed values of all the three data features are then given to the Naïve Bayes Classifier.
The Naïve Bayes Classifier then compares the values of all the three data features with the stored values of duplicate or non-duplicate data. Because during training we have stored all the three data features of the five duplicate records and five non-duplicate records, after comparison, the Naïve Bayes Classifier will identify and determine whether the data is duplicate data or Non- duplicate data.
4.
RESULT AND ANALYSIS
Results and discussion of the paper are given in this section. Section 4.1 presents the Dataset description of the paper. Section 4.2 presents Evaluation criteria. Section 4.3 presents Performance Evaluation. Section 4.4 presents the Comparative analysis.
4.1 Dataset description
Dataset1 [Restaurant]: This dataset consists of four files of 500 records (400 originals and 100 duplicates), with a maximum of five duplicates based on one original record (using a Poisson distribution of duplicate records), and with a maximum limit of two changes in a single attribute in the full record.
Dataset2 [Cora]: This dataset consists of four files of 400 records (300 originals and 100 duplicates), with a maximum of five duplicates based on one original record (using a Poisson distribution of duplicate records), and with a maximum limit of two changes in a single attribute in the full record.
4.2 Evaluation criteria
4.2.1 Accuracy
positives false of number negatives
true of number
negatives false of number positives
true of number
negatives true of Number positives
true of Number accuracy
4.2.2 Time
Time is the factor that defines the required time for executing the proposed de-duplication technique. The time for execution is calculated from the starting of the proposed technique to the termination of the proposed technique.
4.3 Performance Evaluation
[image:6.595.56.285.70.270.2]From the following table 1, we can identify sample features of data values from the 80% dataset.
Table 1: Sample Features
Q1S11 Q1S12 Q1S13 Q1S21 Q1S22 Q1S23 Q1S31 Q1S32 Q1S33 Q1S41
0.333333 9 0.333333 0.545455 4 0.6 0.666667 8 0.75 0.666667 0.714286 13 0.714286 0.666667 6 0.75 0.666667 9 0.666667 0.571429 0.266667 13 0.285714 0.444444 3 0.5 0.75 4 0.75 0.666667 0.7 7 0.7 0.833333 2 0.833333 1 0 1 0.75 0.705882 9 0.75 0.833333 4 0.833333 0.75 8 0.75 0.666667 0.142857 25 0.142857 0.285714 30 0.5 0.4 28 0.5 0.4 0.533333 9 0.571429 0.8 4 0.8 0.666667 8 0.666667 0.571429 0.117647 40 0.142857 0.222222 28 0.25 0.222222 30 0.333333 0.25 0.588235 23 0.625 0.4 14 0.5 0.333333 13 0.333333 0.333333 0.571429 12 0.571429 0.8 2 0.8 0.666667 5 0.666667 0.666667 0.434783 35 0.454545 0.333333 24 0.333333 0.222222 14 0.25 0.285714 0.266667 4 0.285714 0.444444 2 0.5 0.75 3 0.75 0.666667
Table 2: Selected Features
Q1S11 Q1S12 Q1S13 Q1S21
0.333333 0.6 0.666667 8 0.714286 0.75 0.571429 11 0.266667 0.5 0.666667 12 0.7 0.833333 0.75 5 0.705882 0.833333 0.666667 11 0.142857 0.5 0.4 20 0.533333 0.8 0.571429 9 0.117647 0.25 0.25 28 0.588235 0.5 0.333333 19 0.571429 0.8 0.666667 11 0.434783 0.333333 0.285714 23 0.266667 0.5 0.666667 2
In this section, we plot the performance analysis of the proposed Duplicate Record Detection technique, when the proposed technique is applied to the different datasets namely Restaurant and Cora dataset. The evaluation factors used are Time and accuracy. In our approach, we have taken four types of resultant values such as, accuracy for restaurant data, Time for restaurant data, accuracy for cora data, Time for cora data. Figure 5 and Figure 7 show the accuracy graph of restaurant and cora dataset. Figure 6 and Figure 8 show the time graph of restaurant and cora dataset.
[image:7.595.312.539.91.214.2]Figure 5: training data size vs accuracy for restaurant data
Figure 6: training data size vs time for restaurant data
[image:7.595.321.530.280.339.2]Figure 7: training data size vs accuracy for cora data
Figure 8: training data size vs time for core data
4.4 Comparative analysis
Table 3: average performance
Restaurant data Cora data
Existing 76.8% 83%
First 79.8% 85%
Second 88% 90%
Third work 89% 92%
In the above Table 3, the comparative analysis of the proposed Duplicate Record Detection technique and the existing techniques is offered. In the accuracy based analysis, it can be found that, the proposed Duplicate Record Detection technique achieved considerable increase in accuracy level at both Restaurant dataset and Cora dataset. The highest value of accuracy percentage achieved by the proposed technique is 89% in Restaurant datasets and 92% in Cora datasets, while the highest percentage of accuracy obtained for the existing de-duplication technique is 88% in Restaurant datasets and 90% in Cora datasets. In the case of time analysis, the Duplicate Record Detection technique is found to incur larger time intervals for the processes of de-duplication. Even though the time required is high for the proposed technique, it is offset by the superior accuracy levels achieved by it in relation to the existing de-duplication technique.
5.
CONCLUSION
In this paper, we have presented an efficient technique to classify the Q-Gram features using PSO algorithm and naïve bayes classifier. The similarity function is taken care of by Dice coefficient, Damerau-Levenshtein distance, and Tversky index for similarity measurement. Finally, naïve bayes classifier is used for analyzing whether data record is duplicated or Non-duplicated. A set of data generated from certain similarity measures is used as the input to the proposed system. There are two processes which characterize the proposed Duplicate Record Detection technique, the training phase and the testing phase. The experimental results showed that the proposed Duplicate Record Detection technique has higher accuracy than the existing method. The accuracy obtained for the proposed Duplicate Record Detection is a whopping 89%.
6.
REFERENCES
[1] Sunitha yeddula and K. Lakshmaiah, “Investigation of techniques for efficient & accurate indexing for scalable record linkage and deduplication " International Journal of Computer & Communication Technology, Vol.3, no.5, p p .24-27 , 2012.
0.6 0.8 1
80 70 60 Data size
Accuracy
Accuracy
0 20
80 70 60
Data size
Time
Time
0 1
80 70 60 Data size
Accuracy
Accuracy
0 10
80 70 60
Data size
Time
[image:7.595.57.283.335.461.2] [image:7.595.57.284.492.612.2] [image:7.595.58.282.638.762.2][2] Lalitha. L, Maheswari.B and Karthik.S, "A Detailed Survey on Various Record Deduplication Methods" International Journal of Advanced Research in Computer Engineering & Technology, Vol.1, no.8, p p. 456-489, October 2012.
[3] Qinghai Bai, "Analysis of Particle Swarm Optimization Algorithm” Computer and Information Science, vol.3, no, 1, p p.602-612 feb 2010.
[4] Vandana Dixit Kaushik, Amit Bendale, Aditya Nigam and Phalguni Gupta, "An Efficient Algorithm for De-duplication of Demographic Data " Computer Science and Technology, Vol. 7389, no.5, p p. 602-609, 2012.
[5] Teresa Miquélez, Endika Bengoetxea and Pedro Larrañaga, "Evolutionary computation based on bayesian classifiers" International journal application of mathematics and computer science, vol. 14, no. 3, p p. 335-349, 2004.
[6] Aravind Arasu, Christopher R and DanSuciu, "Large Scale De-duplication with Constraints using De-dupalog" Asian Journal of Management and Humanity Sciences, Vol. 1, no. 4, pp. 558-576, 2007.
[7] Bhagwat, Kave Eshghi, Darrell D. E. Long and Mark Lillibridge, "Extreme Binning: Scalable, Parallel Deduplication for Chunk-based File Backup" International Symposium on Modelling, Analysis and Simulation of Computer and Telecom-munication Systems, vol. 9, no. 6, p p. 947-965, 2010.
[8] Hafiz Muhammad Imran, Azween Bin Abdullah, Muhammad Hussain, Sellappan Palaniappan and Iftikhar, "Intrusions Detection based on Optimum Features Subset and Efficient Dataset Selection" International Journal of Engineering and Innovative Technology (IJEIT) Vol.2, no. 6, p p.265-270, December 2012.
[9] Deepa Karunakaran and Rangarajan Rangaswamy , "Optimization Techniques To Record Deduplication", Journal of Computer Science,vol. 5, no. 2, p p. 14-21, 2009.
[10] Sunita Sarawagi and Anuradha Bhamidipaty, "Interactive Deduplication using Active Learning", Journal of Computer Science, vol. 8, no. 9, p p. 1487-1495, 2012.
[11] Michael Spiz, "Using Latent Semantic Indexing for Data Deduplication", proceeding of: 6th Industrial Conference on Data Mining, vol. 12, no.6, p p.347-359,2006.
[12] Aron Culotta and Andrew McCallum, "Joint Deduplication of Multiple Record Types in Relational Data", Journal of Computer Science, vol. 2, no. 1, p p. 324-329, 2007.
[13] Peter Christen and Karl Goiser, "Quality and Complexity Measures for Data Linkage and Deduplication", Quality Measures in Data Mining Studies in Computational Intelligence, Vol. 43, no. 11, pp 127-151,2007.
[14] Murat Sariyar and Andreas Borg, "The Record Linkage Package: Detecting Errors in Data", Journal Applications, Vol. 2, no.2, December 2010.
[15] Ioan Cristian Trelea, "The particle swarm optimization algorithm: convergence analysis and parameter selection", Information Processing Letters, vol. 85, no.8, p p.317– 325,2004.
[16] Wasif Afzal, Richard Torkar and Robert Feldt, "A systematic review of search-based testing for non-functional system properties", Information and Software Technology, vol.5, no.3, p p.3-20,2009.
[17] Wenge Zhao, "Logistics Requirement Prediction by a Hybrid Model of Particle Swarm Optimization Algorithm and RBF Neural Network", Journal of Computational Information Systems, vol. 9,no. 1, p p. 41-46, 2013.
[18] Alejandro cervantes and Infes galvan and Pedro isasi, "Michigan Particle Swarm Optimization for Prototype Reduction in Classification Problems", New Generation Computing, Vol. 27, no. 3, p p .239-241, 2009.
[19] Xin Chen and Yangmin Li, "On Convergence and Parameter Selection of an Improved Particle Swarm Optimization ", International Journal of Control, Automation, and Systems, vol. 6, no. 4, p p. 559-570, August 2008.
[20] Swagatam Das, Amit Konar and Uday K. Chakraborty, "Improving Particle Swarm Optimization with Differentially Perturbed Velocity ", International Journal of Control, Automation, and Systems, vol. 6, no. 4, p p. 559-570, August 2008.
[21] Zhang Haiyan, Li Xin and Lu Rongliang, "An Improved Particle Swarm Optimization Algorithm for Seismic Wavelet Estimation ", Journal of Applied Sciences, Engineering and Technology, vol. 4, no.6, p p. 591-594, 2012.