http://dx.doi.org/10.4236/ojss.2015.510023
How to cite this paper: Lascano, R.J., Krieg, D.R., Baker, J.T., Goebel, T.S. and Gitz III, D.C. (2015) Planting Cotton in a Crop Residue in a Semiarid Climate: Water Balance and Lint Yield. Open Journal of Soil Science, 5, 236-249.
http://dx.doi.org/10.4236/ojss.2015.510023
Planting Cotton in a Crop Residue in a
Semiarid Climate: Water Balance and Lint
Yield
Robert J. Lascano
1, Dan R. Krieg
2, Jeffrey T. Baker
3, Timothy S. Goebel
1, Dennis C. Gitz III
1 1Wind Erosion and Water Conservation, USDA-ARS*, Lubbock, TX, USA2Department of Plant and Soil Science, Texas Tech University, Lubbock, TX, USA 3Wind Erosion and Water Conservation, USDA-ARS, Big Spring, TX, USA
Email: Robert.Lascano@ars.usda.gov
Received 24 June 2015; accepted 23 October 2015; published 26 October 2015
Copyright © 2015 by authors and Scientific Research Publishing Inc.
This work is licensed under the Creative Commons Attribution International License (CC BY).
http://creativecommons.org/licenses/by/4.0/
Abstract
237
nated wheat residue did not benefit the water balance of the cotton crop, and was associated with decreased cotton lint yields. The results were consistent with our working hypothesis, and dis-proved the idea that planting cotton into wheat stubble cover increases water use efficiency.
Keywords
Soil Water, Evapotranspiration, Cropping Systems, Semi-Arid, Wheat Residue
1. Introduction
In 2013 and 2014, about 1.2 million ha were planted with upland cotton on the Texas South Plains [1]. The an-nual mean precipitation in this region is 467 ± 159 mm and about 50% of this rainfall occurs during the 4-month (May to August) growing season. About half of the planted area is irrigated with a water supply ranging from 2.5 to 7.5 mm∙d−1 and the potential evaporative demand is on average 9.8 ± 0.8 mm∙d−1 during the four-month growing season [2]. The source of the irrigation water is the Ogallala aquifer, where withdrawals exceed natural recharge, resulting in a declining water table [3]. Much of the water applied to the cotton is lost to bare soil wa-ter evaporation (Esoil) in conventional tillage systems [4] [5]. In this semiarid region, where cotton is planted in a
wide row spacing (1-m) the crop seldom reaches a leaf area index of 3 m2∙m−2 that is necessary to achieve ca-nopy closure [6] [7]. Furthermore this exposed and bare soil is conducive to increase the amount of Esoil [8].
Given the decline of irrigation water from the Ogallala aquifer [3] [9] with a decreasing pumping capacity, particularly during periods of low rainfall which are frequent in this region, led to develop agronomic practices to maximize cotton’s water use efficiency (WUE), i.e., production of lint yield per unit of water taken up by the plant [10]. An example of this conservation practice is to plant cotton into a winter wheat (Triticum aestivum L.) crop that is chemically terminated in the spring before the cotton crop is planted [11]. Residues may protect cot-ton seedlings by providing shelter to wind damage and sand abrasion [12]. Also, the residue may reduce Esoil;
however, in some cases it may use more water than it conserves [5] [8] via wicking [13]. This is the process whereby the wheat residues may contribute to additional water loss via capillary action, i.e., wicking effect [14]. In this situation, the wheat residue may increase the ability to transport water from the seedbed to the atmos-phere via evaporation and thus resulting in a reduction of soil water and negatively affecting cotton emergence when planted in the wheat residue.
In the cotton cropping systems of the Texas High Plains, the effect of crop residues on water conservation and lint yield, are a function of the water supply, from irrigation and rainfall, soil type, and tillage practices [15] [16]. Planting cotton into a wheat residue on a sandy loam soil only increased cotton lint yield when the crop was ir-rigated at the grass reference evapotranspiration demand (ETo). However, this practice is not suited to the
avail-ability of irrigation water from the Ogallala aquifer. In field trialsand over a five-year period, in a loamy fine sandy soil the residue did not impact lint yield under irrigated conditions, but significantly and adversely af-fected dryland lint yields. In a clay loam soil, the lint yield of cotton planted in a wheat residue increased on av-erage by 13% under irrigation and reduced dryland cotton lint yield by 8% [17] [18]. From these results, it can be concluded that the effects of wheat residues on cotton lint yield depend primarily on the water supply. The texture effect is related to the amount of water that can be stored in the soil, particularly from the time the wheat is terminated to when the cotton is planted. For example, in the surface 0.20 m of the soil profile, a clay soil can store about twice as much water as a sandy soil and for dryland conditions the additional stored water would be available during cotton planting and favor seed germination and emergence of the cotton plant.
238
irrigated winter wheat varied between 1 and 2 mm∙d−1 with a maximum of 13 mm∙d−1 during the late spring [20]. Therefore, it was concluded that for the Texas High Plains under dryland conditions the establishment of a wheat residue is perhaps not practical and will require irrigation to be of value [19].
The short- and long-term benefits of residues on soil physical and chemical properties, and crop production has been widely investigated, e.g., [15] [21]-[23]. Residues increase infiltration of water, from either rain or ir-rigation, by increasing the surface roughness and flow path tortuosity and thus increasing the time for more wa-ter to infiltrate by surface ponding [19] [24] [25]. Residues, also modify the kinetic energy from raindrops im-pacting the soil surface [26] [27], which leads to less erosion [26] and increasing rain interception [28] by as much as 10% of the annual rainfall [29]. A long-term benefit of residues is to increase water storage and thus providing more water for crop production [30] [31].
The impact of residues on Esoil is well documented [4] [5] [8] [32]-[34]. Residues can reduce the rate of Esoil in
the so-called first stage [25] [30] [34]-[37]. The type of residue also affects the Esoil rate and wheat, for example,
is more effective than cotton [35]. The presence of a residue reduces Esoil; however, the total evaporation
equili-brates between residue covered soil and bare soil after a long period of time between water inputs [35]. For ex-ample, the rate of Esoil from a bare soil and a residue-covered soil will be different; however, the total amount of
water lost from the bare and residue-covered soil will be very similar after a long period of time [5] [8]. The rate of Esoil is defined by exchanges of energy and water between the soil surface and the surrounding environment
[32] and determined by the combined water and energy balance of the soil surface. The aerodynamic resistance to vapor and latent heat flux from the soil surface to the atmosphere is increased by the presence of a residue, which decreases the rate of Esoil[5] [8][38] [39]. Another effect of a residue is to reduce the amount of
irra-diance that reaches the surface, decreasing soil temperature and Esoil.
The presence of a surface residue modifies the Esoil and affects the WUE [8]. The daily Esoil and crop
transpi-ration (T) for a 100-day growing season of cotton planted into terminated wheat and conventionally tilled soil where compared by Lascano et al. [8]. In this experiment daily Esoil was measured for a seven-day period using
microlysimeters [32] and calculated using the mechanistic ENWATBAL model [4] [40]. Both cotton cropping systems, residue and conventional, had the same seasonal ET. However, the conventional tilled cotton evapo-rated more Esoil and had a lower amount of plant T than the cotton planted into the terminated wheat. The wheat
residue increased the seasonal crop T, i.e., more water used for plant growth, and reduced the seasonal Esoil,
re-sulting in an increase of lint yield of 35% compared to the cotton planted in the conventional tillage with the same amount of water. The WUE of the cotton planted in the wheat residue was 2.6 g lint per kg of water used in ET, which was 27% more lint than the conventionally planted cotton [8]. In these field experiments the amount of water used to grow and establish the wheat residue were not measured and thus the calculated value of WUE is biased towards the cotton lint yield from the residue.
Our hypothesis is that despite the many benefits that residue offer, in a semiarid environment establishing the residue would use more water than conserved when used along a cotton crop. In our hypothesis the assumption was made that the cover crop that provides the residue and cotton were supplemented as needed with irrigation and each tillage treatment received the same amount of water annually. Further, it was postulated that the use of chemically terminated winter wheat residue would not significantly increase lint yields because less water would available for cotton growth and lint production. The main objective of this study was to examine and compare the water balance of two cotton cropping systems for a two-year period for conventionally tilled cotton, and for cotton planted into terminated wheat. Specifically, our objectives were to 1) compare the water used by wheat vs. soil water lost to evaporation from the conventionally tilled bare soil; 2) determine if wicking occurred after the wheat was terminated and before the cotton was planted; and 3) determine the effects that bare soils and residue- covered soils have on the water available for cotton growth and lint yield.
2. Materials and Methods
239
(Sorghum bicolor L.) in the semiarid climate of the Texas High Plains. Results presented here are partially based on work by Vorheis [41] and Ralston [42].
2.1. Irrigation
Irrigation-water at each location was applied using sprinkler irrigation methods. At Brownfield, TX a center pi-vot, 400 m long, irrigation system provided 50, 75, and 100% of the weekly crop water use with Low Energy Precision Application (LEPA) spray nozzles [43]. The linear (300 m in length) irrigation system used at New Deal provided 40% or 80% of weekly crop water use with LEPA spray nozzles. Half the field at New Deal was irrigated at 40% ETo and the other half irrigated at 80% ETo.
At each location, the amount of water applied was based on calculated daily grass reference ETo using as
weather input net irradiance, air temperature and humidity, and wind speed measured at each site, and using the Penman-Monteith method as given by Allen et al. [44]. The daily water use was determined as ETo multiplied
by a locally developed crop coefficient (Kc) that depended on the ground cover [45]. The weekly crop water use
was calculated using the appropriate ETo and Kc for that site. Date and amount of water applications for
Brown-field are given inTable 1 and for New Deal in Table 2. Rainfall was measured at each site using a tipping bucket. Irrigation treatments at both sites did not begin until cotton emergence. The irrigation levels were dif-ferent between the two locations because the two studies were independent of each other, with difdif-ferent soil textures and environmental conditions.
2.2. Experimental Design
The experimental design at both locations was a randomized block, split plot setup. The experimental field at each site was about 46 ha. The major plots were tillage effects and the irrigation treatments were the split plots. All treatments were replicated four times and the plot size of each replicate was 156 × 183 m. The irrigation treatments (i.e., 50% and 100% ETo at Brownfield, and 40% and 80% ETo at New Deal) were started after the
cotton emerged (late May through early June). Therefore, all plots for each location received identical irrigation amounts between cotton harvest from the previous season until cotton emergence the next season. One half of each irrigation treatment at each location was planted conventionally with cotton (left fallow in winter) and the other half was planted with cotton in terminated winter wheat. Locations were previously used for cotton pro-duction prior to this study with half of each field in terminated wheat residue and half of each field under con-ventional tillage. Treatments were replicated, n = 4, and mean separation was done using the PROC MIXED procedure and with t-type confidence interval of 0.05 using SAS on an Apple computer (WMware and SAS version 9.2).
2.3. Cultural Practices
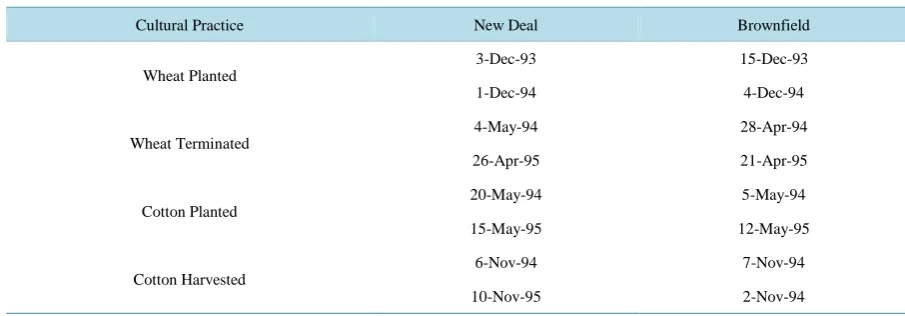
Winter wheat at both locations was drilled at a rate of 30 kg∙ha−1 at 0.2-m row spacing into listed soil resulting in two rows of wheat in each furrow on 0.75-m centers. The tops of the beds were left bare in preparation for the planting of cotton. The wheat (TAM-200, Texas A&M University Foundation Seed, College Station, TX)# grew until it was tall, about 0.3 m, enough to provide wind protection, which was usually in mid- to late-April and was then terminated with the herbicide glysophate (Roundup, Monsanto Company, St. Louis, MO) at a rate of 2 L∙ha−1. Cotton (HS-26, Paymaster Technology Corp., Scott, MS) was planted into the terminated wheat and on the fallow plots during early to mid-May. A complete fertilizer blend consisting of 50-50-0-10 was applied to the entire area after each cotton harvest and prior to planting the wheat in the fall each year. Supplemental N was provided through the irrigation water at a rate of 0.2 kg N mm−1∙ha−1 with an irrigation volume of 25 mm for the 100% and 80% irrigation treatments through the third week of flowering. Important dates for different cultural operations at both locations are given inTable 3.
2.4. Measurements
Soil water contents were measured gravimetrically at various times throughout the year, usually one to two
240
Table 1. Irrigation applied and rain for two irrigation treatments and two growing seasons in Brownfield, TX.
Date Irrigation Treatment [mm] Rain [mm] Date Irrigation Treatment [mm] Rain [mm]
50% ETo 100% ETo 50% ETo 100% ETo
28-Apr-94 7.4 04-Jan-95 4.6
29-Apr-94 25.4 25.4 20-Jan-95 20.1
29-Apr-94 8.4 27-Jan-95 3.3
30-Apr-94 18.0 18-Feb-95 13.0
3-May-94 1.0 01-Mar-95 1.0
10-May-94 15.5 10-Mar-95 5.6
11-May-94 29.2 07-Apr-95 8.1
12-May-94 54.1 09-Apr-95 25.4 25.4
13-May-94 32.3 15-Apr-95 25.4 25.4
18-May-94 6.4 6.4 02-May-95 1.3
25-May-94 3.3 05-May-95 10.9
26-May-94 1.5 06-May-95 4.1
27-May-94 5.6 11-May-95 11.4
31-May-94 25.4 25.4 15-May-95 1.5
3-Jun-94 13.2 13.2 24-May-95 1.1
10-Jun-94 25.4 25.4 30-May-95 41.0
12-Jun-94 1.5 04-Jun-95 6.4
21-Jun-94 25.4 25.4 10-Jun-95 13.5
12-Jul-94 10.8 21.6 23-Jun-95 18.0
13-Jul-94 1.8 24-Jun-95 7.0
14-Jul-94 3.8 27-Jun-95 21.0
22-Jul-94 25.4 50.8 05-Jul-95 14.0 28.0
28-Jul-94 14.5 15-Jul-95 1.3
30-Jul-94 14.5 18-Jul-95 10.0 20.3
3-Aug-94 3.0 20-Jul-95 5.3
8-Aug-94 25.4 50.8 21-Jul-95 2.8
27-Aug-94 12.5 25.4 25-Jul-95 10.0 20.3
1-Sep-94 11.7 28-Jul-95 6.3 12.7
9-Sep-94 2.0 31-Jul-95 1.3
15-Sep-94 3.8 01-Aug-95 5.1
16-Sep-94 7.9 14-Aug-95 58.0
7-Oct-94 10.7 21-Aug-95 6.0
8-Oct-94 5.3 09-Sep-95 19.3
15-Oct-94 3.6 10-Sep-95 13.7
18-Oct-94 2.3 13-Sep-95 3.0
5-Nov-94 5.8 16-Sep-95 134.0
24-Nov-94 4.3 22-Sep-95 11.0
28-Sep-95 5.0
241
Table 2. Irrigation applied and rain for two irrigation treatments and two growing seasons, in New Deal, TX.
Date Irrigation Treatment [mm] Rain [mm] Date Irrigation Treatment [mm] Rain [mm]
40% ETo 80% ETo 40% ETo 80% ETo
26-May-94 14.0 22-Jan-95 6.9
13-Jun-94 25.4 25.4 29-Jan-95 3.0
16-Jun-94 3.0 10-Feb-95 38.1 38.1
29-Jun-94 19.0 18-Feb-95 3.3
13-Jul-94 51.0 5-Mar-95 1.5
14-Jul-94 10.0 12-Mar-95 6.9
19-Jul-94 25.4 50.8 18-Mar-95 1.3
21-Jul-94 5.0 25-Mar-95 1.3
2-Aug-94 1.0 1-Apr-95 2.3
11-Aug-94 30.8 63.5 8-Apr-95 18.3
14-Aug-94 3.6 15-Apr-95 50.8 50.8
8-Sep-94 7.4 16-Apr-95 8.1
14-Sep-94 11.4 18-Apr-95 1.0
15-Sep-94 8.4 5-May-95 18.5
7-Oct-94 4.3 6-May-95 5.1
14-Oct-94 1.5 15-May-95 14.5
15-Oct-94 4.6 23-May-95 2.3
18-Oct-94 1.3 24-May-95 1.8
19-Oct-94 3.3 25-May-95 2.0
20-Oct-94 1.8 26-May-95 5.1
4-Nov-94 12.7 29-May-95 16.3
19-Nov-94 2.0 30-May-95 7.9
6-Dec-94 1.0 2-Jun-95 1.0
27-Dec-94 1.3 3-Jun-95 6.4
30-Dec-94 1.0 10-Jun-95 13.5
2-Jul-95 14.5
14-Jul-95 16.5 33.0
18-Jul-95 3.3
24-Jul-95 10.1 20.3
26-Jul-95 10.1 20.3
31-Jul-95 4.8
1-Aug-95 2.7
2-Aug-95 1.3
19-Aug-95 25.4 50.8
9-Sep-95 2.8
10-Sep-95 13.2
12-Sep-95 13.5
15-Sep-95 90.0
19-Sep-95 55.0
29-Sep-95 100.0
242
Table 3. Cultural operations at two sites and growing seasons.
Cultural Practice New Deal Brownfield
Wheat Planted
3-Dec-93 15-Dec-93
1-Dec-94 4-Dec-94
Wheat Terminated
4-May-94 28-Apr-94
26-Apr-95 21-Apr-95
Cotton Planted
20-May-94 5-May-94
15-May-95 12-May-95
Cotton Harvested
6-Nov-94 7-Nov-94
10-Nov-95 2-Nov-94
times per month [46], and these were converted to volumetric water content using appropriate bulk density val-ues provided by Baumhardt et al. [47]. On each sampling date, 6 - 10 soil samples per plot were taken in 0.30-m increments to a 1.2-m depth. Water used through Esoil and/or T during different crop stages was based on the
water balance, inputs and outputs and included precipitation, irrigation and net change in soil water content. When no crops were on the ground, all the water loss was assumed to be through Esoil, and if a crop did exist, the
water loss was assumed to be a combination of Esoil and T [48]. Specifically, the following quantities were
de-termined: 1) water required to grow an adequate amount of residue; 2) water used by the wheat after being chemically terminated; 3) water lost through Esoil; 4) water used by each cotton crop; and 5) the effect of each
cotton cropping system on cotton lint yields. Runoff was assumed to be negligible because of slopes < 0.1% and soil water content below the 1.2-m depth was not measured because of the existence of a caliche layer around the 1.4-m depth. Cotton lint yield was estimated by hand harvesting 10 m2 of plot area in each replication of each treatment. Cotton yield components were determined and their relative contribution to total lint yield eva-luated.
2.5. Additional Experiment
An additional experiment was done in New Deal, TX in 1996 to measure evaporative losses of cotton planted in a bare soil and wheat terminated residue, without any irrigation. To measure the loss of water by evaporation, gravimetric soil samples were taken in the top 0.60 m of the soil profile in about five-day increments starting on the day the wheat was terminated by applying glysophate, 15 May 1996, and ending on the 3 June 1996, when more than 75% of the cotton planted had emerged. Gravimetric soil water content was converted to a volume basis using the measured soil bulk density and these measurements were replicated six times. The bare soil and wheat residue treatment was replicated three times and each plot was the same size as previously used, i.e., 156 × 183 m.
3. Results and Discussion
3.1. Wheat Water Use
The first research objective was to measure and compare the water used by the wheat to the soil water lost to evaporation from conventionally tilled bare soil. The amount of water used to establish a wheat residue and the amount of water lost to bare Esoil for Brownfield and New Deal are given inTable 4. During the wheat growth
stage, all plots received the same irrigation amount. These results showed that in 1995, the wheat used more (P ≤ 0.05) water than the bare soil lost Esoil in both treatments and locations. At Brownfield, the wheat used 40%
more water (P ≤ 0.05) than the bare soil lost to water evaporation in the loamy fine sand textured soil. At New Deal, the wheat used 36% more water (P ≤ 0.05) than the bare soil lost to evaporation in the clay loam soil. During the spring of 1995, establishing a wheat residue required more water compared to leaving the soil bare at both locations and on both soil textures.
243
Table 4. Water balance (inputs and outputs) at two locations for the 1995-growing season.
Year
Brownfield New Deal
Inputs [mm]
Outputs# [mm]
Inputs [mm]
Outputs# [mm]
Residue Treatment Residue Treatment
Irrigation* Rain Bare Soil Residue Irrigation* Rain Bare Soil Residue
1995 53.0 62.0 94.5 (17) 132.5 (16) 89.0 55.0 105 (12) 142.5 (13)
*
Irrigation treatments were not active during the wheat growth; #Calculated values of outputs are the mean of all measurements and the standard devi-ations are given in parenthesis.
Brownfield and New Deal, TX are given inTable 5. Even though all the plots within each location received the same amount of irrigation during the wheat growth period, our measurements demonstrated the variability in soil water content at each location. The coefficient of variation of the measured mean soil water content was > 25% (data not shown). This variability could be explained by the irrigation treatments applied during the pre-vious season because overall soil water content could increase over the growing season in the highest irrigation treatments compared to the lower ones.
At both locations, the bare soil treatment resulted in an increase of the soil water content in the top 0.6 m by > 30% (P ≤ 0.05) between the time when the wheat was terminated and planted (Table 5). However, the wheat re-sidue treatments showed no gain in stored water at wheat termination compared to the amount of soil water at wheat planting. In the loamy fine sand, the wheat residue caused a reduction (P ≤ 0.05) of 14% in soil water content. At Brownfield, the bare soil gained 71% (P ≤ 0.05) soil water and at New Deal the gain was 37% (P≤ 0.05) from wheat planting to wheat termination. The statistical difference (P ≤ 0.05) between the amount of soil water at wheat termination at Brownfield was 36 mm between the bare soil and wheat residue treatments. The statistical difference (P ≤ 0.05) between soil water at wheat termination at New Deal was 40 mm of water in the top 0.6 m of soil. Therefore, there was no gain, 36 vs. 40 mm, in stored water by the wheat residue plots over the spring of 1995 at either location, while the bare soil was able to increase the water content in the top 0.6 m of soil by more than 30% (P ≤ 0.05) over the spring months.
3.2. Wicking
The second objective was to determine if upward movement of water through the wheat residue, i.e., wicking, occurred after the wheat was terminated and before the cotton was planted. The amount of water lost to evapora-tion from both the bare soil and terminated wheat plots between wheat terminaevapora-tion and cotton emergence for 1995 at Brownfield and New Deal are shown as a bar graph inFigure 1. These results suggested, and as ex-pected the evaporation of water was greater in the finer textured soil when compared to the coarser textured soil. In the fine loamy sand soil, the bare soil evaporated 44% more (P ≤ 0.05) soil water than the wheat residue. However, in the clay loam soil the wheat residue evaporated 66% more (P ≤ 0.05) soil water than the bare soil. This result suggested that there might be a soil textural effect on the amount of water that can evaporate from a bare soil and from a terminated wheat residue [19].
It was speculated that differences in water evaporation from the bare and from the wheat-covered soil were due to the different textures and the process of wicking. The soil at New Deal is a clay loam, i.e., more condu-cive for upward capillary flow of water; while Brownfield has a loamy fine sand, whose large pores would de-crease capillary flow [13]. Under wicking, wheat residue could lose more water to evaporation than bare soil because many roots act as capillaries and the surface area provided by the leaves of the terminated wheat con-tribute to the evaporation. A possible solution to this problem could be to mechanically sever the roots of the wheat plant after termination at a 0.2 - 0.3 m depth and in this way disrupt the capillary movement of water from the soil to the atmosphere.
244
Table 5. Amount of water in the top 0.6 m of the soil for wheat residue at planting and termination at two locations.
Year
Brownfield Residue Treatment [mm] New Deal Residue Treatment [mm]
Bare Soil Residue Bare Soil Residue
Planting Termination Planting Termination Planting Termination Planting Termination
[image:9.595.185.442.437.591.2]1995 47.0 80.5 51.5 44.5 104.0 142.5 102.0 103.0
Figure 1. Cumulative measured evapotranspiration (ET, mm) as a func-
tion of days after wheat termination at Brownfield (BF) and New Deal (ND) from the wheat and bare soil residue treatment for the 1995- growing season.
Figure 2. Cumulative measured evaporation in mm from a bare soiland
wheat residue treatment for the time period between wheat termination (15 May 1996) to cotton emergence (3 June 1996) in New Deal TX.
the results from this study were not conclusive to determine the effects of wicking in a clay loam soil and the measurement of Esoil.
Part of the difficulty in determining differences of Esoil under field conditions is that the amount of water that
245
amount of water could determine the difference of having adequate water in the seedbed to germinate and to emerge the cotton crop planted in the residue [13].
The water used by the wheat and lost by Esoil affects the amount of water available for cotton growth. The
amount of water content in the 1.2 m soil profile at cotton planting for both sites and growing seasons season is shown in Table 6. The bare soil treatments had more water at cotton planting than the wheat residue treatments at both locations except for the 40% ETo plots at New Deal and the 50% ETo plots at Brownfield for 1994. All
the treatments in New Deal excluding the 40% ETo irrigation treatment in 1994 showed a significant increase (P
≤ 0.05) in soil water for the bare soil treatments compared to the wheat residue treatments, while Brownfield did not have a significant increase (P ≤ 0.05) in soil water for the bare soil treatments at cotton planting. This stored water is important, particularly at the time when the cotton is planted as it necessary for seed germination and emergence impacting the vitality and vigor of the cotton seedling, which can later affect lint yields [49] [50].
Even though the wheat used more water in Brownfield in 1995 than the bare soil (Table 5), it appears that the wheat only extracted water from the top 0.6 m of soil because the water depth in the top 1.2 m of soil at cotton planting (Table 6) showed that the soil profile for each residue treatment contained about the same amount of water in the top 1.2 m of soil. However, at New Deal, capillary movement of water by a hydraulic gradient and by wheat roots may have caused a reduction in the amount of water in the top 1.2 m of soil for the wheat residue plots, allowing the bare soil to store more water at the time that cotton was planted (Table 6).
3.3. Cotton Water Use
The last and third objective of this study was to determine the effects bare and residue-covered soils have on the water available for cotton growth and development. Water inputs and water used by the cotton in both seasons and at both sites are given in Table 7. There were no significant differences (P ≤ 0.05) in the amount of water
used by the cotton for any of the residue treatments at Brownfield (Table 7). However, the 80% ETo bare soil
treatments used at least 10% more (P ≤ 0.05) water to grow the cotton than the residue treatments for both years at New Deal (Table 7) and as previously discussed, could be accounted for sampling error (Table 5).
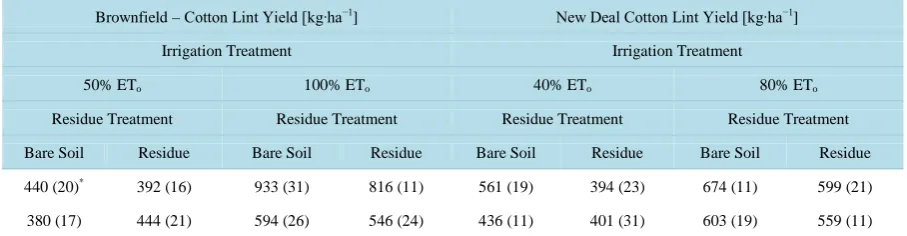
Cotton lint yields were used to evaluate the effects residues have on cotton growth and development. Cotton lint yields for both locations and growing seasons are given in Table 8. These cotton lint yield values were sim-ilar to cotton yields reported for surrounding areas [51] [52]. In 1994, both locations had significantly higher (P ≤ 0.05) lint yields (at least 8% higher) from the conventionally tilled treatments than the wheat residue plots for all irrigation treatments (Table 8). The only treatment with a loss in lint yield from the conventionally tilled treatments was in the in the low irrigation treatment at Brownfield in 1995 with a 14% decrease (P ≤ 0.05) in lint yields. The greatest gain in lint yield from the conventionally tilled treatments over the terminated wheat treat-ments occurred in the 40% irrigation treatment at New Deal in 1994 with a 42% gain (P ≤ 0.05). Therefore, our results suggested that the presence of residues had a significant (P ≤ 0.05) impact with a loss of lint yield for both years of the study. This result confirms our hypothesis that in a semiarid region the use of a small grain cover crop under irrigated conditions uses more water than it conserves compared to conventional tilled cotton, reducing cotton lint yields.
As expected and in climates where water is a limiting factor in crop production, the irrigation treatments at each location that received the greatest amount of water resulted in higher lint yields compared to the lower irri-gation amounts (Table 8). For example, Bordovsky et al. [45] showed that higher irrigation amounts also gave higher yields, but also reported that at a 50% ETo irrigation level, conventionally tilled and wheat residue cotton
systems yielded about the same (P ≤ 0.05), while at a 100% ETo irrigation level, the conventionally tilled cotton
cropping system yielded 17% less (P ≤ 0.05) as compared to the wheat residue treatment at Lamesa, TX, which has a sandy loam soil.
Table 6.Amount of water in the top 1.2 m of the soil when cotton was planted at two locations and two years.
Year
Brownfield Residue Treatment [mm] New Deal Residue Treatment [mm]
Bare Soil Residue Bare Soil Residue
1994 207.0 201.5 296.0 299.0
246
Table 7. Water balance (inputs and outputs), for two irrigation treatments at two locations and two years.
Year
Brownfield
Water Inputs [mm]
Rain [mm]
Water Outputs [mm]
Irrigation Treatment Irrigation Treatment
50% ETo 100% ETo
50% ETo 100% ETo
Residue Treatment Residue Treatment
Bare Soil Residue Bare Soil Residue
1994 125 200 93 276 295 395 403
1995 41 81 375 315 314 406 403
Year
New Deal
Water Inputs [mm]
Rain [mm]
Water Outputs [mm]
Irrigation Treatment Irrigation Treatment
40% ETo 80% ETo
40% ETo 80% ETo
Residue Treatment Residue Treatment
Bare Soil Residue Bare Soil Residue
1994 83 140 172 283 304 442 387
1995 93 130 382 541 539 620 558
Table 8. Average cotton lint yields for two locations, and two irrigation and residue treatments, for two years.
Brownfield – Cotton Lint Yield [kg∙ha−1] New Deal Cotton Lint Yield [kg∙ha−1]
Irrigation Treatment Irrigation Treatment
50% ETo 100% ETo 40% ETo 80% ETo
Residue Treatment Residue Treatment Residue Treatment Residue Treatment
Bare Soil Residue Bare Soil Residue Bare Soil Residue Bare Soil Residue
440 (20)* 392 (16) 933 (31) 816 (11) 561 (19) 394 (23) 674 (11) 599 (21)
380 (17) 444 (21) 594 (26) 546 (24) 436 (11) 401 (31) 603 (19) 559 (11)
*
The standard error of the mean is in parenthesis. Mean separation was calculated using PROC MIXED with a t-type confidence interval of 0.05.
4. Conclusions
In this study, the cotton water use and lint yield of two cotton-cropping systems in the semiarid climate of the Texas High Plains was compared. These cropping systems were conventionally tilled and cotton planted into terminated wheat, on two sites and a low and high irrigation rate over two growing seasons. Our objective was to evaluate the effectiveness of planting cotton into a crop residue obtained by terminating a winter wheat crop planted in December. The purpose of the residue is mainly to provide a mechanical barrier to wind and thus protect cotton seedlings at a time when they are most vulnerable to sandblast damage due to high wind speeds. The selected sites, allowed us to compare the impact of soil texture, i.e., coarse (Brownfield, TX) and fine (New Deal, TX). The residue treatments did not affect the total amount of water evaporated and transpired during the two seasons. However, at both locations the bare residue treatment had a higher lint yield than the cotton grown under the wheat residue. Wicking, the capillary movement of water through the wheat residue was only statisti-cally significant at the site with the coarser texture (Brownfield, TX) and only in one (1994) of the two years.
[image:11.595.86.540.378.496.2]247
improve soil structure, which may lead to higher infiltration rate reducing runoff and storing more rainfall. It was postulated that in a semiarid climate growing a small grain cover crop might use more water than it conserves when combined with a cotton crop. During the 1995 wheat growth period, the conservation tillage treatment used 20% more water than the conventional tillage treatment for all treatments at both locations sup-porting our hypothesis. It was further hypothesized that the use of residue would not increase cotton lint yields, and all the conventionally tilled treatments for two seasons had higher lint yields except for one plot in 1994 at Brownfield over the wheat residue plots. Therefore, for these two locations for the 1994 and 1995 cotton crop seasons, the use of terminated wheat residue did not improve the growing conditions and environment for the cotton crops compared to conventional tillage cropping systems. The significance of this work is that growers using this “conservation compliance” tillage system may not be using water optimally and may even be expe-riencing decreased cotton lint yields.
Acknowledgements
This work is a tribute to the many research contributions of Dr. Dan Krieg, Professor emeritus, Plant and Soil Science, Texas Tech University, to crop physiology and agronomy of dryland cropping systems. On the 18 June 2015 he lost his battle with cancer.
References
[1] USDA-NASS (2014) Texas Crop Production, USDA—National Agricultural Statistics Service, Issue No. PR-163-14, 10 December 2014.
http://www.nass.usda.gov/Statistics_by_State/Texas/Publications/Current_News_Release/2014_Rls/pr16314.pdf
[2] Lascano, R.J. (2000) A General System to Measure and to Calculate Daily Crop Water Use. Agronomy Journal, 92, 821-832. http://dx.doi.org/10.2134/agronj2000.925821x
[3] Colaizzi, P.D., Gowda, P.H., Marek, T.H. and Porter, D.O. (2009) Irrigation in the Texas High Plains: A Brief History and Potential Reductions in Demand. Irrigation & Drainage, 58, 257-274. http://dx.doi.org/10.1002/ird.418
[4] Lascano, R.J., Van Bavel, C.H.M., Hatfield, J.L. and Upchurch, D.R. (1987) Energy and Water Balance of a Sparse Crop: Simulated and Measured Soil and Crop Evaporation. Soil Science Society of America Journal, 51, 1113-1121.
http://dx.doi.org/10.2136/sssaj1987.03615995005100050004x
[5] Lascano, R.J. and Baumhardt, R.L. (1996) Effects of Crop Residue on Soil and Plant Water Evaporation in a Dryland Cotton System. Theoretical Applied Climatology, 54, 69-84. http://dx.doi.org/10.1007/BF00863560
[6] Krieg, D.R. (1996) Physiological Aspects of Ultra Narrow Row Cotton Production. Proceedings of the Beltwide Cot-ton Conference, Nashville, TN. National CotCot-ton Council, Memphis, 9-12 January 1996, 66.
[7] Darawsheh, M.K., Khah, E.M., Aivalakis, G., Chachalis, D. and Sallaku, F. (2009) Cotton Row Spacing and Plant Density Cropping Systems. I. Effects on Accumulation and Partitioning of Dry Mass and LAI. Journal of Food, Agri-culture & Environment, 7, 258-261.
[8] Lascano, R.J., Baumhardt R.L., Hicks, S.K. and Heilman, J.L. (1994) Soil and Plant Water Evaporation from Strip- Tilled Cotton: Measurement and Simulation. Agronomy Journal, 86, 987-994.
http://dx.doi.org/10.2134/agronj1994.00021962008600060011x
[9] Musick, J.T., Pringle, F.B., Harman, W.L. and Stewart B.A. (1990) Long-Term Irrigation Trends-Texas High Plains.
Applied Engineering Agriculture, 6, 717-724. http://dx.doi.org/10.13031/2013.26454
[10] Lascano, R.J. and Nelson, J.R. (2014) Circular Planting to Enhance Rainfall Capture in Dryland Cropping Systems at a Landscape Scale: Measurement and Simulation. In: Ahuja, L.R., Ma, L. and Lascano, R.J., Eds., Practical Applications of Agricultural System Models to Optimize the Use of Limited Water, Advances in Agricultural Systems Modeling, ASA, CSSA, SSSA, Madison, Volume 5, 85-111.
http://dx.do.org/10.2134/advagricsystmodel5.c4
[11] Bordovsky, J.P., Lyle, W.M. and Keeling, J.W. (1994) Crop Rotation and Tillage Effects on Soil Water and Cotton Yield. Agronomy Journal, 86, 1-6. http://dx.doi.org/10.2134/agronj1994.00021962008600010001x
[12] Baker, J.T., McMichael, B., Burke, J.J., Gitz, D.C., Lascano, R.J. and Eprath, J.E. (2009) Sand Abrasion Injury and Biomass Partitioning in Cotton Seedlings. Agronomy Journal, 101, 1297-1303.
http://dx.doi.org/10.2134/agronj2009.0052
248
[14] Van Rensburg, L.D. (2010) Advances in Soil Physics: Application in Irrigation and Dryland Crop Production, South African. Journal of Plant and Soil, 27, 9-18. http://dx.doi.org/10.1080/02571862.2010.10639966
[15] Unger, P.W. (1994) Residue Management for Winter Wheat and Grain Sorghum Production with Limited Irrigation.
Soil Science Society American Journal, 58, 537-542. http://dx.doi.org/10.2136/sssaj1994.03615995005800020041x
[16] Nielsen, D.C., Unger, P.W. and Miller, P.R. (2005) Efficient Water Use in Dryland Cropping Systems in the Great Plains. Agronomy Journal, 97, 364-372. http://dx.doi.org/10.2134/agronj2005.0364
[17] AG-CARES (2004-2008) AG-CARES Annual Report. Texas A & M AgriLife Research & Extension Center, Lubbock.
http://lubbock.tamu.edu/ag-cares/
[18] Helms Farm Research Reports (2001-2005) Helms Farm Annual Reports. Texas A & M AgriLife Research & Exten-sion Center, Lubbock. http://lubbock.tamu.edu/programs/disciplines/irrigation-water/helms-farm-research-reports/
[19] Jones, O.R., Hauser, V.L. and Popham, T.W. (1994) No-Tillage Effects on Infiltration, Runoff, and Water Conserva-tion on Dryland. Transactions of the ASAE, 37, 473-479. http://dx.doi.org/10.13031/2013.28099
[20] Howell, T.A., Steiner, J.L., Schneider, A.D. and Evett, S.R. (1995) Evapotranspiration of Irrigated Winter Wheat— Southern High Plains. Transactions of the ASAE, 38, 745-759. http://dx.doi.org/10.13031/2013.27888
[21] Guerif, J., Richard, G., Durr, C., Machet, J.M., Recous, S. and Roger-Estrade, J. (2001) A Review of Tillage Effects on Crop Residue Management, Seedbed Conditions and Seedling Establishment. Soil & Tillage Research, 61, 13-22.
http://dx.doi.org/10.1016/S0167-1987(01)00187-8
[22] Hobbs, P.R., Sayre, K. and Gupta, R. (2008) The Role of Conservation Agriculture in Sustainable Agriculture. Philo-sophical Transactions of the Royal Society B: Biological Sciences, 363, 543-555.
http://dx.doi.org/10.1098/rstb.2007.2169
[23] Alvarez, R. and Steinbach, H.S. (2009) A Review of the Effects of Tillage Systems on Some Soil Physical Properties, Water Content, Nitrate Availability and Crops Yield in the Argentine Pampas. Soil & Tillage Research, 104, 1-15.
http://dx.doi.org/10.1016/j.still.2009.02.005
[24] Baumhardt, R.L., Keeling, J.W. and Wendt, C.W. (1993) Tillage and Residue Effects on Infiltration into Soils Cropped to Cotton. Agronomy Journal, 85, 379-383. http://dx.doi.org/10.2134/agronj1993.00021962008500020038x
[25] Dao, T.H. (1993) Tillage and Winter Wheat Residue Management Effects on Water Infiltration and Storage. Soil Science Society of America Journal, 57, 1586-1595. http://dx.doi.org/10.2136/sssaj1993.03615995005700060032x
[26] Hoogmoed, W.B. and Stroosnijder, L. (1984) Crust Formation on Sandy Soils in the Sahel. I. Rainfall and Infiltration.
Soil & Tillage Research, 4, 5-23. http://dx.doi.org/10.1016/0167-1987(84)90013-8
[27] Lascano, R.J., Vorheis, J.T., Baumhardt, R.L. and Salisbury, D.R. (1997) Computer-Controlled Variable Intensity Rain Simulator. Soil Science Society of America Journal, 61, 1182-1189.
http://dx.doi.org/10.2136/sssaj1997.03615995006100040025x
[28] Alberts, E.E. and Neibling, W.H. (1994) Influence of Crop Residues on Water Erosion. In: Unger, P.W., Ed., Manag-ing Agricultural Residues, Lewis Publ., Chelsea, MI, 19-39.
[29] Savabi, M.R. and Stott, D.E. (1994) Plant Residue Impact on Rain Interception. Transactions of the ASAE, 37, 1093- 1098. http://dx.doi.org/10.13031/2013.28180
[30] Steiner, J.L. (1994) Crop Residue Effects on Water Conservation. In: Unger, P.W., Ed., Managing Agricultural Resi-dues, Lewis Publ., Chelsea, MI, 41-76.
[31] Baumhardt, R.L., Schwartz, R., Howell, T.A., Evett, S.R. and Colaizzi, P. (2013) Residue Management Effects on Water Use and Yield of Deficit Irrigated Cotton. Agronomy Journal, 105, 1026-1034.
http://dx.doi.org/10.2134/agronj2012.0361
[32] Lascano, R.J. and Van Bavel, C.H.M. (1986) Simulation and Measurement of Evaporation from a Bare Soil. Soil Science Society of America Journal, 50, 1127-1132. http://dx.doi.org/10.2136/sssaj1986.03615995005000050007x
[33] Farahani, H.J. and Ahuja, L.R. (1996) Evapotranspiration Modeling of Partial Canopy/Residue-Covered Fields.
Transactions of the ASAE, 39, 2051-2064. http://dx.doi.org/10.13031/2013.27708
[34] Klocke, N.L., Currie, R.S. and Aiken, R.M. (2009) Soil Water Evaporation and Crop Residues. Transactions of the ASABE, 52, 103-110. http://dx.doi.org/10.13031/2013.25951
[35] Steiner, J.L. (1989) Tillage and Surface Residue Effects on Evaporation from Soils. Soil Science Society American Journal, 53, 911-916. http://dx.doi.org/10.2136/sssaj1989.03615995005300030046x
[36] Enz, J.W., Brun, L.J. and Larsen, J.K. (1988) Evaporation and Energy Balance for Bare and Stubble Covered Soil.
Agricultural and Forest Meteorology, 43, 59-70. http://dx.doi.org/10.1016/0168-1923(88)90006-8
249
[38] Heilman, J.L., McInnes, K.J., Gesch, R.W. and Lascano, R.J. (1992) Evaporation from Ridge-Tilled Soil Covered with Herbicide-Killed Winter Wheat. Soil Science Society American Journal, 56, 1278-1286.
http://dx.doi.org/10.2136/sssaj1992.03615995005600040045x
[39] Fryrear, D.W. and Bilbro, J.D. (1994) Wind Erosion Control with Residues and Related Practices. In: Unger, P.W., Ed.,
Managing Agricultural Residues, Lewis Publ., Chelsea, MI, 7-17.
[40] Evett, S.R. and Lascano, R.J. (1993) ENWATBAL.BAS: A Mechanistic Evapotranspiration Model Written in Com-piled Basic. Agronomy Journal, 85, 763-772. http://dx.doi.org/10.2134/agronj1993.00021962008500030044x
[41] Vorheis, J.T. (1997) Water Balance of Cotton Cropping Systems. Master’s Thesis, Plant and Soil Science Department, Texas Tech University, Lubbock, 38 p.
[42] Ralston, J.T. (1997) Management Strategies for Dryland Cotton Production in West Texas. Master’s Thesis, Plant and Soil Science Department, Texas Tech University, Lubbock, 47 p.
[43] Lyle, W.M. and Bordovsky, J.P. (1981) Low Energy Precision Application (LEPA) Irrigation System. Transactions of the ASAE, 24, 1241-1245. http://dx.doi.org/10.13031/2013.34427
[44] Allen, R.G., Walter, I.A., Elliot, R., Howell, T.A., Itenfisu, D. and Jensen, M.E. (2005) The ASCE Standardized Ref-erence Evapotranspiration Equation. ASCE-EWRI Task Committee Report, January 2005, 70 p.
http://www.kimberly.uidaho.edu/water/asceewri/ascestzdetmain2005.pdf
[45] Bordovsky, J.P., Lyle, W.M., Lascano, R.J. and Upchurch, D.R. (1992) Cotton Irrigation Management with LEPA Systems. Transactions of the ASAE, 35, 879-884. http://dx.doi.org/10.13031/2013.28673
[46] Evett, S.R. (2007) Soil Water and Monitoring Technology. In: Lascano, R.J. and Sojka, R.E., Eds., Irrigation of Agri-cultural Crops, 2nd Edition, ASA, CSSA, SSSA, Madison, 25-84.
[47] Baumhardt, R.L., Lascano, R.J. and Krieg, D.R. (1995) Physical and Hydraulic Properties of a Pullman and Amarillo Soil on the Texas South Plains. Technical Report D.R. No. 95-1, Texas A & M University Agricultural Research and Extension Center, Lubbock/Halfway.
[48] Bertuzzi, P., Bruckler, L., Bay, D. and Chanzy, A. (1994) Sampling Strategies for Soil Water Content to Estimate eva-potranspiration. Irrigation Science, 14, 105-115. http://dx.doi.org/10.1007/BF00193132
[49] Peng, S., Krieg, D.R. and Hicks, S.K. (1989) Cotton Lint Yield Response to Accumulated Heat Units and Soil Water Supply. Field Crop Research, 19, 253-262. http://dx.doi.org/10.1016/0378-4290(89)90097-X
[50] Morrow, M.R. and Krieg, D.R. (1990) Cotton Management Strategies for a Short-Growing Season Environment: Wa-ter-Nitrogen Considerations. Agronomy Journal, 92, 52-56.
http://dx.doi.org/10.2134/agronj1990.00021962008200010011x
[51] USDA-NASS (1994) Agricultural Statistics-1994. http://www.nass.usda.gov/Publications/Ag_Statistics/agr4all.pdf
[52] USDA-NASS (1995) Agricultural Statistics-1995. Chapter II—Statistics of Cotton, Tobacco, Sugar Crops, and Honey.