PRODUCTION AND TRADE OF
ANIMAL PRODUCTS IN SELECTED
ECO COUNTRIES
Mirzaei, Farhad and Heidelbach, Olaf
2006
Online at https://mpra.ub.uni-muenchen.de/241/
P
RODUCTION AND TRADE OF ANIMAL PRODUCTSIN SELECTED
ECO
COUNTRIESFARHAD MIRZAEI*, OLAF HEIDELBACH**
A
BSTRACTThe Economic Cooperation Organization (ECO) is an inter-governmental organi-zation comprising Afghanistan, Azerbaijan, Iran, Pakistan, Turkey and several countries of the Commonwealth of Independent states (CIS) including Kazakhstan, Kyrgyzstan, Tajikistan, Turkmenistan and Uzbekistan. The agricultural sector has remained a major contributor to the national economies of the ECO member countries. According to FAO estimates, in 2002 agriculture generated 25.2 percent of GDP and employed 42 percent of the economically-active population in the ECO region. Livestock production in the ECO countries is predominately based on traditional systems. The amount of livestock products in ECO was about 6,000,000 metric tons (Mt) during the study period. Most of this production belonged to Turkey, Iran and Pakistan, but most red meat, skins and honey is produced by CIS countries. This paper looks at the performance of livestock production and export of Iran and CIS countries within the ECO region and examines the comparative advan-tage indices for these countries. The data from 1992-2002 is supplied by the FAO
(2004). Changes in Iran's production and export structure were compared with CIS producers. The objectives of this paper are: (1) to identify the comparative advantage of Iranian livestock production and export in comparison with CIS countries; (2) to discuss the reasons for changes in comparative advantage over time. The research results show that past trade and production policies, and the economic behavior of producers and exporters, have been such that they could manage neither appropriate and timely responses to world demand, nor proper adaptation to market niches.
Keywords Comparative advantage indices, livestock production and export, Iran, CIS countries, ECO region.
*
Research lectureship, Dept. of Animal Production and Management, Animal Sciences Research Institute (ASRI), P.O. Box: 31535-579, Karaj, Iran. Email: farmir2003203@yahoo.com.
**
1 I
NTRODUCTIONsilk, honey, fruits and vegetables. The major farm products of the ECO member countries in 2001 were wheat, barley, rice, sugar cane, sugar beet, seed cotton, potatoes, tomatoes, meat, milk and milk products. The main issues and constraints faced in the process of reform in the agriculture and livestock sectors in ECO Countries can be identified as: a) lack of an adequate institutional framework for implementing the reform policies, b) extremely limited capacity for policy analysis to provide technical support in policy-related decision-making, c) macro-economic constraints, d) limited availability of information, especially on cost of production of crops and livestock for making farm-level decisions on production and marketing fronts, e) existing food security policies aimed at enhancing self-sufficiency at the expense of the long-term efficiency of resource use, and comparative advantage in the production of different commodities in these countries (LERMAN, 1999). The contribution of agriculture
to the ECO countries’ exports fluctuates but stays near 8 percent, while imports hover around 10 percent. Although intra-regional trade among ECO countries is still low, at about 4 percent of total exports, the share of agriculture in intra-regional trade is quite significant at about 21 percent. The market potential and constraints assessment showed that households marketed their livestock products as a rule to middleman/middle women and got rather low prices. Only meat and milk and milk products are marketable commodities for households.
The objectives of this paper are: (1) to identify the production and export comparative advantage of Iranian livestock products in comparison with CIS countries; (2) to discuss reasons for changes in comparative advantage over time.
We start by presenting the methodology applied and the data used for analysis. We proceed by describing results and then by drawing conclusions.
2 M
ETHODOLOGY AND DATAThis paper looks at the performance of livestock production and export of selected ECO member countries and examines comparative advantage indices such as Domestic Resource Cost (DRC) and Revealed Comparative Advantage (RCA). Within the framework of DRC methodology, all materials and technical resources are divided into marketable (sellable) and non-marketable (unsellable). Marketable resources include all types of material and technical resources available on the market, including inputs as fertilizers, seeds, fuel and lubricants and chemicals. Non-marketable resources include expenses for supplying water, rental fees for land, labor costs and the lease of equipment. The Domestic Resource Cost formula as discussed in MONKE and PEARSON (1994) is in the following:
which is grounded in traditional international trade theory and based on export specialization. The original RCA index was formulated by BALASSA (1965) as
RCA = (Xij/Xtj)/(Xin/Xtn) where X represents exports, i is a country, j is a commodity and n is a set of countries (in this case, the ECO members). RCA is based on export performance and observed trade patterns, and measures a country’s exports of a commodity relative to its total exports and to the corresponding export performance of a set of countries, e.g. if RCA > 1, then a comparative advantage is revealed. Indices for Iran and CIS countries are estimated for the period 1992-2003, with the data supplied by the FAO (2004).
3 R
ESULTSThe animal population in the ECO region grew at an annual rate of 6.7 percent from 1994-2003. This increase was 3.75 percent in Iran, 4.2 percent in Pakistan, 6 percent in Turkmenistan and 2.9 percent in Uzbekistan. In fact, the other member states experienced a decline in their livestock populations. The contribution of CIS countries to the total value of agricultural products is 14.1 percent; the share for Iran, Pakistan and Turkey is 33.6 percent, 34.4 percent, and 17.9 percent, respectively. The Iranian export rate is 10.4 percent, Kazakhstan’s is 25.4 percent, Turkey’s is 43.7 percent, Pakistan’s is 16.7 percent, and of the rest of the members’ rate is 4.8 percent. The Iranian import rate is about 37.7 percent, Turkey’s is 22.1 percent, Tajikistan’s is 19.4 percent, Uzbekistan’s is 10 percent, and the share of the remaining countries is 10.8 percent. The data implies that Iran and Turkey are, respectively, the largest importer and the largest exporter in the region. The calculation of livestock products is carried out for five major products, namely milk, mutton, beef, poultry meat and eggs. Data on the cost of production for livestock products was collected by the Department of Livestock Affairs of the Ministry of Agriculture, while the data on trade was extracted from the Yearbook of the Islamic Republic of Iran. The calculations were carried out in collaboration with the FAO and the Institute of Agricultural Planning and Economic Research.
advantage for red meat production. Also, the value of DRC indicates a comparative advantage for egg production in the country and reveals that there are comparative advantages in the country for egg production. The DRC calculation results show that there is a comparative advantage for poultry production (DRC < 1).
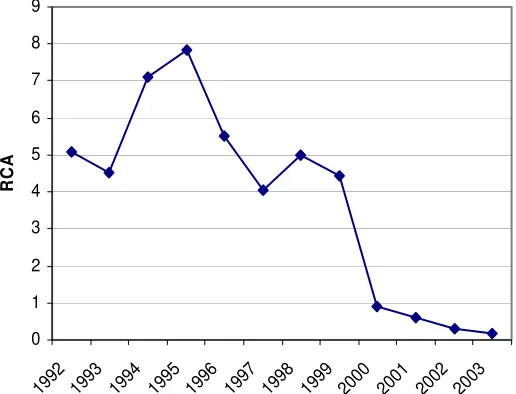
[image:6.595.172.430.273.470.2]The RCA trend for livestock products of selected countries during the study period shows that there is no harmonized trade policy in these countries with respect to regional and global markets (Table 1). A comparative advantage for Kazakhstan in livestock production (Figure 1) is revealed (RCA > 1) in 1992, but RCA in 1993 declined.
Figure 1: RCA trend for Kazakhstan
However, this country has protected its revealed comparative advantage (RCA = 4.54). Although this index was relatively stable from 1996-1999, it experienced a significant reduction after 1999. From 2000 on, Kazakhstan lost its powerful revealed comparative advantage in the region. This subject indicates the inflexibility of trade policy-makers who are trying to protect their trade advantage in the regional niche market.
Table 1: RCA values for selected countries
Year/Country 1992 1993 1994 1995 1996 1997 1998 1999 2000 2001 2002 2003
Iran 0.84 0.27 1.72 0.28 0.29 0.82 0.8 0.92 2.8 2 1.65 1.56
Kazakhstan 5.06 4.54 7.12 7.84 5.53 4.06 5 4.42 0.9 0.61 0.31 0.16 Kyrgyzstan 9.42 3.06 8.1 5.5 2.63 3.03 2.03 2.55 2.63 3.21 1.6 3.34 Uzbekistan 0 0.21 0.07 0.11 0.26 0.21 0.28 0.38 0.31 0.26 0.08 0.19 Turkmenistan 0.01 1.32 0.59 1.75 1.82 2 0.8 1.21 0.87 0.63 1.23 0.51 Tajikistan 0.02 0.74 0.1 0.23 0.23 0.18 0.31 0.1 0.21 0.11 0.02 0.1 Source: Own calculations based on FAOSTAT, 2004.
0 1 2 3 4 5 6 7 8 9
199 2
1993 199
4
1995 199
6
1997 199
8
1999 2000 2001 200
2 200
3
RC
Despite Kyrgyzstan’s revealed comparative advantage (RCA > 1) during the study period, fluctuation is also visible for this country (see Figure 2). After some vacillation, RCA declined by 2.8 times over the study period (from 9.42 in 1992 to 3.34 in 2003).
Figure 2: RCA trend for Kyrgyzstan
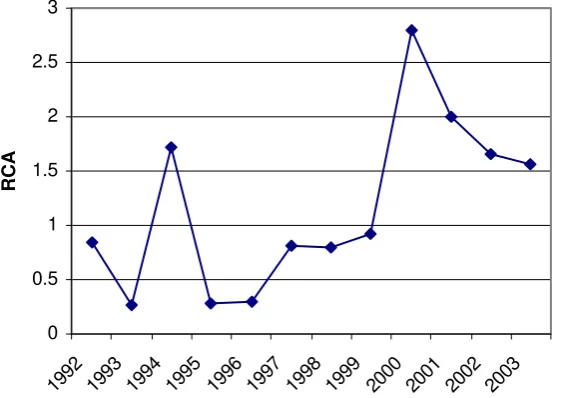
Fluctuation is even more characteristic for the rest of the selected countries. In Iran (Figure 3) after 2 years of comparative disadvantage, RCA increased in 1994 to a value above 1. However, Iran again lost its advantage during the following years (1995-1999). Although we can observe RCA values above 1 from 2000 on, the absolute value is decreasing steadily.
Figure 3: RCA trend for Iran
0 0.5 1 1.5 2 2.5 3 199 2 199 3 199 4 199 5
199
6
199
7
199
8
199
9
200
0
200
1
200
2
200
3 RC A 0 1 2 3 4 5 6 7 8 9 10
1992 1993 1994 1995 199 6
1997 1998 1999 2000 2001 2002 2003
RC
[image:7.595.165.441.187.382.2] [image:7.595.162.445.511.710.2]Uzbekistan (Figure 4) did not realize any livestock product export in 1992 (RCA1992 = 0). In the following years it didn't gain any revealed comparative
advantage.
Figure 4: RCA trend for Uzbekistan
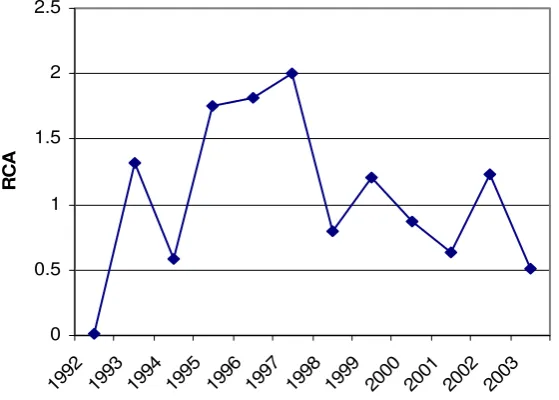
Turkmenistan (Figure 5) had an RCA value higher than 1 in 1993, 1995, 1996, 1997, 1999, and 2002 and an RCA value less than 1 in all other years. The regular fluctuation is caused by uncertain policies and trade imbalances.
Figure 5: RCA trend for Turkmenistan
0 0.05 0.1 0.15 0.2 0.25 0.3 0.35 0.4
199
2
199
3
199
4
199
5
199
6
199
7
199
8
199
9
200
0
200
1
200
2
200
3
RCA
0 0.5 1 1.5 2 2.5
1992 1993 1994 1995 19 96
1997 1998 199 9
2000 2001 2002 2003
RC
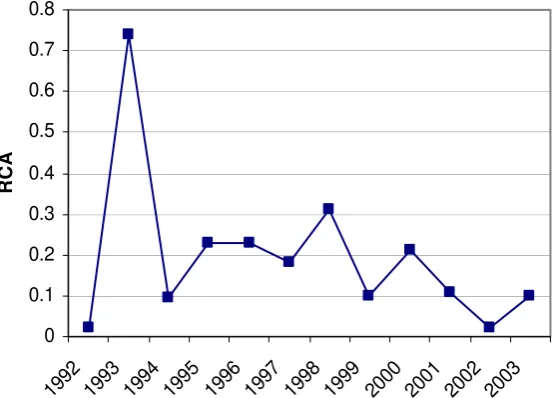
[image:8.595.166.436.160.364.2] [image:8.595.162.442.479.679.2]Finally, Tajikistan (Figure 6) shows similar development to Uzbekistan – however, its RCA fluctuation is more intensive.
Figure 6: RCA trend for Tajikistan
Figure 7 summarizes the RCA results for all countries, and shows a clear and deductive image of selected countries' RCA. What can be observed are instabilities in policy-making and untimely reactions to target market signals, as well as increasing regional and world demand. This might be explained by higher elasticities of demand for livestock products compared to most crop products, i.e., rising incomes have a more significant effect on demand.
Figure 7: RCA trends for analysed countries
0 0.1 0.2 0.3 0.4 0.5 0.6 0.7 0.8
1992 199 3
1994 1995 199 6
1997 1998 1999 2000 2001 2002 2003
RCA
0 1 2 3 4 5 6 7 8 9 10
1992 1993 1994 1995 1996 1997 1998 1999 2000 2001 2002 2003
RC
A
IRAN
KAZAKHSTAN
KYRGYZSTAN
UZBEKISTAN
TURKMENISTAN
[image:9.595.163.441.142.341.2] [image:9.595.146.460.513.708.2]4 D
ISCUSSION: P
ROSPECTS OF THE LIVESTOCK SECTOR IN SELECTED COUNTRIESThe ECO region can become a strong agricultural exporting block through regional co-operation in productivity enhancement, including pooling skills and experiences, cross training, more efficient use of international consultants, savings on joint export infrastructures and safety accredited testing laboratories. Enhancing institutional capacities in the region for developing market economies and harmonizing trade policies, particularly on pricing and food safety standards, will further help to develop the region’s competitiveness in international markets.
The CIS countries have a somewhat different status. This region is comprised of five countries that were part of the Soviet Union and are suffering from the effects of the inherited central planning and control system.
Geographically, Kazakhstan is the largest of the CIS group of countries, and its agricultural sector contributes 8 percent to GDP and employs 22 percent of its economically-active population. Wheat is the major agricultural commodity produced. Further products include cotton, meat, poultry and milk. With the disintegration of the USSR, demand for these products declined abruptly and is only now slightly picking up. Farmers are reducing their production and are trying to adjust supply to the market demand. This resulted in the slow adoption of modern technologies. This vicious circle of low demand, lower production (supply), non-use of modern technologies and inputs is negatively effecting incomes and employment in rural areas. This holds especially for small farmers, farm workers, women and other weaker sections of society. The livestock sector in Kazakhstan has tremendous potential to contribute substantially to income, growth, employment and export opportunities in rural areas. Its potentials are marked by the vast but underexploited rangelands, the flexible, low-cost production structure of the small-holder farms, and the availability of low-cost by-products from large-scale crop production (feed grain and oilseed meals).
The Kyrgyz Republic was one of the poorest states of the former Soviet Union and the country was the main provider of high-quality wool, cotton, silk, tobacco, fruits and vegetables, and mutton. Agriculture is the most important sector of the economy and accounts for about 45 percent of the gross domestic product. The livestock sector was one of the sectors that suffered most after the collapse of the Soviet Union. There is a great need for comprehensive sector development with emphasis on small farmers and food security.
sector. Livestock production accounts for about 30 percent of total agricultural production. A large share of livestock production comes from private plots – 63 percent in 1994, compared to only 37 percent from state and collective farms. Since 1988, total livestock production has dropped by 35 percent. The sector faces a number of constraints: Deterioration of grazing land, insufficient supplies of medicine, fodder crops, minerals and vitamins; and weak animal husbandry management are some issues that limit growth.
In Turkmenistan, agriculture is the main source of livelihood for an estimated 55 percent of the total population. The sector contributed about 27 percent to annual GDP in the last five years and is the second most important income source for foreign currencies (mostly resulting from exports of cotton) after the energy sector.
In Uzbekistan, agriculture is a priority sector as it is still a major contributor to economic growth of the country. It provides about 30 percent to the GDP. More than half of the country's population (63 percent) live in rural areas, and are engaged in agriculture and related activities. Agriculture employs about 35 percent of the labor force of the country and is one of the main foreign exchange earners of the country.
5 C
ONCLUSIONSThree percent of world’s livestock products are produced in the ECO region, but 5.9 percent of the world’s population lives in this region. In all of the investigated countries, the agricultural sector plays an important role in both income generation and employment provision. The livestock sector has a significant, but in recent years decreasing, share in agricultural production, partly caused by the lowered export potential for most of the investigated countries as shown by the results of the RCA analysis.
Low production and the resulting food insecurity may be overcome by enhancing the production of commodities with comparative advantage and promoting trade between ECO member countries by abandoning tariffs and quotas.
R
EFERENCESA.P.E.R.I. (2004): Agriculture in ECO member countries, Agriculture Planning and Economic Research Institute, Iran.
BALASSA, B. (1965): Trade liberalization and revealed comparative advantage, Manchester School of Economic and Social Studies, 33, pp. 99-124.
FAO (2004): Agricultural productivity enhancement and export development in ECO Region.
MONKE, E. A., PEARSON, S. R. (1994): The policy analysis matrix for agricultural develop-ment, Cornell University Press.
GORTON, M., DAVIDAVA, S. (2001): The international competitiveness of CEEC agriculture, British Association of Slavonic and East European Studies (BASESS) Conference, Cambridge, 07.-09.04.2001.
KLASRA, M. A., HALIL, F. (2004): Competitiveness and the trade of livestock products: A comparative study between Turkey and its Neighboring countries, Journal of Applied Sciences, No. 4, pp. 663-668.