Munich Personal RePEc Archive
Conversion Efficiency as a
Complementing Measure of Welfare in
Capability Space
Binder, Martin and Broekel, Tom
Max Planck Institute of Economics, Evolutionary Economics Group,
Department of Economic Geography, Faculty of Geosciences,
Utrecht University
9 March 2008
Online at
https://mpra.ub.uni-muenchen.de/7583/
C
ONVERSION
E
FFICIENCY AS A
C
OMPLEMENTING
MEASURE OF
W
ELFARE IN
C
APABILITY
S
PACE
Martin Binder
# §Tom Broekel
$ ∗#
Max Planck Institute of Economics, Germany
$
Department of Economic Geography,
Faculty of Geosciences, Utrecht University, The Netherlands
9th March 2008
Abstract
In the capability literature, studies on the empirical measurement in the functionings space are
abundant and a few studies even measure capability to function. We suggest adopting a third
measure of welfare relevant to economists, namely the “conversion efficiency” measuring the
efficiency with which individuals convert their resources into achieved functioning. We use a
nonparametric efficiency procedure and construct such a measure for a basket of basic
function-ing achievement, usfunction-ing data from the British Household Panel Survey (BHPS).
Keywords: conversion efficiency, welfare measurement, robust nonparametric efficiency
analysis, functioning production
JEL-classification: I12, I31, R15
§
Corresponding author: Martin Binder, Evolutionary Economics Group, Max Planck Institute of Economics, 07745 Jena, Germany. Phone: +49 3641 686 828. Fax: +49 3641 686 868. E-mail: [email protected]
∗The authors would like to thank the participants of a seminar at the Evolutionary Economics Group
1
Introduction
Amartya Sen’s capability and functionings approach (Sen, 1984, 1985a,b, 1992) has been
rec-ognized as a theoretically elaborate and differentiated contribution to welfare measurement.
Despite doubts about whether the approach can indeed be empirically useful and made
opera-ble (Sugden, 1993, p.1953), the capability approach has spawned a large literature of different
approaches toward empirically capturing ‘achieved functionings’ (see Sen’s own work, e.g. Sen
(1985a) and see Kuklys (2005, pp.25-8) for a comprehensive overview). In contrast, measuring
‘capability to function’, i.e. the freedom and possibility to achieve certain functionings, is much
more difficult. To the authors’ knowledge, there are only very few studies on this subject (e.g.
Anand and Hees, 2006).
The present paper wants to add to the empirical functioning measurement literature in
adding a complementary measure beside the two strands of measures mentioned above. We
argue that the absolute measurement of functioning achievement (and capability to function)
should be complemented by a measure more familiar to most economists, namely theefficiency
with which individual resources are transformed into achieved functioning. The order-m
effi-ciency method we suggest allows us to compute for a given sample of individuals an efficient
frontier on which are these individuals who are most efficient in transforming their resources
into achieved functioning. The distribution of effiency scores relative to that frontier allows
some additional insights regarding the assessment of welfare in capability space (subject to
some qualifications to be discussed later). Based on the idea that inefficencies are
undesir-able also in capability based welfare assessements, we argue that a measure of ‘conversion
efficiency’ reflects diverse welfare-reducing institutional constraints on the individuals.
The paper is structured as follows. Section 2 gives a short overview of the capability and
functionings approach. In section 3, we discuss our idea of ‘conversion efficiency’ as a
com-plementary measure of welfare in capability space. We then proceed in section 4 to discuss
the nonparametric efficiency analysis approach. The method is borrowed from the production
efficiency literature.1 We are using a non-convex order-m frontier estimation in a two-stage framework. To highlight our approach, in section 5, we employ the suggested method for a
basket of “basic functionings” (Sen, 1993), namely for the functionings ‘being happy’, ‘being
educated’ and ‘being healthy’. We use the efficiency method to assess the conversion efficiency
of this basket of functionings for the British Household Panel Survey (BHPS) dataset (BHPS,
2007; Taylor, 2007). Section 6 concludes.
1
2
Theoretical Background
Amartya Sen’s capabilities and functionings approach (Sen, 1984, 1985a,b, 1992) is an
evalua-tive framework to assess individual welfare. In this account, living is seen as consisting of aset
of functionings, which could be described as different aspects of life. Functionings thus describe
the achievement of an individual. They give us the information about what a person is and what
she does. Note that for an assessment of a person’s well-being, Sen proposes not only ‘being
happy’ (as in the utilitarian tradition) but other intrinsic values as well: Other functionings are
for example ‘being nourished’, ‘avoiding premature mortality’ (Sen, 1992, p.39) or ‘being in
good health’, ‘being well-sheltered’, ‘being educated’ or ‘moving about freely’ (Kuklys, 2005,
p.10). This approach ismulti-dimensionalas a person’s state of being (and her individual
ac-tivities) is a vector of functionings. When choosing what way of life to live, a person chooses
from different functioning vectors. The set of all feasible functioning vectors for a person is
this person’s capability set. It is a derived notion and represents the person’s opportunities to
achieve well-being (cf. Sugden, 1993, p.1951), reflecting the various functionings that are
po-tentially achievable. It furthermore includes the person’s freedom to choose between different
ways of living. Note that we can distinguish between these two dimensions of functionings and
capabilities. While there is a number of promising applications to measure functioning
achieve-ment, it is more difficult to actually measure the potentially achievable functionings (viz. the
capabilities). Thus, most empirical accounts today focus on the narrower notion of functionings
(but see Anand and Hees, 2006).
Let us have a closer look at the specification of the functionings as a measure of a person’s
well-being. In set-theoretic notation,2
we can describe a vector of functionings as
~b=fi(c(~x)|z~i, ~ze, ~zs) (1)
where~b, the vector of functionings is defined by the following elements: ~x ∈ X is a vector of commodities out of the set of all possible commoditiesX. This includesexpressis verbis non-market goods and services as well. ~x is mapped into the space of characteristics (Lancaster, 1966) via the conversion function c(•)so that~c = c(~x)would be a characteristics vector of a given commodity vector~x. The characteristics of a commodity do not vary across individuals, i.e. they are the same for everyone. What does vary, however, is the way individuals can
ben-efit from the characteristics of a commodity. Think of a person who possesses a loaf of bread.
Someone suffering from a parasitic disease would benefit less from the characteristic “caloric
content” than someone being well-fed (Sen, 1985a, p.9). This is reflected by the conversion
function of an individualfi ∈ Fi that maps a vector of characteristics into the space of
func-tionings (F is the set of all possible conversion functions). This conversion is influenced by the conversion factors z~k, where we can distinguish individual (~zi), social (z~s) and environmental
2
(z~e) influences. Individual factors could be sex, intelligence, physical (dis)abilities, etc. Social influences are legal regulations, population density, etc. Examples for environmental factors
include climate, environmental pollution and so on (Kuklys, 2005, p.11). These conversion
fac-tors can be seen as non-monetary constraints an individual faces. Note that selection of some
of the conversion functions is part of an individual’s capability to function (see Sen, 1985a, of
course, some conversion functions are just not eligible, e.g. being female or male, and thus
outside an individual’s control).
We can easily see how Sen has extended the standard welfare economic calculus to include
relevant other factors which are often neglected: Functioning achievement depends on
com-modities (~x)andnon-monetary constraints (z~k).
In a second step, to evaluate individual welfare, we are interested in the capability setQi of
an individuali. This set can now be defined as
Qi(Xi) =
n
~ bi
~
bi =fi(c(x~i)|z~i, ~ze, ~zs)∀fi ∈Fi∧ ∀x~i ∈Xi
o
(2)
It represents the set of all potential functionings an individualican achieve given his constraints (Xi,z~k).
The capability approach offers a genuine alternative to the empirical measurement of human
welfare with a multi-dimensional measure. Though critics doubt that this approach might be
operationalized (e.g. Sugden, 1993, p.1953), there has emerged a quite extensive literature on
the empirical measurement of valuable functionings (Kuklys, 2005, pp.25-8, gives a survey).
However, Sen’s approach has been devised with a certain openness regarding the selection
of a set of valuable functionings. While Sen favors this openness and stresses the deliberative
social dimension that is involved in choosing a set of valuable functionings, other authors have
promoted lists of functionings that supposedly reflect a common consensus of what is valuable
(e.g. Nussbaum, 2000). Note that this indeterminacy of the approach has resulted in an
empir-ical measurement literature that measures welfare in capability space over an ad hocrange of
different functionings. A different strategy to construct a set of valuable functionings that are
supposedly valued by (virtually) all persons could lie in a basket of “basic functionings” (Sen,
1993): Such a basket would contain all these functionings that cater to ‘basic needs’. As we
will discuss in the following section, these basic needs share interesting features and can help
to somewhat remedy this list selection problem. First, however, we will introduce the idea of
‘conversion efficiency’, relating to the conversion function discussed above.
3
On the Interpretation of Efficiency in
Capa-bility Space
We want to add to the empirical capability measurement literature a complementing measure
mea-surement of capability (and functioning achievement) should be complemented by a measure
more familiar to most economists, namely the efficiency with which individual resources are
transformed into achieved functioning. Above we have seen that the transformation of a vector
of commodities into achieved functionings depends on the conversion function of the
individ-ual, which is influenced by individindivid-ual, social and environmental factors. As has been noted,
this conversion function plays an important role in defining an individuals capability set and in
determining the level of functioning achievement an individual can reach. It would be therefore
interesting to examine the role and effects of the conversion factors.
Let us illustrate the idea of conversion efficiencywith a small example. Consider two
in-dividuals who are similar with respect to their resources (measured by their income, i.e. with
identical purchasing power). For both individuals information about their functioning
achieve-ment is available. In practice, this requires that a commonly agreed on definition of a vector
of functionings is available which can be empirically measured (this holds similarly for the
resource vector).
Given this information, let us assume that one individual shows lower values than the other
individual in the level of achievement in one or more functionings. Both can spend the same
re-sources for their functionings achievement (they have the same income). Conversion efficiency
captures the difference in the functionings achievement that does not come from differences in
these individuals’ resources (incomes). Conversion efficiency thus captures the difference in
functioning achievement that is caused by differences in the personal, social and environmental
conversion factors.3
So what can be the reasons for these two individuals’ levels of achieved functionings to
differ despite their identical resources? Can they spend their income on things that do not
increase functioning achievement? This would be the case if the definition of the functionings
vector does not cover all functionings that are relevant to these two individuals (we will take
up this question again below). The same can be argued for the resource vector. Maybe for
some functionings, one would need other resources than the commodity vector. Might not be
education be an individual’s input when it comes to resources needed to achieve high ‘material
well-being’?! Indeed, this question points to a circularity in Sen’s framework because some
achieved functionings might be relevant resources to be transformed into other functionings. Or
some functionings might be relevant conversion factors in the transformation of resources into
achieved functioning (‘being healthy’ would influence ‘being happy’ according to findings in
happiness research, and maybe vice versa).4
Consider the given commodity vector that is transformed into functioning achievement
3
Obviously, this concept builds on the assumption that it takes resources (measured as income) for people to increase their levels of functionings.
4
(equation 1) subject to conversion factors. If we control for such personal conversion factors as
age or gender, we still find other environmental or institutional conversion factors that determine
how much of the commodities are needed to reach a given level of functioning achievement. We
argue that it is these remaining conversion factors which we can capture with a measure of
‘con-version efficiency’.
Let us discuss this in more detail. An efficiency measure as the one we are talking about
basically reflects how efficient given inputs are transformed into outputs. In our case, output
is ‘achieved functioning’ and input is income, understood as a proxy for the goods vector in
the Senian framework. An efficiency analysis then is done for a given group of individuals. A
frontier of efficient individuals is calculated. On this frontier, one finds these individuals that are
efficient in reaching the highest level of achievement with given different levels of resources.
Note that this reflects the idea of a relative efficiency, i.e. we are evaluating individuals
effi-ciency not with respect to a theoretically derived maximum, but to the maximum of functioning
achievement observed in the data given a certain level of resources. Given the difficulties in
defining the theoretical maximal functionings achievement for a certain level of resources this
seems to be a very sound approach. On such a relative frontier can be individuals with low
achievements and low resources (but these low resources are transformed very efficiently) and
individuals with high achievements and high resources (but also with an efficient
transforma-tion).
Based on this, we argue that some individuals at a given time are efficient in their use of
their income (of whatever level) in achieving valuable functionings. Others are not efficient
(to varying degrees, as measured by their distance to the efficient frontier). But what does that
mean? Let us consider first the ideal case of a comprehensive functioning measure that includes
all valuable functionings which constitute welfare. This would be a comprehensive measure of
welfare in capability space and encompass all that makes a human life go well according to the
capability definition (it would capture all that is valued by the individuals). Some people are
efficient in transforming their resources into such a comprehensive output measure.
Our argument is that regardless of the absolute height of functioning achievement,
ineffi-ciency in transformation is undesirable from an economic point of view. This ineffiineffi-ciency is
reflected in our measure of conversion efficiency. Of course, this measure should be understood
as a complement to the other two capability measures of welfare because of its relative nature.
What we claim is that focusing only on the absolute levels of functioning achievement neglects
important welfare information that could be put to good use (Sen has been always promoting
the idea of a richer informational structure to assess welfare).
In that respect, a distribution of efficiency scores offers the analyst valuable information
whether there exist obstacles in the conversion of resources into functionings achievement.
Given that a set of suitable controls is included in the analysis, it is thus possible to single out
environ-mental) constraints. Individuals on the efficiency frontier constitute in this case the best-practice
in functioning achievement. Note that such a reference group does not constitute an ideal
max-imum of functioning achievement but the realiter existing best group in terms of conversion
efficiency. Other individuals are now evaluated relative to these role models and their distance
to the frontier is interpreted as a measure of how inefficient these individuals are in transforming
their resources into achieved functioning.
The frontier here thus reflects at a given time the societal optimum which can be reached
for given levels of resources (i.e. some individuals have actually reached it). The more people
falling short of this (as measured by the distribution of distance to the frontier and controlling for
individual factors), the less favorable are the overall societal conditions for the transformation
of given resources into functioning achievement. We interpret this as institutional
shortcom-ings that create a barrier for a certain group of people.5
Naturally, these distributions could
be evaluated in cross-country comparisons or one could analyze their change over given time
spans.6
There are two important extreme cases that are worth our attention. Consider on the one
hand the very rich person who has a maximal achieved functioning and excess income. Whether
it is indeed possible to achieve maximum functionings is matter of debate which has been
never addressed in the capability literature (especially since it often aims at applications for
measuring poverty and since it is not clear what the complete set of functionings would be). If
so, such a rich individual could turn out to be inefficient in his resource use despite maximum
achievement. We think that although this might seem prima faciecounter-intuitive, the wealth
here is inefficiently distributed from a societal perspective. From this aggregate perspective,
there seems nothing wrong with arguing that this individual is not efficient in the conversion of
resources into functioning achievement (i.e. that individual has too much resources given the
level of achieved functionings). From an egalitarian point of view, the excess resources could be
used somewhere else. Furthermore, regarding the comprehensive capability welfare measure, it
is unlikely to find many cases of individuals who have maximal functioning achievement in all
functionings (considering the many conceivable functionings in that set).
The other extreme case concerns the very poor individual having very low but very efficient
functioning achievement. Again, in a restricted view on conversion efficiency, this case is
prob-lematic since absolute poverty would be masked behind relative efficiency. Therefore we argue
that conversion efficiency can only be a complement to the absolute functioning measures. The
aim of our measure is to identify inefficiencies (‘slack’) for given levels of functioning
achieve-ment. This has been always an important aim in economics but seems to have been somewhat
5
There may exist constraints even for the efficient individuals. However, from the point of view of our approach, we are interested in these constraints that result in inequality, i.e. which affect only subgroups of people (and here rather the less well-off subgroups). The analysis suggested here is thus well suited in examining relative inequalities.
6
neglected in the capability literature. We aim at capturing these inefficiencies which are at an
institutional level by correcting for individual effects coming from personal characteristics such
as age, gender etc.
One last qualification is in order. The method becomes a little more problematic in the less
ideal case of considering as output only a subset of functionings, i.e. using a non-comprehensive
welfare measure (as is usually done in the literature). Consider the example of below, where we
examine the transformation of given resources into achieved functioning regarding happiness,
health and education. One could imagine a case where an individual having many resources
scores low in efficiency for these functionings because only a subset of functionings is
exam-ined. Maybe that individual has picked an overall capability set that is efficient in the overall
transformation of resources into achieved functioning but not regarding the subset of
function-ings examined (one could imagine a resourceful person not having much interest in his health
and thus neglecting this field, or someone being focused on one functioning and pouring
ineffi-cient amounts of resources here).
Indeed, when focusing on a subset of functionings as output in the analysis, this line of
criticism cannot be excluded completely. Therefore, we argue that this kind of analysis should
only be conducted for subsets of functionings such as “basic functionings” (Sen, 1993), where
one can argue that everyone is interested in the efficient transformation of resources into these
functionings. By basic functionings, one could understand all these functionings that relate
to the fulfillment of ‘basic needs’. In that sense, everyone has these basic needs in order to
survive and/or lead a healthy life. These basic functionings defined on basic needs would be a
set of functionings that is “inescapable” (Thomson, 1987), i.e. we all share them, for example
because the underlying needs are biologically fixed (our argument here draws on the theory
of Witt, 2001, who argues that such basic needs are identical to the biologically fixed primary
reinforcers). A set of such basic functionings would indeed (with usual genetic variance) be
shared by everyone and one has good arguments that these are valued by everyone.
If we can assume that in the case of basic functionings, everyone has the same preferences
then the differences in conversion efficiency can be attributed to constraining factors such as
argued above. In such a case, the analyst would not need fear that someone would achieve
low efficiency scores because that individual is not interested in (efficiently) transforming given
resources into achieved functioning (the idea of different efficiencies and their relevance for
welfare economics has been expressed in a similar fashion in the context of Becker’s household
production theory, cf. Michael and Becker, 1973). If a shared valued set of functionings is the
normative maximand for the welfare analyst, he can safely attribute differences in efficiencies
to result from constraints which should be the aim of welfare policies.
We will now turn to a detailed discussion of our nonparametric approach to measuring
conversion efficiency. After this discussion, we then exemplify the method with an analysis of
4
A Nonparametric Approach to Efficiency
Measurement
Having discussed the theoretical foundations of the capability approach and our idea of a
mea-sure of ‘conversion efficiency’, we now turn to the empirical meamea-surement with a robust
parametric efficiency analysis. An efficiency analysis can be conducted in a parametric or
non-parametric form. We share the concerns about non-parametric efficiency analysis brought forward
by Ravallion (2005): Having to specify a functional form is only one of the problems noted by
Ravallion that comes from adopting a parametric efficiency analysis. Similarly, in parametric
models, the functional form of the transformation process of resources into functioning
achieve-ment is assumed to be identical for all individuals. Our approach differs in this respect since the
nonparametric efficiency analysis does not require to specify the functional relationshipex-ante;
nor do we need to assume that individuals transform their resources into functioning
achieve-ment in an identical manner. Thus, our approach is more general and does not require strong
assumptions concerning the relationship of the variables. We are thus not affected by the main
thrust of the Ravallion criticism.
The order-m efficiency method we suggest allows us to compute an efficient frontier for
a given sample of individuals. On the frontier are these individuals which are most efficient
in transforming their resources into achieved functioning. The distribution of effiency scores
relative to that frontier allows some additional insights regarding the assessment of welfare in
capability space (subject to some qualifications to be discussed below). Based on the idea that
inefficencies are undesirable also in capability based welfare assessements, we argue that such
a measure of ‘conversion efficiency’ reflects diverse welfare-reducing institutional constraints
on the individuals.
The specific non-convex, order-mnonparametric efficiency analysis employed in this paper, seems to be particularly appealing because of the comparatively few assumptions that have to
be made. Its main idea is very simple: individuals are compared to each other on the basis of
the principle ofweak dominancewith respect to their endowment with resources and observed
functionings achievement. In the following this method is presented only briefly. For an
exten-sive treatment of this method see, e.g., Daraio and Simar (2007) and for an introduction into
efficiency analysis see, e.g., Cooper et al. (2004).
More precisely, in a first step, the best-practice individuals with respect to their levels of
functionings achievement and levels of resources are identified. Using the principle of weak
dominance, thebest-practice individuals are characterized by that no other individual with an
equal or lower level of resources, shows a higher level of functionings achievement. Thus,
individuals are compared to other individuals having similar (i.e. equal or lower) levels of
resources.7
All individuals that fulfill this criteria form an individual’sreference group.
Depen-7
dent on the individual’s levels of resources this reference group differs for each individual.
If in comparison to this reference group an individual’s level of functionings achievement is
higher the individual becomes part of the best-practice frontier and it is declared efficient. If its
level of functionings achievement is below that of the reference group, i.e. it is located below the
best-practice frontier, it is declared inefficient. The distance to the efficiency frontier indicates
its degree of inefficiency. In the presented approach this distance reflects the vertical (Euclidean)
distance between the observations and the efficiency frontier. The larger the distance the more
inefficient is an individual.
The described procedure has been formulated as the Free Disposal Hull (FDH) approach
by Deprins et al. (1984). It is apparent that an efficiency frontier defined in this way is
de-termined by the extreme positive (most efficient) observations making the efficiency analysis
very sensitive with respect to the existence of outliers and noise in the data (see, e.g., Wilson,
1993). This drawback has been overcome by the introduction of robustnonparametric frontier
techniques (see for an introduction Daraio and Simar, 2007). One of therobustversions of the
FDH approach is the order-mfrontier approach developed by Cazals et al. (2002).
In contrast to the FDH approach, the idea behind the order-m approach is that instead of evaluating an observation’s efficiency with respect to the efficiency of all other observations,
Cazals et al. (2002) propose to compare them to a randomly drawn (sub-) sample of
observa-tions.8 This makes the nonparametric frontier function a partial frontier because not all
ob-servations are enveloped but only a sub-sample. Based on the partial frontier the evaluation of
individuals’ efficiencies as well as the estimation of the efficiency scores are done in an
iden-tical manner as presented above in case of the FDH approach. More precisely, it shows as the
following.
For a multivariate case consider(x0, y0)as the resource vectorx0andy0as the functionings
achievement vector of individual 0. X1
, ..., Xm are the m random variables drawn from the
conditional distribution function of X given Y ≥ y0. θ˜m(x0, y0) then measures the distance
between pointx0and the order-mfrontier ofX 1
, ..., Xm. It can be written as:
˜
θm(x0, y0) = min
i=1,...,m
max j,...,p(
Xi,j xi0 )
(3)
withXi,j(xj
0)being thejth component ofXi (ofx0 respectively). This frontier represents the
expected minimum achievable input-level amongmindividuals drawn randomly (with replace-ment) from the population which show at least the functionings achievement level of unit 0.
here, an output-oriented framework seems to be appropriate as it is the aim of the analysis to identify obstacles that hinder people to achieve ‘maximal’ functionings achievement, i.e. it is evaluated whether they show less functioning achievement than what can be expected given their resource endowment.
8
The order-m efficiency measure of individual(x0, y0)is defined as
θm(x0, y0) = E[˜θm(x0, y0)|Y ≥yo] . (4)
Cazals et al. (2002) show that this order-m efficiency measure is less sensitive to outliers and statistical noise in the data because the (partial) order-mfrontier is not enveloping all observa-tions.9
As pointed out before, the efficiency scores measure the distance of an individual to the
efficiency frontier. In contrast to the traditional FDH approach, the order-m Farrell efficiency scores can take values smaller than one and hence, they can range from > 0 to+ inf. Values smaller or equal to one indicate efficiency, while values larger than one represent inefficiency.
Since individuals with similar resource endowments but different levels of functionings
achievement are compared in this procedure, the effect of the variance in the resource
en-dowments is excluded from the resulting efficiency measure (which is the motivation for the
efficiency analysis in the first place).
But which factors effect an individuals’ efficiency to transform resources into functioning
achievement? This is subject to the second stage in which a number of factors are regressed
on the obtained efficiency scores. This is motivated by the fact that there are some factors that
are not under the control of an individual (for example, they might be set by the environment).
Such exogenously fixed factors may however have an influence on the individual’s ability to
transform his resources into achieved functionings (Beguin and Simar, 2004). For example
the previously mentioned obstacles fall into this category. In the second stage this influence is
thus tested with regression analysis on the previously estimated efficiency scores. Furthermore,
variables that cannot be a direct part of the efficiency analysis because of their dichotomous
nature (the order-m frontier analysis requires at least ordinal-scaled variables) are included in this stage as well.
To see whether the dichotomous variables influence our results, we incorporate them into the
second stage. In this second stage, we apply a standard OLS regression in which the
environ-mental factors are regressed on the order-mefficiency scores. This type of two-stage approach has been recently criticized by Simar and Wilson (2007). Regarding traditional robust
non-parametric frontier models (such as Data Envelopment Analysis (DEA) and Free Disposal Hull
(FDH) models), these authors argue that standard approaches to inference are invalid because
of boundary problems (the efficiency scores are always larger than or equal to one in these
ap-proaches and an output-orientation) as well as because of the serial correlation of the efficiency
scores. However, there are reasons for why this critique is less appropriate in our setting, i.e.
when using the order-mapproach. First, order-m efficiency scores can take on values smaller
9
than one and hence the boundary problem is of smaller relevance. Second, the serial
correla-tion of the order-m efficiency scores is likely to be less strong because of its being a partial frontier approach. Third, in contrast to DEA or FDH models, the rate of convergence of the
order-mefficiency corresponds to that of standard parametric models, namelyn−12 (Wheelock
and Wilson, 2003). Hence, a standard OLS approach seems to be an appropriate choice.
5
Data and Findings
5.1
Data Set
The British Household Panel Survey (BHPS) is a longitudinal survey of private households in
Great Britain, undertaken by the ESRC UK Longitudinal Studies Centre with the Institute for
Social and Economic Research at the University of Essex, UK (BHPS, 2007). Its aim is to
track social and economic change in a representative sample of the British population (for the
following and more information on the data set, cf. Taylor, 2007, sections A2 & A4). The
BHPS started as a nationally representative sample of 5,000 households, where adults (being of
age sixteen and over) were interviewed and tracked over the years. The sample comprises of
about 15,000 individual interviews. Starting in 1991, up to now, there have been 15 waves of
data collected.
The first wave was created with a two-stage clustered probability design and systematic
sampling. Sample units were selected with the small users Postcode Address File (PAF). 250
postcode sectors were first selected as Primary Sampling Units (PSU). These were stratified
by region and socio-demographic variables derived from the 1981 census. In stage two of the
process, addresses were selected in a similar fashion.
The aim of all further waves was to track the individuals of the first wave over time. The
BHPS data contains information on various areas of the respondents lives, ranging from income
to jobs, household consumption, education, health, but also social and political values.
5.2
Indicator Selection and Descriptive Statistics
To construct a basket of ‘basic functionings’ we choose different indicators for the three
func-tionings ‘being happy’, ‘being educated’ and ‘being healthy’. We conceive of the individual as
a locus of production where inputs factors are converted into output. In this case, the input is
represented by an individual’s income. We take income to be the proxy for the commodity
vec-tor in Sen’s framework (see section 2). Subject to the conversion function and given conversion
factors, an individual’s resources are assumed to be transformed into achieved functioning in
the three dimensions named above.
As in production analysis, two different kinds of variables can influence the output (Banker
Characteristic of the input factors is that they are sufficiently under an individual’s control. In
the case of income, the individual can choose how to transform it into output (we assume that
this is on average the case to a sufficient degree). Other exogenous factors are not sufficiently
under control of the individual. These are the conversion factors some of which are used in the
second stage of our approach.
Income, adjusted (GBP) Min Max Mean SD
.2 504,991.90 12,005.45 10,098.08
Well-Being (GHQ-12) Min Max Mean SD
1 37 25.72 5.49
Health Status last 12 months absolute % Mean SD
3.83 0.92
very poor 252 1.83
poor 954 6.93
fair 2,834 20.58
good 6,578 47.76
excellent 3,155 22.91
Highest Academic Qualification absolute % Mean SD
3.19 1.76
none of these 3,834 27.84
cse 686 4.98
o level 3,576 25.96
a level 2,734 19.85
hnd,hnc,teaching 962 6.98
1st degree 1,569 11.39
[image:14.595.122.478.173.439.2]higher degree 412 2.99
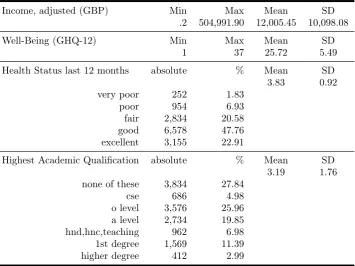
Table 1: Descriptive Statistics - Input & Output Indicators
Let us now discuss the proxies we choose to measure inputs, outputs and conversion factors.
Table 1 gives an overview of the input income and our three outputs and the proxies we use
to measure them. We are using the most recent wave of the BHPS for the year 2006. As
of now, we just consider this year and do not use the BHPS as a panel to examine trends in
the development of our measure. The sample size is 13,773 individuals. This includes all
individuals of the BHPS that report a positive (however small) income (after transformation,
see below). Individuals without household-income have been dropped from the sample. The
same applies to individuals who have not reported on one or more of the indicator variables we
use in our analysis. This means we had to discard 11.86% of the data of the original sample
(15,627 observations).
While the mean gross income of our sample in 2006 is 15,240.1 GBP (standard deviation
of 17,056.65 GBP), we think that some correction is appropriate here. The sample contains
individuals who report very small incomes but who cannot be considered poor. Under these
category fall spouses who do not work, adolescent children living with their parents etc. The
commodity vector which is at their disposal is thus poorly reflected in their reported income as
members and divided them by the number of household members. While this still neglects
the insights drawn from the literature of equivalence scales (cf. Kuklys, 2005, ch.5), we feel
that our indicator is thus less distorted than it were if we were just taking the reported income.
Mean income per person of a household is according to our calculation 12,005.45 GBP (s.d.
10,098.08 GBP).
Concerning our first functioning achievement ‘being happy’ we have chosen the individual’s
assessment of mental well-being as a proxy. It is an index from the widely used ‘General Health
Questionnaire’ of the BHPS, composed of the answers to 12 questions that assess happiness,
mental distress and well-being. This subjective assessment is measured on a Likert scale from
0 to 36, which we have recoded to values of one (lowest well-being) to 37 (highest scores in
mental well-being). Mean well-being is 25.72 (s.d. 5.49). This proxy is widely used in the
psychological literature (for more details on this indicator cf. e.g. Gardner and Oswald, 2001;
Clark and Oswald, 2002).
To measure functioning achievement ‘being healthy’ we have chosen to use an
individ-ual’s subjective assessment of health (during the last 12 months). This is ordinally scaled on
a five point Likert scale, ranging from ‘excellent’ (five) to ‘very poor’ (one).10 Mean health is
3.83 (s.d. 0.92). Note that subjective assessments of health seem to predict objective health
quite well in some cases (e.g. regarding morbidity). Whether objective health is sufficiently
well-reported by subjective health assessments is still debated (cf. Johnston et al., 2007).
Nev-ertheless, although a more detailed indicator set would certainly be welcome, we think that for
our expositional measurement exercise, this single indicator will do.
Achieved functioning ‘being educated’ is measured by an individual’s highest level of
ed-ucation. Again, this measured ordinally, ranging from one (‘none of these’) to seven (‘higher
degree’), giving intermediate values to the middle education levels.11 The summary statistics of
our output variables are depicted in table 1. Note that all three output variables are correlated
with our input measure of per-person income to varying degrees. Our indicator ‘being happy’
is correlated with income at r = 0.0810, income and health are correlated at r = 0.1201 and income and education atr = 0.3039(all Spearman rank correlations). Measures of well-being are generally very low correlated with income in intra-country cross-sections (Bechtel, 2007).
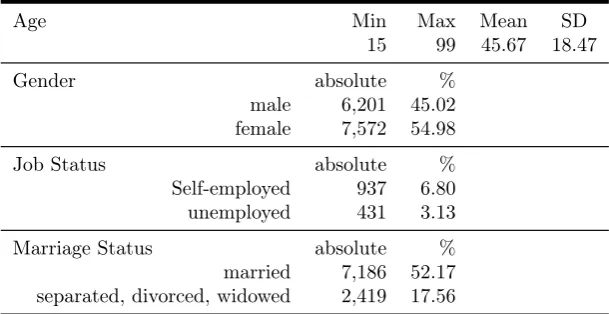
The last category of variables concerns the conversion factors. As has been said, these are
variables we include in the second stage of the analysis. We have decided to use gender, age
as well as some dummies regarding job status and individual marriage status as a selection of
some of the most important individual factor influencing achieved functioning. These factors
and their descriptive statistics are summed up in table 2.
10
As in the case of well-being, we had to reverse the numerical order of the Likert scale for technical reasons. The original coding in the BHPS codes a value of one to be excellent health and five to be very poor health. For our efficiency analysis we have to use high values in the output indicators to denote high achievement in this indicator.
11
Age Min Max Mean SD
15 99 45.67 18.47
Gender absolute %
male 6,201 45.02
female 7,572 54.98
Job Status absolute %
Self-employed 937 6.80
unemployed 431 3.13
Marriage Status absolute %
married 7,186 52.17
[image:16.595.145.450.71.228.2]separated, divorced, widowed 2,419 17.56
Table 2: Descriptive Statistics - Control Variables
Of our sample, 54.98% (7,572 individuals) were female. Mean age is 45.67 years (s.d.
18.47) with maximum age at 99 years and mimimum age at 15 (younger individuals were not
interviewed in the BHPS). We decided to include dummies for being married (52.17%) and for
being widowed or separated or divorced (17.56%) as special relationship conversion factors, the
former being a positive conversion factor, the latter a negative one. Regarding work status, we
have included dummy variables for being self-employed and being unemployed. Of the sample
6.80% fell into the category self-employed and 3.13% were unemployed.
Of course, one could include even more personal characteristics in the second stage of our
approach. To illustrate the core idea, however, we deem these variables to be sufficient and
capturing some of the most important conversion factors. Note however a certain circularity
in-herent in Sen’s framework because an individual’s health could also influence the conversion of
resources into achieved functioning (in general, parts of the output also influence the conversion
and vice versa).
5.3
Findings and Discussion
The first impression on the results is that there exists a comparatively large number of
individu-als which transform their resources efficiently into functioning achievement: 3,218individuals are found to be efficient in their conversion. In relation to the13,773valid observations, this is
23.36percent. Of interest is also the mean of the inefficient observations which is about 1.33. This indicates two things: First there is quite a number of individuals showing inefficiency in
Great Britain. 76.64 percent of the individuals in the sample are not able to transform their resources into functioning achievement as efficiently as the best 23.36 percent. Second, the mean of1.33shows that the average ‘inefficient’ individual achieves about33%less function-ing achievement than an ‘efficient’ individual with the same resources. Note that these values
Histogram of efficiency scores
Order−m efficiency scores
Frequency
0.5 1.0 1.5 2.0 2.5 3.0
0
1000
2000
3000
4000
[image:17.595.333.510.93.224.2]5000
Figure 1: Histogram of Efficiency Scores This histogram of the efficiency scores (Fig. 1)
reveals that the largest group of inefficient
individu-als has an efficiency score between1.2and1.4, i.e. a score close to the mean. While we observe a long
‘tail’ of efficiency scores larger than1.8these rep-resent only about3percent of the individuals in the
sample. Hence, the degree of inefficiency here is
rather small.
As we have described above, obstacles in
the conversion of a given commodity vector into
achieved functioning can be caused by personal,
en-vironmental or social factors. These conversion
fac-tors determine why one individual achieves higher functioning output than someone else with
the same commodities (or why someone achieves a similar output with lower resources). These
inefficiencies can be caused by a wide range number of other factors not included into the
analysis. As pointed out before, we employ an ordinary-least-square regression to evaluate the
effect of five factors that are most commonly said to influence an individual’s ability to convert
resources into achieved functionings. Note that a high efficiency score indicates inefficiency
while a score close or equal to one implies efficiency in the conversion.
Coefficients: Estimate Std. Error t value Pr(>|t|) Sig.
(Intercept) 1.1397390 0.0069531 163.919 < 2e-16 ***
age 0.0027927 0.0001655 16.873 < 2e-16 ***
d_male -0.0438853 0.0049534 -8.860 < 2e-16 ***
d_selfempl. -0.0624656 0.0097234 -6.424 1.37e-10 ***
d_unemployed 0.1109389 0.0140097 7.919 2.58e-15 ***
d_married -0.0171725 0.0065846 -2.608 0.00912 **
d_sepdivwid 0.0456222 0.0088151 5.175 2.31e-07 ***
Signif. codes: 0 (***) 0.001 (**) 0.01 (*) 0.05 (.) 0.1 ( ) 1
Residual standard error: 0.283 on 13766 degrees of freedom Multiple R-Squared: 0.05554, Adjusted R-squared: 0.05513 F-statistic: 134.9 on 6 and 13766 DF, p-value: < 2.2e-16
Table 3: Second-stage Regression Results
Table 3 shows the second-stage regression results for age, sex (d_male), being
self-employment (d_selfempl.), being unself-employment (d_unemployed), being married (d_married),
and being separated, divorced or widowed (d_sepdivwid).12
The ‘d_’ indicates the variable
being constructed as a dummy with the value 1 for ‘yes’ and 0 for ‘no’.
With the exception of marriage status, we find a highly significant relationship with the
order-m efficiency scores for all variables. In detail, we find that being female, young,
self-12
employed, not being unemployed, and not being separated, divorced or widowed increases the
conversion efficiency.
These findings support several well-known results from the literature. For example, it seems
reasonable that individuals who are unemployed would be less efficient in the conversion of their
income into achieved functioning than those with a similar income who are employed or even
self-employed. Being self-employed on the other hand has a positive impact on the conversion
of income into achieved functioning. Self-employed persons usually are reported to be happier
(Benz and Frey, 2004). Our findings show in a complementary fashion that from two individuals
with the same resources, the one being self-employed is more efficient in the conversion of his
resources into achieved functioning.
Similarly straightforward is the case of the positive coefficient for d_sepdivwid. The
neg-ative experiences of being separated, divorced, or widowed is likely to be an obstacle in the
conversion of the given commodities into achieved functioning.
In the literature, one can find also that elder people score lower in the achievement of
ab-solute functionings (Chiappero Martinetti, 2000). Our results add that being older also means
being less efficient in the conversion of resources into functionings achievement.
A last (and perhaps more puzzling) result regards gender. While it is usually reported that
female individuals score lower in functionings achievements (Sen, 1985a; Chiappero Martinetti,
2000), we find that being female nevertheless increases the efficiency in transforming one’s
sources into this achievement. One could argue that while women are still disadvantaged as
re-gards absolute levels of functionings achievement, they have learned to more efficiently convert
their resources into functioning achievement. Given lower absolute functioning achievement,
this explanation seems more likely than arguing that women face less institutional barriers that
hamper their conversion of resources into achieved functioning. This example is an instance
that illuminates the complementary nature of the method presented here: Using several
dimen-sions of available welfare information gives a more complete picture of the individuals’ welfare
and helps evaluating the results.
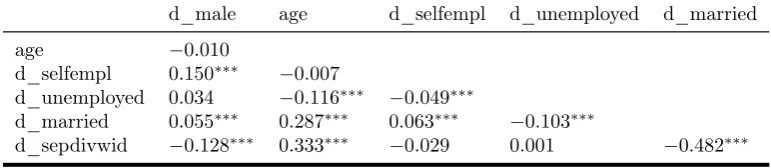
Note also the correlation between the variables, see table 4. For example, not surprisingly
d_married and d_sepdivwid are strongly negatively correlated (r =−0.482∗∗∗). Similarly age
and married status are positively correlated. Hence, the low significance of d_married in the
regression is likely a result of parts of its influence being accounted for by these two variables.
d_male age d_selfempl d_unemployed d_married
age −0.010
d_selfempl 0.150∗∗∗ −0.007
d_unemployed 0.034 −0.116∗∗∗ −0.049∗∗∗
d_married 0.055∗∗∗ 0.287∗∗∗ 0.063∗∗∗ −0.103∗∗∗
[image:18.595.101.487.656.740.2]d_sepdivwid −0.128∗∗∗ 0.333∗∗∗ −0.029 0.001 −0.482∗∗∗
Summarizing, we find that the analysis confirms and complements some findings in the
literature on absolute functionings achievement. Moreover, the analysis adds to a better
un-derstanding of the relation between individuals’ resource endowment and their achieved
func-tionings. We find that the conversion efficiency is positively affected by being female, young,
self-employed, not unemployed and not being separated, divorced or widowed (our findings for
being married were not significant). With the second-stage regression we have shown that the
obtained efficiency scores are related to the existence of obstacles, e.g. institutional setups, that
influence individuals’ abilities to achieve valuable functionings given their resources.
As for most empirical studies, more and better data could improve the reliability of the
findings. Having discussed our findings, we want to address one last concern regarding the
empirical measurement exercise conducted here. Critics could argue that if all relevant
con-version constraints were included as controls (or as relevant inputs) in our measurement, no
inefficiencies should be found. This is true. However, if the policy maker would know all
rel-evant constraints, he could focus on abolishing these which disadvantage some subgroups in
the functioning achievement. Since knowledge is not perfect, no policy maker can ever hope
to attain this information. By excluding some of the known constraints (especially these which
cannot be changed), we thus isolate in our analysis a set of unknown factors that lead to the
observed inefficiencies. Beside the information discussed in this section, it is of course
desir-able to understand our analysis only as a first step in identifying these unknown constraints.
This however has to be accomplished in a qualitative analysis which could be used to single
out different possible constraints. These could then be included in a second analysis of the type
conducted in this paper and the analyst could thus assess whether inclusion of the factor
iden-tified would lead to a more favorable distribution of conversion efficiency scores (by which we
mean higher numbers of efficient individuals and/or lower means of the inefficient individuals).
We consider such an analysis to be the next step in future research in this direction. Another
direction to extend this line of research would consist in building a more comprehensive basket
of basic functionings and choose more carefully (than in this exemplification) the proxies for
the measurement exercise. And as has been alluded to, cross-country comparisons as well as
the dynamic development of conversion efficiency also provide interesting research
possibili-ties. In the case of cross-country comparisons, a key advantage of our method lies in its being
independent of absolute values, units and price. That makes it well suited for comparisons of
international conversion efficiency scores.
6
Conclusion
In the capability literature, studies on the empirical measurement in the functionings space
are abundant and a few studies even measure capability to function. We have argued that the
com-plemented by a measure more familiar to most economists, namely the efficiency with which
individual resources are transformed into achieved functioning. We have called this measure
‘conversion efficiency’. We have used a nonparametric efficiency procedure and constructed
such a measure for a basket of basic functioning achievement (comprising of the functionings
‘being happy’, ‘being healthy’ and ‘being educated’), using data from the British Household
Panel Survey (BHPS). The order-m efficiency method we have suggested allows us to compute
for a given sample of individuals an efficient frontier on which are these individuals who are
most efficient in transforming their resources into achieved functioning. The distribution of
efficiency scores relative to that frontier allows some additional insights regarding the
assess-ment of welfare in capability space. Based on the idea that inefficiencies are undesirable also
in capability based welfare assessments, we argue that a measure of ‘conversion efficiency’
re-flects diverse welfare-reducing institutional constraints on the individuals. We have found out
that in our sample around 23% of the individuals can be considered efficient while the mean
of the inefficient individuals reaches one third less functioning achievement with a similar
in-come as the efficient individuals. Moreover, the analysis adds to a better understanding of the
relation between individuals’ resource endowment and achieved functionings. We found out
that the conversion efficiency is positively affected by being female, young, not unemployed,
self-employed and not being separated, divorced or widowed. A next step would be to extend
References
Anand, P. and Hees, M. v. (2006). Capabilities And Achievements: An Empirical Study. Jour-nal of Socio-Economics, 35:268–284.
Banker, R. D. and Morey, R. C. (1986). Efficiency Analysis for Exogenously Fixed Inputs and Outputs. Operations Research, 34(4):513–521.
Bechtel, T. G. (2007). The Pursuit of Happiness. Survey Research Methods, 1(2):109–120.
Beguin, C. and Simar, L. (2004). Analysis of the Expenses Linked to Hospital Stays: How to Detect Outliers. Health Care Management Science, 7:89–96.
Benz, M. and Frey, B. S. (2004). Being Independent Raises Happiness at Work. Swedish Economic Policy Review, 12:95–134.
BHPS (2007). British Household Panel Survey. http://www.iser.essex.ac.uk/ulsc/bhps/.
Bonaccorsi, A., Daraio, C., and Simar, L. (2005). Advanced Indicators of Productivity of Uni-versites. An Application of Robust Nonparametric Methods to Italian Data. Scientometrics, 66(2):389–410.
Cazals, C., Florens, J.-P., and Simar, L. (2002). Nonparametric Frontier Estimation: A Robust Approach. Journal of Econometrics, 106(1):1–25.
Chiappero Martinetti, E. (2000). A Multi-dimensional Assessment of Well-being Based on Sen’s Functioning Theory. Rivista Internationale di Scienzie Sociali, 108(2):207–231.
Clark, A. E. and Oswald, A. J. (2002). A Simple Statistical Method for Measuring How Life Events Affect Happiness. International Journal of Epidemiology, 31:1139–1144.
Cooper, W. W., Seiford, L. M., and Zhu, J. (2004). Data Envelopment Analysis: History, Models and Interpretations. InHandbook on Data Envelopment Analysis. Kluwer Academic Publishers, Boston.
Daraio, C. and Simar, L. (2007). Advanced Robust and Nonparametric Methods in Efficiency Analysis - Methodology and Applications. Kluwer Academic Publishers, Boston / Dordrecht / London.
Deprins, D., Simar, L., and Tulkens, H. (1984). Measuring Labor Efficiency in Post Offices. In Marchand, M., Pestieau, P., and Tulkens, H., editors,The Performance of Public Enterprises: Concepts and Measurements, pages 345–367. Elsevier.
Farina, F., Peluso, E., and Savaglio, E. (2004). Ranking Opportunity Sets in the Space of Functionings. Journal of Economic Inequality, 2:105–116.
Gardner, J. and Oswald, A. (2001). Does Money Buy Happiness? A Longitudinal Study Using Data on Windfalls. Discussion Paper.
Kuklys, W. (2005). Amartya Sen’s Capability Approach - Theoretical Insights and Empirical Applications. Springer, Berlin et al.
Lancaster, K. (1966). A New Approach to Consumer Theory. Journal of Political Economy, 74(2):132–157.
Michael, R. T. and Becker, G. S. (1973). On the New Theory of Consumer Behavior. The Swedish Journal of Economics, 75(4):378–396.
Nussbaum, M. (2000). Women And Human Development. Cambridge University Press, Cam-bridge.
Ravallion, M. (2005). On Measuring Aggregate “Social Efficiency”. Economic Development and Cultural Change, 53(2):273–292.
Sen, A. (1984). Rights And Capabilities. InResources, Values and Development, pages 307– 324. Harvard University Press, Cambridge/Mass.
Sen, A. (1985a). Commodities and Capabilities. North-Holland, Amsterdam.
Sen, A. (1985b). Well-Being, Agency and Freedom: The Dewey Lectures 1984. The Journal of Philosophy, 82(4):169–221.
Sen, A. (1992). Inequality Reexamined. Clarendon Press, Oxford.
Sen, A. (1993). Capability and Well-Being. In Nussbaum, M. and Sen, A., editors,The Quality of Life, pages 30–53. Clarendon Press, Oxford.
Simar, L. (2003). Detecting Outliers in Frontier Models: A Simple Approach. Journal of Productivity Analysis, 20:391–424.
Simar, L. and Wilson, P. W. (2007). Estimation and Inference in Two-Stage Semi-Parametric Models of Production Processes. Journal of Econometrics, 136:31–64.
Sugden, R. (1993). Welfare, Resources, and Capabilities: A Review of Inequality Reexamined by Amartya Sen. Journal of Economic Literature, 31(4):1947–1962.
Taylor, M. F. E. (2007). British Household Panel Survey User Manual Volume A: Introduction, Technical Report and Appendices. edited with John Brice, Nick Buck and Elaine Prentice-Lane. Colchester: University of Essex.
Thomson, G. (1987). Needs. Routledge & Kegan Paul, London.
Wheelock, D. C. and Wilson, P. W. (2003). Robust Nonparametric Estimation of Efficiency and Technical Change in U.S. Commercial Banking. The Federal Reserve Bank of St. Louis Working Paper Series, 37A:1–34.
Wilson, P. W. (1993). Detecting Outliers in Deterministic Nonparametric Frontier Models with Multiple Outputs. Journal of Business & Economic Statistics, 11(3):319–323.