Modelling User Navigation
CORINA SAS
1, RONAN REILLY
2, GREGORY O’HARE
1,
IOANA MARIAN
1and ELENI MANGINA
11
Computer Science Department
2Computer Science Department
University College Dublin
National University of Ireland
Belfield, Dublin 4
Maynooth, Co. Kildare
IRELAND IRELAND
{corina.sas, gregory.ohare, ioana.marian,
eleni.mangina}@ucd.ie
[email protected]
Abstract: This paper proposes the use of neural networks as a tool for studying navigation within virtual worlds. Results indicate that the network learned to predict the next step for a given trajectory. The analysis of hidden layer shows that the network was able to differentiate between two groups of users identified on the basis of their performance for a spatial task. Time series analysis of hidden node activation values and input vectors suggested that certain hidden units become specialised for place and heading, respectively. The benefits of this approach and the possibility of extending the methodology to the study of navigation in Human Computer Interaction applications are discussed.
Key Words: neural network, spatial cognition, virtual environment
1 Introduction
This study presents the preliminary results of a connectionist model of human navigation
within a Virtual Environment (VE). The
purpose of this work is to extract a spatial grammar underlying spatial knowledge acquisition.
Environmental psychology provides an empirical basis for a better understanding of how humans perceive and understand the
space.
The work described here confirms the idea that acquiring an internal representation of the environment is a very complex process involving primarily landmark identification and understanding of spatial layout configuration. These two basic procedures are
well known as route-based knowledge and
survey knowledge [8]. Without underestimating the role of traditional methods, we propose the use of neural networks as an alternative tool for studying navigation within virtual worlds.
Neural networks have proven particularly suited to finding patterns in large amounts of complicated and imprecise data, and detecting trends that are too complex to be noticed by humans [2]. While neural networks have been fruitfully exploited by artificial intelligence
researchers, their adoption within HCI has been limited. They have been primarily applied to pattern recognition [16]. Finlay identified four areas of HCI, which involve pattern recognition problems, such as task analysis and task evaluation, natural interaction methods such as gesture, speech, handwriting, and adaptive interfaces [5].
Neural networks provide a very powerful toolbox for modelling complex high-dimensional non-linear processes [13]. ANNs have many advantages over the traditional representational models. In particular, the distributed representations they employ make them amenable to parallel processing, robust to noise, and give them a certain degree of biological plausibility [10]. We consider that at least part of these strengths can be harnessed to model user’s behaviour in terms of spatial knowledge acquisition.
This research is part of an ongoing program applying neural networks in modelling user’s spatial behaviour within VEs.
2 Navigation within VEs
Virtual environments (VE) have become a rich and fertile arena for investigating spatial knowledge. Within the VE, the user’s set of
navigation, locomotion, object selection, manipulation, modification and query [6]. As Sayers (2000) observed navigation has been found to be central to the usability of interfaces to VEs on desktop systems [25]. VEs offer the context for training and exploration, enabling the replacement of training and exploration within the physical world. This proves partially attractive when experiencing the real world is expensive, dangerous or hard to be achieved [3].
Evidence of significant similarities in the acquisition of spatial knowledge from real and virtual environments has been identified [11]. A further advantage consists of their powerful tractable characteristic [1], which enables accurate spatio-temporal recording of users’ trajectory within the virtual space. Attempts to understand spatial behaviour in both real and artificial worlds were primarily concerned with highlighting the symbolic representation of spatial knowledge.
2.1 Symbolic Models of Navigation
The study of navigation in the area of HCI has developed mostly in the field of cognitive modelling, benefiting from inputs provided by both environmental psychology and geography [14]. Several models where described by Kuipers [12] and Darken [3]. Modelling of spatial knowledge has constituted a central research theme for the last four decades. Golledge elegantly presented different models of declarative knowledge acquisition, together with their relevant applications in the area of spatial cognition [7]. Kuipers developed several computational models for navigation, underlying the procedural knowledge embedded in the spatial representations [12]. The basic idea resides in the individuals’ set of interactions with the environment, which facilitates a structured storage of perceptual experiences. These memorized experiences would enable users to build a more generalized structure for exhibiting an emergent spatial behaviour unperformed before [7].2.2 Connectionist Models of Navigation
Previous studies have shown that recurrent neural network can predict both circular and figure eight trajectories [4],[9],[18],[21],[26]. However, due to the fact that the figure eight trajectory crosses itself, the training was moredifficult for this type of trajectory. In our case, the trajectories covered by users are more complex than a circle or figure eight, even though some of them resemble a circular shape.
3 Methodology
Research in the area of navigation within VEs has been generally focused on large-scale virtual worlds [3]. In this study we utilized
ECHOES1 [16], as an experimental test-bed. It
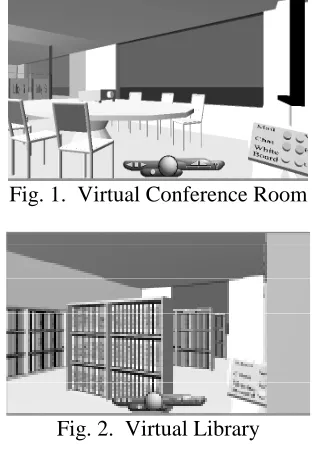
is a virtual reality system, which offers a small-scale world, dense, static and with a consistent structure. Adopting a physical world metaphor, the ECHOES environment comprises a virtual multi-story building, each one of the levels containing several rooms: conference room (Fig.1), library (Fig.2), lobby etc.
[image:2.595.346.502.342.573.2]Fig. 1. Virtual Conference Room
Fig. 2. Virtual Library
The present study captures the spatial behaviour of users exploring an unfamiliar VE. Users can navigate from level to level using a virtual elevator. The rooms are furnished and associated with each room are a set of user functions.
A sample of 30 postgraduates in the Computer Science Department of University College Dublin was asked to perform two
tasks within the virtual world, namely exploration and searching. In order to gain familiarity with the environment and learn movement control, the subjects were asked to look for a particular object within the virtual building for about 20 minutes. This exploratory task provided the primary data for the neural network approach. Furthermore, subjects were asked to find a particular room in the virtual building, namely the library. We considered the time and length of trajectory
involved in this search task as performance
indicators. Based on these, we identified the quality of spatial knowledge acquisition and the efficiency of the exploratory strategy.
A comprehensive set of data consisting of users’ positions was recorded throughout the experiment. Each movement greater than half
a virtual meter, and each turn greater than 30o
were recorded.
We present a connectionist simulation to
test whether a network can build a cognitive
map as an internal representation of
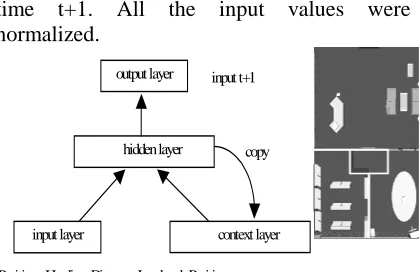
environmental information [8] in terms of both landmarks and configuration of the spatial layout. The basic idea is that an input vector consisting of current Cartesian coordinates together with information about the nearest landmark is sufficient to induce the network to form internal abstractions to predict the next position. To test our hypothesis, an Elman-style simple recurrent neural network was used to learn the trajectory and to predict the next step. The implementation was carried out by using Stuttgart Neural Network Simulator (SNNS). The network architecture [4] is presented in Figure 3 and consists of 6 input nodes, 12 hidden nodes, 12 context nodes and 6 output nodes.
The network input consists of a sequence of users’ trajectories. At each time step t, an input vector is presented consisting of user’s position, orientation angle, distance to the nearest landmark (the distance to the nearest point of the landmark) and its associated position (coordinates of the centre of the landmark). For this simulation we considered only the trajectories performed on the ground floor of virtual building. Figure 4 presents an overhead image of this level. After each trajectory was entered, an input representing “reset” is presented, for which the network is supposed to zero out the outputs [15]. The output pattern represents the input vector of
time t+1. All the input values were normalized.
copy
input layer context layer hidden layer
output layer
[image:3.595.318.528.74.210.2]Position , Heading, Distance, Landmark Position input t+1
Fig. 3 Network Architecture Fig. 4 Ground Floor
Using the backpropagation learning procedure [4] the network was taught to predict for each current position the next position in time.
At this stage of our work, we expanded the notion of landmark to any feature added to spatial layout. Therefore, apart from any piece of furniture, we considered also the choice points such as doors and lift entrance. Identifying which ones, among these features, prove to be salient and able to capture attention – being thus an authentic landmark – is a task to be solved by the network.
We divided randomly the entire set of data into five parts, using three of them for training, one for validation and one for testing. The network was trained for 1000 epochs, with 24 trajectories composed of 4668 input vectors.
Two groups of users were identified on the basis of their performance for search task. Good users (top 20%) and Poor user (bottom 20%). Trajectories followed by these users constituted our testing set, comprising 12 trajectories of 1573 input vectors. The average trajectory length was 160 vectors. The learning rate was 0.001, the initial weights set within a range of 0.5 and the momentum was 0.
4 Results
4.1 Network Performances
vector to: 1 virtual meter for the x, y coordinates, 30 degrees for rotation and 2.5 virtual meter for distance estimation.
A more conservative performance criterion was defined, which considers that an error occurs when at least one of the elements of the vector is above the threshold.
In Table 1 we present the results of testing the network, obtained by computing the Euclidean distance between the output vector predicted by the network and the expected output vector.
Input description Percent
Correct
User’s next position – X coord. 97.13%
User’s next position – Y coord. 92.30%
User’s next orientation - heading 86.90%
Distance to next nearest landmark 99.87%
Nearest landmark pos. – X coord. 90.27%
Nearest landmark pos. – Y coord. 86.77%
Table 1 Prediction accuracy of each input element based on Euclidean distance
As can be seen, the network generalizes well for all the input elements. However, for a prediction to be correct all the input elements should simultaneously be within specified limits. With respect to the composite criterion of accuracy, the network still performs adequately, the success rate being 67.57% [23],[24].
Knowledge embedded into a trained NN is stored in its weights and hidden nodes [19]. One way to study this, and a first step in the rule extraction process, is to perform a cluster analysis of hidden nodes activation values.
4.2 Analysis of Hidden Layer
The prediction performance obtained by the RNN support the idea that it successfully learnt the regularities underlying the training data. Understanding what the network learnt can be achieved by analysing the internal representation acquired by the network. A straightforward way of doing this is by cluster analysis of the hidden node activations [15]. Therefore, the hidden node activation values were recorded after each testing input vector has been presented to the network. K-Means clustering analysis performed on these values revealed two clusters [20].
A cluster membership was assigned to each vector and a series of statistical tests were performed in order to associate meaning to the clusters. Firstly we looked at the errors within each clusters.
Within cluster 1 there are significantly more correct predictions than in cluster 2: 56.7%
versus 43.3%, χ(1) = 32.44, p < 0.001. If the
number of errors differs between the two clusters, we conjectured that the clusters should be related to the user’s performance. There are indeed significantly more Good users in cluster 1 than in cluster 2: 58.2%
versus 41.8%, χ(1) = 29.85, p < 0.001.
The percentage of errors within each cluster was further analysed on the basis of the error associate with each element from the vector. The errors were considered as being related to translation, rotation or landmark prediction.
We found no significant difference with respect to the number of errors within each cluster, when errors were generated by wrong prediction of user’s coordinates (x, y) or for the x coordinate of the centre of the landmark. The difference in number of errors was related to the inaccurate prediction of the y coordinate
of the centre of the landmark (χ(1) = 39.10, p
< 0.001) and of rotation angle (χ(1) = 11.24, p
< 0.01). Significantly more of these errors had occurred within cluster 2.
We tried to identify what type of events characterizes the clusters and whether there is difference between them on this respect. Cluster 1 groups hidden neurons significantly more respondent to the input vectors representing Rotations and Landmarks than
Translations, χ(2) = 10.83, p< 0.01.
The analysis of internal representation acquired by the NN performed through cluster analysis of hidden nodes has limitations. It does not take into account the temporal dimension and it is not performed in the context of input and output vectors, of which the hidden nodes are intrinsically related. These limitations suggest that apart of clustering analysis one should employ other techniques to grasp the temporal dynamic and also to broaden the context of analysis.
hidden nodes activation values represent a time series as well.
4.3 Hidden Nodes Specialisation
The simplest analysis of the relationship between two time series is the lagged correlation, performed after removing any serial dependency within them [27]. The cross-correlations coefficients have been computed at lag 30, between each element of the input vector and the hidden nodes activation values. The highest correlation and the associated lag was recorded. For each element of input vector the cross-correlation equal or higher than 0.70 has been retained and the associated hidden node was considered as specialised for that particular input element (firing for it).
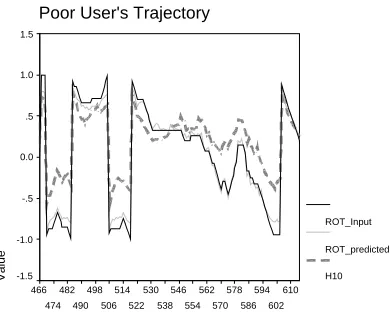
The Figure 5 shows one element of the input vector e.g. rotation, together with the associated hidden node (H10), which presents the highest activity values.
Good User's Trajectory
210 205 200 195 190 185 180 175 170 165 160 155 150 145 140 135 130 125
Va
lu
e
1.5
1.0
.5
0.0
-.5
-1.0
-1.5
ROT_Input
[image:5.595.86.281.572.728.2]ROT_predicted H10
Fig. 5a Examples of hidden nodes activity patterns together with the associated values for the input and predicted elements of the vectors.
Poor User's Trajectory
610 602 594 586 578 570 562 554 546 538 530 522 514 506 498 490 482 474 466
Va
lu
e
1.5
1.0
.5
0.0
-.5
-1.0
-1.5
ROT_Input ROT_predicted H10
Fig.5b
As one can see the activity pattern of the hidden nodes, in each case matches closely the one of the input elements for which it fires. The examples are associated with a trajectory performed by a poor user and a good user respectively.
For each input element, the specialised hidden neurons are as follows: x coordinate - H1, H5, H7, for y coordinate - H4, H8, H11, for rotation angle - H3, H10, H12, for distance to the nearest landmark – none, for landmark centre coordinate x - H5, H7 and for landmark centre coordinate y- H8. It is obvious that the subjects’ position and the landmarks’ position are represented by similar hidden neurons, though the former requests more hidden nodes. The rotation angle requires a completely different set of hidden nodes.
To conclude, the time series analysis consisting of lag correlation between input vectors and hidden nodes activation values revealed two groups of hidden neurons, which appear to be highly sensitive to the changes in input elements related to places and respectively to heading or orientation. In other words, the analysis of the representations in the hidden layer suggested that the distinct groups of hidden units become specialised for place and direction [17].
5 Conclusions
The results have been obtained through a neural network simulation of human navigation behaviour performed within a VE. The main purpose of the simulation consisted of motion prediction and accordingly understanding of such behaviours. The preliminary findings proved promising, indicating that the network not only learnt to predict the next step for a given trajectory, but the prediction is better for users performing better and therefore employing good navigational strategies. The network predicted correctly the next position together with its nearest landmark at a rate of 67.57%.
number of errors in prediction appearing in Cluster 2 are mainly due to the inaccurate prediction of the of rotation angle. The main conclusion is that NN encounters difficulties in learning the rotation behaviour of Poor users. Future work should be done in order to understand which aspects differentiate rotations performed by Good users, aspects whose regularity seems to be understood by the network.
This simulation has not been concerned with the biological plausibility of human navigation behaviour. However, a closer analysis of hidden nodes suggests a specialisation of hidden neurons, specialisation that resembles the neurons organisation within the hippocampus [17] [22]. The two groups of neurons whose firing patterns correlate dynamically with the elements of the input vector, could be associated with the place and heading cells respectively. This is an outcome which confirms the validity of our time series analysis as methodological approach.
Using neural networks as a tool in studying navigation can be beneficial for user modelling in the area of spatial knowledge acquisition. Permitting a comparative analysis between efficient and inefficient navigational strategies, this methodology could suggest how VEs might be better designed. Based on these results further work will be focused on assisting new users, to improve their spatial abilities in exploring a new virtual environment. By predicting the user’s following trajectory, pertinent advice could be provided to reduce its offset from the desirable “good” trajectory. Thereafter this guidance could improve user exploration. Alternatively, a real-time dynamic reconstruction of the VE could assist the users in their tasks.
References
[1] Amant, R.S. and Riedl, M.O. A practical perception substrate for cognitive
modeling in HCI. International Journal of
Human Computer Studies, 55, 1, 2001, 15-39
[2] Christos, S. What is a neural network?
Surprise 96 On-Line Journal, 1, 1996. [3] Darken, R.P. Wayfinding in Large-Scale
Virtual Worlds, in Proceedings of
SIGCHI `95, ACM Press, 45–46.
[4] Elman, J.L. Finding structure in time,
Cognitive Science, 14, 1990, 179–211.
[5] Finlay, J. and Beale, R. Pattern recognition and classification in dynamic and static user modelling, in Beale, R.
and Finlay, J. (eds.). Neural Networks
and Pattern Recognition in Human Computer Interaction. Ellis Horwood, 1992.
[6] Gabbard, J. and Hix, D. Taxonomy of
Usability Characteristics in Virtual Environments, Final Report to the Office of Naval Research, 1997.
[7] Golledge, G.R. Environmental cognition, in Stokols, D. and Altman, I. (eds.)
Handbook of Environmental Psychology,
vol. 1. John Wiley & Sons, Inc. New York, 1987, 131–175.
[8] Golledge, G.R. Human cognitive maps and wayfinding, in Golledge, G.R (ed.)
Wayfinding behaviour. John Hopkins University Press, Baltimore, 1-45.
[9] Hagner, D.G., Watta, P.B. and Hassoun, M.H. Comparison of Recurrent Neural Networks for Trajectory Generation, In
Recurrent Neural Networks: Design and Applications, L. Medsker and L. C. Jain (eds.), CRC Press, 1999.
[10] Haykin, S. Neural Networks: A
Comprehensive Foundation. Prentice-Hall, 1994.
[11] Jacobs, W.J., Thomas, K.G.F., Laurence, H.E., and Nadel, L. Place learning in
virtual space II. Learning and Motivation,
29, 1998, 288-308.
[12] Kuipers, B. Modeling spatial knowledge.
Cognitive Science, 2, 1978, 129–153. [13] Lint, H. van, S.P. Hoogendoorn, H.J. van
Zuylen. Freeway Travel Time Prediction with State-Space Neural Networks,
Preprint 02-2797 Annual Meeting of the
Transportation Research Board, Washington D.C., 2002.
[14] Lynch, K. Image of the city. The MIT
Press, Cambridge MA, 1960.
[15] Morris, W.C., Cottrell, G.W., Elman, J. A connectionist simulation of the empirical acquisition of grammatical relations, In
Wermter, S. and Sun, R. (eds.) Hybrid
Neural Symbolic Integration. Springer Verlag. 2000.
[16] O'Hare, G.M.P., Sewell, K., Murphy, A.J. and Delahunty, T. ECHOES: An Immersive Training Experience.
[17] O’Keefe, J., Nadel. L. (1978). The hippocampus as a cognitive map. Oxford: Clarendon Press.
[18] Pearlmutter, B. Learning state space trajectories in recurrent neural networks.
Neural Computation, 1(2): 263-269, 1989.
[19] Plunkett, K., and Elman, J.L. (1997)
Exercises in Rethinking Innateness. A handbook for connectionist simulations. MIT Press.
[20] Podolak, I.T. (1998). Functional Graph
Model of a Neural Network, IEEE
Trans. on Systems, Man, and Cybernetics, vol. 28, no. 6, pp. 876-881, [21] Psarrout, A, Gong, S., Buxton, H.
Modeling spatio-temporal trajectories and face signatures on partially recurrent
neural networks. Proc. IEEE
International Conference on Neural Networks, pp. 2226-2232, 1995.
[22] Redish, A.D. (1997). Beyond the
Cognitive Map: Contributions to a Computational Neuroscience Theory of Rodent Navigation, Ph.D. Thesis, Carnegie Mellon University.
[23] Sas, C., O’Hare, G.M.P. and Reilly, R. (2003). A connectionist model of
human navigation. Seventh International
Conference on Cognitive and Neural Systems. Boston University Press (in press)
[24] Sas, C., O’Hare, G.M.P. and Reilly, R. (2003). A connectionist model of spatial knowledge acquisition in a virtual environment. International Conference on User Modeling, Workshop on User Modeling, Information Retrieval and Machine Learning (in press).
[25] Sayers, H.M., Wilson, S., Myles, W., McNeill, M.D.J. Usable Interfaces for Virtual Environment Applications on
Non-Immerse Systems, Eurographics, 2000,
143-150.
[26] Sundareshan, M.K., Wong, Y.C. and Condarcure, T. Training algorithms for recurrent neural nets that eliminate the need for computation of error gradients with application to trajectory production
problem, In Recurrent Neural Networks:
Design and Applications, L. Medsker and L. Jain (eds.), CRC Press, 1999.
[27] Warner, R. Spectral analysis of