Munich Personal RePEc Archive
The Effect of Contractual Complexity on
Technology Sourcing Agreements
Hansen, Zeynep and Higgins, Matthew
Georgia Institute of Technology
17 September 2007
Online at
https://mpra.ub.uni-muenchen.de/4979/
The Effect of Contractual Complexity on Technology Sourcing Agreements*
Zeynep K. Hansen
College of Business and Economics, Boise State University 1910 University Drive
Boise, ID 83725-1620 208.426.3314
Matthew J. Higgins**
College of Management, Georgia Institute of Technology 800 West Peachtree Street
Atlanta, GA 30308 404.894.4368
13 September 2007
Abstract:
Most research on strategic alliances ignores the underlying contracts that govern the terms of the relationship. This is problematic since it is how these contracts are structured that determines how firms will benefit from a relationship. We present a novel method to analyze contractual complexity in a multi-dimensional framework in an attempt to link together the contractual complexity and control rights literatures. We find that the stage of development, age and prevalence of the underlying technology most influence complexity. Contractual complexity also influences the allocation of control rights. We also explore the importance of prior relationships on the underlying contract.
______________________________________________________________________________________
JEL Codes: G32, L22
Keywords: Contractual complexity; Control rights; Strategic alliances; Biopharmaceutical industry; Contractual design
*
We thank Steven Currall, Stuart Graham, Frank Rothaermel, Michael Stonebrook, Tunji Adegbesan, Carolin Hausseler, Jackson Nickerson, Jerry Thursby and Leslie Vincent-Harris for helpful comments and suggestions. We thank Mark Edwards at Recombinant Capital for graciously providing access to their data. Finally, we are indebted to Dr. Beau Hansen for helping in the classification of the alliance technologies. Higgins acknowledges research support from the John Imlay Jr. Professorship and the Georgia Tech Center for International Business Education and Research under a national center grant from the U.S. Department of Education. Hansen acknowledges research support from Washington University in St. Louis, Olin School of Business during summer of 2007. Part of this research was completed while Hansen was at the Olin School of Business, Washington University, St. Louis, MO. The usual disclaimer applies.
**
1.0 Introduction
There exists an extensive literature, spanning multiple disciplines, focusing on
strategic alliances. Researchers have explored, for example, why firms engage in
alliances; how partners are chosen; what types of alliances are entered; how alliance
portfolios are built; the impact on innovation and new product development; and whether
alliances create value for shareholders. Often overlooked, however, in these literatures
are the structure and influences of the underlying contracts that control these
relationships. By overlooking these contracts, the complexity of the agreement and as a
result, the complexity of the fundamental relationship is ignored. Furthermore, the
structure of these contracts dictates the allocation of control rights which affect a
multitude of items ranging from intellectual property rights to marketing, manufacturing
and distribution. Research suggests that it is how these control rights are allocated
determines how a firm will benefit from a research relationship (Adegbesan and Ricart,
2005).
Transaction Cost Economics (TCE) scholars argue that contracts will be more
“complex” as more contractual safeguards are written into them in order to mitigate
potential exchange hazards (Williamson, 1985, 1991). Likewise, when potential
exchange hazards are low complex contracts are not needed and simpler, more routine
ones are sufficient (Joskow, 1987). In addition to the complexity of the contract, the
underlying provisions that deal with the actual allocation of specific control rights are
also important since they determine how a firm benefits from the relationship. While
several papers have directly studied the allocation of control rights (Lerner et al, 2003;
Lerner and Merges, 1998; Elfenbein and Lerner, 2003; Lerner and Malmendier, 2004;
Higgins, 2007; Adegbesan and Higgins, 2007) we are not aware of any research that
explores the direct relationship between contractual complexity and the allocation of
control rights in technology sourcing agreements. We attempt to fill this important gap
by bridging together these two literatures through the analysis of strategic alliance
agreements between pharmaceutical and biotechnology firms.
We make several contributions to the literature. First, we extend the literature on
contractual complexity by modeling complexity in a multi-dimensional framework. This
an agreement. Functional scope provides us with a measure of the breadth of an alliance
while technological scope provides us with a measure of the depth of an alliance. We
measure functional scope based on specific contractual provisions, which is not
uncommon in the literature (e.g., Ryall and Sampson, 2006; Reuer and Arino, 2007).
However, in order to measure technological scope we explicitly control for and model the
underlying focal technology(s) in the alliance relationship.
Second, within our framework, we analyze the determinants that increase the
probability that an alliance agreement will be more complex. One of the most significant
factors that increase the complexity of an agreement is the phase of the focal product at
the time of signing. Alliances whose focal products are in later stages of development
tend to focus on one technology and this simplicity is reflected in the underlying contract
structure. Additionally, the age and prevalence of the focal technology are important.
The newest technologies and ones that are the least prevalent in the population of
alliances increase the probability of more complex agreements. New and less prevalent
technologies can be viewed as more risky and as a result more complex agreements are
written to protect the parties.
Third, we tie the contractual complexity literature to the control rights literature
by analyzing the relationship between contract structure and the allocation Of control
rights. All of the extant literature focusing on control rights ignores the underlying
structure of the actual agreement.1 In addition, we follow Higgins (2007) and control for the relative bargaining position of both the pharmaceutical and biotechnology firm. We
find that of the two dimensions of contractual complexity we propose, functional scope
has a negative and significant impact on the number of rights allocated to the
pharmaceutical firm. We argue that this suggests pharmaceutical companies are able to
“bargain” or “trade” some sets of control rights for other sets of rights.
Fourth, we find that as a firm’s stock of alliances increases or if they have had
prior relationships with a partner contracts tend, on average, to be less complex. This
finding contrasts with Ryall and Sampson (2006) who find that contracts are more
detailed when firms have prior relationships. However, Ciccotello and Hornyak (2000),
1
Parke (1993) and Gulati (1995) find some evidence of reduced contractual safeguards
between firms engaging in repeated contacts. They attribute their findings to increased
levels of trust. Indeed, there is a literature dealing with relational norms, such as trust,
that view these types of activities as substitutes for complex contractual agreements
(Granovetter, 1985; Bernheim and Whinston, 1998; Bradach and Eccles, 1989; Dyer and
Singh, 1998; Gulati, 1995; Uzzi, 1997; Adler, 2001).2 Our focus on the
biopharmaceutical industry makes these findings even more interesting given average
product development cycles of 10 to 15 years (DiMasi, 2001). Given this time frame, the
risk and uncertainty involved, along with potential significant payoffs, one might expect
to see more complex agreements in order for firms to protect themselves, however, we
see the opposite.
The remainder of the paper is organized as follows. Section 2 discusses our
framework for contractual complexity and control rights; Section 3 discusses our data and
sample construction; Section 4 presents and discusses our empirical finding; Section 5
discusses and presents robustness results; and, Section 6 summarizes the analysis and
discusses the next evolution of this research.
2.0 Contractual complexity and the allocation of control rights
Transaction Cost Economics (TCE) scholars generally define “contractual
complexity” in terms of the increased number of contractual safeguards written into
contracts in order to mitigate potential exchange hazards. Broadly, three types of
exchange hazards are defined that necessitate the need for contractual complexity: asset
specificity, measurement difficulty and errors, and uncertainty (Williamson, 1985, 1991).
Uncertainty is considered as an exchange hazard specifically when asset specificity is
present in a relationship. According to TCE theory, more contractual safeguards will be
needed as the risk of opportunistic behavior increases due to one or more of these
exchange hazards. In contrast, when the likelihood of exchange hazards is low, the
associated costs of complex contracts are not necessary and relatively simple ones are
2
sufficient (Joskow, 1987). Several empirical studies support these predicted relationships
(Joskow, 1988; Pisano, 1989; Oxley, 1997).3
The extant empirical research on strategic alliances which focuses on contractual
safeguards within TCE generally address the question of when or under what
circumstances firms choose one type of alliance over another. This type of research
usually puts alliances into broad categories (such as non-equity vs. equity; and, alliance
or acquisition activity) and finds that a higher likelihood of exchange hazards results in
more hierarchical contractual agreements since these agreements provide more control
and shared ownership (Oxley, 1997; Sampson, 2004). Many of the studies which focus
on the contractual complexity of alliance agreements overlook the underlying provisions
that are included in contracts.4
In addition, analyzing the complexity of contracts alone ignores the underlying
allocation of specific control rights. It is the underlying allocation of these rights,
regardless of the complexity of the contract that will help determine how a firm will
benefit from the research relationship. For example, Adegbesan and Ricart (2005) find
that innovation might not significantly improve a firm’s performance if value is
asymmetrically appropriated by one of the parties to the agreement. Notwithstanding
prior contributions there exists no research that explores the direct relationship between
contractual complexity and the underlying allocation of control rights in an alliance or
technology sourcing agreement.
2.1 Contractual complexity
The notion of contractual complexity has been studied elsewhere in the literature
(e.g., Reuer and Arino, 2007; Robinson and Stuart, 2007; Barthelemy and Quelin, 2006;
Ryall and Sampson, 2006; Oxley and Sampson, 2004; Luo, 2002; and, Poppo and
Zenger, 2002; Joskow, 1988). However, these studies differ widely in their approach and
3
A competing literature dealing with relational norms, such as trust, views these types of activities as substitutes for complex contractual agreements (Granovetter, 1985; Bernheim and Whinston, 1998; Bradach and Eccles, 1989; Dyer and Singh, 1998; Gulati, 1995; Uzzi, 1997; Adler, 2001. Poppo and Zenger (2002) contribute to this stream of literature by arguing that relational governance act as
complements and not substitutes to complex contractual relationships. We will directly address this stream of research throughout our paper.
4
definition of complexity. For example, some use broad measures such as contract length
or number of provisions (Robinson and Stuart, 2007; Joskow, 1988) and others focus on
inclusion or exclusion of specific provisions (Barthelemy and Quelin, 2006). Barthelemy
and Quelin (2006) examine the link between three types of asset specificity and
contractual complexity. They define contractual complexity by the extent to which
contracts are comprised of “elaborate clauses”.5 Ryall and Sampson (2006) examine
telecommunication alliance contracts and find that prior alliances, in general and with a
specific partner, have an effect on contractual structure. Contractual completeness in
their study refers “…to the degree to which required inputs, expected outputs and
division of intellectual property rights are fully specified” (p.12, 2003). Poppo and
Zenger (2002) focus on the complementary relationship between formal contacts and
relational governance. Their focus is on the information systems industry and contractual
complexity is defined based on a survey asking about the customization and extent of
legal work the contracts required.6 In a more recent study, Reuer and Arino (2007) examine the determinants and dimensions of contractual complexity focusing on
weighted and un-weighted measures of eight classes of contractual safeguard provisions
originally developed in a study by Parkhe (1993). They include “enforcement provisions”
such as confidentiality, termination, arbitration and lawsuit clauses and “coordination
provisions” such as notification and auditing rights.7
In contrast to this body of work, we define contractual complexity along a
multidimensional framework: functional scope and technological scope. Functional
scope provides us with a measure of the breadth of an alliance contract while
technological scope provides us with a measure of the depth of an alliance contract. We
argue that our multidimensional focus on complexity is a better way to measure
contractual complexity in technology sourcing agreements. Broad measures such as
5
Where “elaborate clauses” are comprised across different types of clauses including control, incentive, price, evolution, and end of contract.
6
Poppo and Zenger (2002) is a pivotal study in the stream of research dealing with relational governance. Prior work (including Granovetter, 1985; Bernheim and Whinston, 1998; Bradach and Eccles, 1989; Dyer and Singh, 1998; Gulati, 1995; Uzzi, 1997; Adler, 2001) focused on substitutability between relations and complex contracts. Poppo and Zenger (2002) argue that these types of relationships are in fact
complementary with complex contracts as opposed to substitutes.
7
contract length and the number of provisions included in a contract do not consistently
define contractual complexity across heterogeneous contractual relationships and
focusing only on certain provisions may be too limited and ignore other relevant aspects
of contractual design (Reuer and Arino, 2007). Our definition of contractual complexity
(discussed in more detail in Section 3.2), on the other hand, is a measure of the activities
and technologies chosen to be included in an alliance, which is subsequently then
specified in a contract. More specifically, functional scope identifies the extent of value
chain activities, such as manufacturing, marketing and distribution that alliance partners
choose to include in technology sourcing agreements. This measure of the breadth of
technology sourcing agreement is similar to the alliance scope definition in Oxley and
Sampson (2004).8
Another dimension of the scope of an alliance is the level of technological
complexity. Technological complexity, especially in research-intensive alliances, is
particularly relevant since it relates to firm capabilities and the overall uncertainty of the
focal projects. We argue that in technology sourcing agreements another dimension of
contractual complexity is based on technology scope. Technology scope or the number
of technologies that are specified in an alliance defines the depth dimension of
contractual complexity.910 The greater the scope of an alliance is in either dimension, the more interdependent and extensive it will be. As a result, an increase in either the
breadth or depth of an alliance will increase the expected collaborative intricacy of the
relationship and thus contractual complexity.
When a project is more complex and a greater number of alliance activities are
jointly completed, then TCE predicts that the risk for exchange hazards, such as potential
opportunistic behavior and leakage of knowledge, may be greater (Williamson, 1985,
8
Heiman and Nickerson (2004) study the tension between the need to share knowledge and the need to safeguard against uncontracted for expropriation of knowledge. In analyzing publicly announced alliances from 1977 to 1989 they construct a measure of tacit knowledge that is similar to our notion of breadth.
9
Theoretical conceptualization of technology scope (Khanna, 1998 and Khanna, Gulati and Nohria, 1998) and empirical analysis by Oxley and Sampson (2004) acknowledge that alliance scope is a
multidimensional measure but to our knowledge this is the first empirical paper to construct such a multidimensional measure.
10
1991). Prior research mainly focusing on the governance choice decision, demonstrates
that hierarchical governance forms (e.g., equity joint venture) are more likely to be
adopted when the alliance scope is greater. Alliance scope in these studies is determined
by the inclusion of functional activities or the number of projects involved in an alliance
(Pisano, 1989; Oxley, 1997). An important exception to this is the research by Oxley and
Sampson (2004) where the determinants of alliance scope are explicitly analyzed.
In the extant literature the concepts of complexity and uncertainty are often used
interchangeably. This creates problems in the empirical examination of the effects of
uncertainty on the governance modes of transactional relationships (Slater and Spencer,
2000).11 In our analysis, we specifically examine how technology characteristics, which define the level of technological uncertainty in an R&D agreement, affect the depth of
alliance scope and thus contractual complexity. In collaborative R&D alliances, contract
specification is difficult since technological know-how is highly tacit (Mowery and
Rosenberg, 1989). For newer and less known technologies, contract specification is
expected to be even more challenging than those alliances with older, more established
technologies since the level of tacitness in technological know-how is greater (Davidson
and McFetridge, 1984). To facilitate R&D collaboration and increase the effectiveness of
technological communication, partner companies may choose to technologically broaden
the scope of an alliance to include other related technologies in addition to the novel
technology or the novel aspect of technology that is of main interest. Thus, companies
that chose to engage in projects using highly uncertain and novel technologies may also
chose to increase the depth or the technological detail of their R&D collaboration.
Similarly, those technologies that are either new or old but less prevalently used are also
11
likely to be more uncertain, and thus require technologically deeper, more detailed
contracts.
2.2 Allocation of control rights
In addition to analyzing the breadth and depth of a contract we go one step further
and delve into the actual contracts to study the allocation of control rights and the
relationship between that allocation and complexity. Regardless of how the underlying
contracts are structured and what terms are included, it is how the individual rights are
allocated that will determine how a party will benefit from the agreement. We address
this issue next.
Since the seminal work of Coase (1937), economic research has considered the
boundaries of the firm. Grossman and Hart (1986) and Hart and Moore (1988) consider
the issue of incomplete contracting between principal and agent. Here two parties are
unable to draft a contract that is capable of covering all potential contingencies that may
arise during their relationship. As a result, they suggest optimal ownership of a project
should be assigned to the party with the greatest marginal ability to impact the final
outcome. This party should be the one who retains the right to make decisions not
explicitly specified by contract. Consequently, they should also be the firm that receives
any and all of the surplus rents generated by a given project. This allocation of rights
should provide an incentive to the firm to function in a manner which will optimize
returns from the project and, in turn, maximize their own potential surplus.
Aghion and Tirole (1994) utilize the Grossman-Hart framework to model a
research and development alliance between two firms. They begin by assuming that
research-intensive firms are without financial resources of their own and are restricted
from being able to borrow money or commercialize their own innovations. As a
consequence, the research-intensive firm will turn to a “customer” for alliance financing.
The “customer” in this framework is the party who will directly benefit from the
innovation. The customer is assumed to be unable to independently develop the
two firms will have an impact on the subsequent allocation of control rights for the
innovation.
Lerner and Merges (1998), Lerner et al (2003), Higgins (2007) and Adegbesan
and Higgins (2007) empirically test the above theoretical prescriptions by exploring the
role that the availability of public financing has on the bargaining power of the
research-intensive firm and the subsequent allocation of control rights. Aghion and Tirole (1994)
do not explicitly discuss the role of public financing. However, Lerner et al (2003),
claim “…it is reasonable to believe that variations in the availability of public financing
will affect the bargaining power of R&D firms.” This is supported by Aghion and Bolton
(1992) and Holmstrom and Tirole (1997) who find strong links between the transfer of
control rights and the conditions of public equity markets, in terms of the availability of
public financing.
Within the framework of Aghion and Tirole (1994), Lerner and Merges (1998)
find that the number of control rights allocated to the biotechnology firm is an increasing
function of both the firm’s financial health and the presence of favorable conditions in the
marketplace. Biotechnology firms with more revenues in the year prior to the alliance
agreement were less likely to negotiate away their control rights. The presence of
revenues serves as an indication that the firm was negotiating from a position of relative
strength. This finding is consistent with prior theoretical predictions.
Lerner et al (2003) and Higgins (2007) explore whether alliance financing
agreements provide for different allocation of control rights between periods of varying
availability of public financing. Theory suggests that agreements signed in periods with
limited availability of external financing will be less likely to maximize innovative
output. Lerner et al (2003) and Higgins (2007) find that in periods of limited availability
of public financing, smaller biotechnology firms seek out larger pharmaceutical firms for
alliance financing. In these agreements, biotechnology firms are in fact more likely to
cede a greater number of control rights to the financing (pharmaceutical) firm.
Dessein (2005) develops a theory of the structure of alliances between an investor
firm and an entrepreneur. His model is based upon asymmetric information driving the
main underlying motivation behind the allocation of control rights. He finds that even a
substantial amount of control to the investor in an effort to signal his congruence. He
also finds that the relinquishing of control is an increasing function of the level of
informational asymmetries and a decreasing function in the resources of the entrepreneur.
This result implies that early stage projects, where the information asymmetries are the
largest, will be where the most rights are given up. While this finding is consistent with
Lerner and Merges (1998), it is inconsistent with prior theoretical predictions.
Aghion and Tirole (1994) consider the bargaining positions of both firms, while
the empirical work by Lerner et al (1998, 2003) focuses on the bargaining position of the
smaller research-intensive firm, in terms of their ability to access public equity markets.
These studies allow the overall health of the larger customer firm to remain fairly static.12 As a result, the bargaining position of the customer firm is excluded from the analysis.
On the other hand, Elfenbein and Lerner (2003), Higgins (2007) and Adegbesan and
Higgins (2007) endeavor to account for the bargaining position of both firms. While
bargaining position of the two firms is measured slightly differently across these studies,
all three of these studies find evidence that the allocation control rights studied are
sensitive to the underlying relative bargaining position of the two parties.
The impact of contractual complexity, however defined, on the underlying
allocation of control rights has not been addressed in the literature. Our study sets out to
fill this gap in the literature. Not only do we extend the contractual complexity literature
by analyzing complexity within a multidimensional framework but we also study whether
this complexity matters for the allocation of control rights. Control rights clearly matter
to firms. It is how these rights are allocated that will dictate how, for example, the firm
will benefit from future financial rewards (Adegbasen and Higgins, 2007). Moreover, the
use of control rights can be used to help mitigate moral hazard issues inherent in these
types of agreements (Lerner and Malemendier, 2003). The interplay between contractual
complexity and control rights will tell us whether firms are able to gain (or lose) by
entering more (or less) complex agreements.
12
These studies also implicitly assume that the smaller biotechnology firm is captive to one customer. However, on average, from 1994 to 2001, biotechnology firms had, on average, six alliance partnerships with other large pharmaceutical companies. This would seem to suggest that a large pharmaceutical partner should be unable to demand excessive rents or control rights for fear that the biotechnology firm would seek out another partner. In the above referenced works, the pharmaceutical firm or customer is assumed to be unable to independently develop the innovation in question. The loss of such a
3.0 Data and sample
We study technology sourcing agreements (alliances) between biotechnology
firms and larger pharmaceutical manufacturers. Data for this paper is drawn from
multiple sources including Recombinant Capital (rDNA and ReCapRx), BioScan, FDA
Orange Book, IMS Health, Thomson Derwent, NDA Pipeline, Pharmaprojects and
Compustat.
3.1 Alliances and determination of control rights
Alliance information is obtained from Recombinant Capital, a California-based
biotechnology consulting firm. Their data identifies alliances in the biopharmaceutical
industry from 1973 up to the present. It provides both a general description as to the
nature of the alliance along with detailed analyses of some of the actual alliance
contracts. From this data we randomly selected 240 alliances involving just two parties
(a pharmaceutical and biotechnology firm), whose main focus is on research and
development and has a detailed contract analysis available. We restrict our sample to
alliances involving just two firms in order to be able to clearly identify the allocation of
control rights.
Not every alliance identified in the Recombinant Capital database has a detailed
contract analysis associated with it. The choice of which contracts to analyze by
Recombinant Capital may not be a random phenomenon. The non-randomness of this
choice may very well introduce a selection bias into the sample; however the direction
and magnitude of a potential bias remains unclear. As a result, the potential presence of
underlying variables which could strongly impact the chance for inclusion into the
analysis process warrants the use of a Heckman selection model (Greene, 2003). The
dependent variable in the regression equation is Total rights, the total number of control
rights allocated to the pharmaceutical firm. The independent variables for the regression
equation are the same as those that will be used in subsequent analyses and will be
least at the 10% level. Moreover, in every case the reported χ2 test, which is equivalent to testing for ρ =0 (where ρ is the correlation between the error terms of the regression
and selection equations), is not significantly different from zero. As a result, since ρ is
not significantly different from zero, standard regression techniques can be applied to the
regression equation without concern of introducing a selectivity bias.
Consistent with Lerner et al (2003) and Higgins (2007) and in order to avoid
unnecessary heterogeneity, transactions are excluded where:
• One of the parties is a government agency or university.
• The current alliance is a renegotiation or restatement of a previous alliance between the two firms.
• There exists no research component or aspect to the alliance.
• One firm has a controlling interest in the other firm (greater than 50%).
Each contract is reviewed for relevant deal information including: the date of the
alliance, the technology and subject covered, total value of the agreement, up-front
payments, royalty rates, equity stakes, contingent or milestone payments, and stage of the
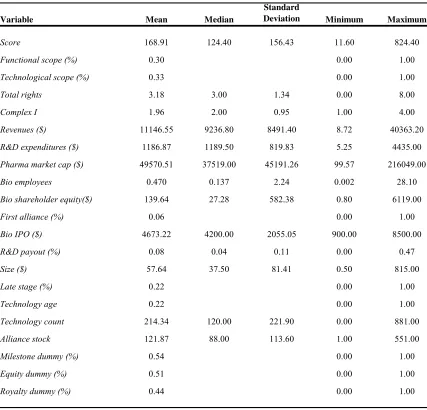
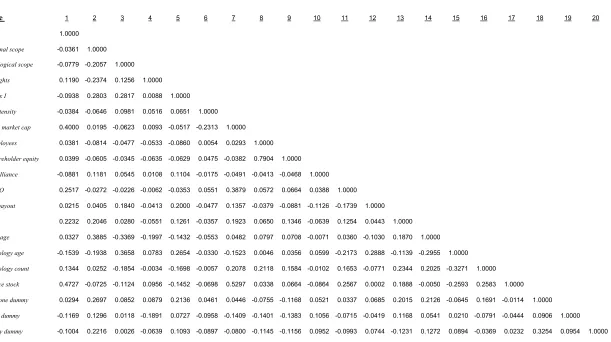
lead product. Table 1 presents a description of the variables while Table 2 summarizes
this information. Correlations for all variables are presented in Table 3. The average size
of the alliances in our sample is approximately $58 million (all values are in constant
1999 dollars). Upfront payments are present in 83 percent of the deals and average $7.91
million. The median upfront payment is $5.3 million. Running royalty payments are
identified in 44 percent of contracts and average 24 percent of net sales. The median
running royalty is 15 percent of net sales. Milestone payments of some type are present
in 54 percent of agreements. For the milestone contract terms that are available, for
products at these early stages, long-term financial rewards are very significant.
Unfortunately, the probability that a product makes it from pre-clinical testing all the way
to approval is very small, so the odds are against the biotechnology firm collecting on the
full value of the milestone payments.
Contracts are also reviewed in order to determine the allocation of control rights.
There are a broad spectrum of control rights that can be considered ranging from
disposition of patented and unpatented information and the control of clinical trials and
subsequent manufacturing and marketing of developed products.
Since we are concerned with research and development activities, we want to
come up with a subset of control right rights that directly influence the R&D relationship
between the pharmaceutical and biotechnology firms. After consulting with
representatives in the biotechnology and pharmaceutical industries, the following bundle
of eight control rights are selected to be included. Each of these eight rights is further
sub-categorized for analysis purposes. Three sub-categories are used: intellectual
property rights, exit strategy, and license.
Intellectual Property Rights
1. Ownership of patents;
2. Control and responsibility for patent litigation process;
3. Transfer of unpatented R&D “know-how”;
Licensing Rights
4. Right to sub-license;
5. Royalty payment tie-ins;
Exit Rights
6. Product reversion rights upon termination; and,
7. Changes in control;
8. Right to terminate without cause.
A forth sub-set of two additional rights were also collected for the purposes of
identifying the functional scope of the contract (discussed in detail below).
Manufacturing & Marketing Rights
9. Control of initial manufacturing process;
10.Marketing rights to the product;
It should be noted that there are a broad spectrum of control rights that can be
in this paper are slightly different than the rights considered in Lerner et al (2003),
Higgins (2007) and Adegbesan and Higgins (2007). The differences in rights selection
across these projects mainly revolves around the issues being studied. For example, the
bundle of rights utilized in Adegbesan and Higgins (2007) focus solely on those rights
that influence the split of the future “financial pie”. Higgins (2007) showed general
robustness to Lerner et al’s (2003) bundle of rights for the specifications being tested.
Our specific selection of rights generally follows Higgins (2007) and will be discussed
more fully below.13
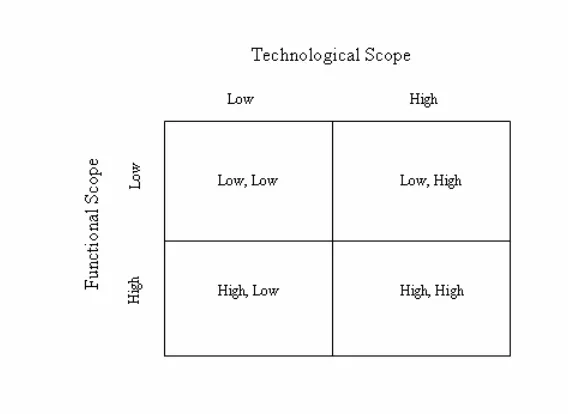
3.2 Contractual complexity
For the purposes of this paper we will define contractual complexity along two
separate dimensions: functional scope and technological scope. Functional scope will
provide us with a measure of the breadth of an alliance contract while technological
scope provides us with a measure of the depth of an alliance contract. Fig. 1 presents our
notion of contractual complexity in a 2 x 2 matrix. We further divide functional and
technological scope into low and high types. Technological scope is deemed low if the
alliance agreement focuses on only one technology. In contrast, technological scope is
deemed high if the alliance agreement focuses on more than one technology. Obviously,
the larger number of technologies covered, the greater the internal capabilities of the two
firms need to be – especially for the biotechnology firm. We define Technological scope
as a dummy variable that equals one if the alliance contract covers more than one
technology. 33 percent of the sample contracts fit in the high category.
Functional scope is deemed to be low if the alliance agreement focuses solely on
research and development and contains only focal rights described in Section 3.1. In
contrast, functional scope is deemed to be high if the alliance agreement includes
provisions dealing with marketing, manufacturing and distribution. We therefore define
Functional scope as a dummy variable that equals one if an alliance contract contains
13
marketing, manufacturing or distribution provisions. 30 percent of the sample contracts
fit in the high category.
Referring to Fig.1, an alliance contract in the top left quadrant (L, L) is one that
focuses only on one technology and contains no provisions with respect to marketing,
manufacturing and distribution. In contrast, an alliance contract in the lower right
quadrant (H, H) is one that focuses on more than one technology and contains provisions
for marketing, manufacturing or distribution. For the overall sample, 42 percent of the
alliance contracts fall into the (L, L) quadrant, 25 percent fall into the (H, L) quadrant; 28
percent fall into the (L, H) quadrant and 5 percent fall into the (H, H) quadrant.
We combine these two dimensions to construct a continuum for measuring overall
contract complexity. We categorize contracts in the following order from simple to
complex: (L, L), (H, L), (L, H), and (H, H). That is we define the simplest contract (L, L)
as one that does not include marketing, manufacturing or distribution provisions
(Functional scope equals “L”) and covers only one technology (Technological scope
equals “L”). In contrast, we define the most complex contract (H, H) as one that includes
marketing, manufacturing or distribution provisions (Functional scope equals “H”) and
covers more than one technology (Technological scope equal “H”).
By reformatting the quadrants represented in Fig. 1 into a linear continuum we
need to decide whether to order (H, L) and (L, H) in this manner or (L, H) and (H, L).
After consulting with representatives responsible for negotiating alliance contracts from
both the pharmaceutical and biotechnology industry, we use the former, (H, L) and (L,
H). There was general agreement that alliances covering more than one underlying
technology made the overall alliance more complex than an expanded functional scope.
We define Complex I as a categorical variable from one to four for our four
categories of contractual complexity. (L, L) is assigned one while (H, H) is assigned a
value of four. Complex I has a mean (median) value of 1.96 (2.00) and a standard
deviation of 0.95. Given that our conversations with industry representatives seemed to
indicate that technological scope may be more influential on complexity than functional
scope, we define Complex II as a dummy variable that equals one if Complex I equals
3.3 Technology age and prevalence
From Recombinant Capital we are able to identify the focal technology(s)
underlying each alliance. As a result we are able to determine both the age of the focal
technology and its prevalence. For our purposes, age is a function of when a focal
technology is first identified in any alliance.14 It is certainly the case that focal
technologies may exist before their first appearance in an alliance – either physically or
conceptually. However in most cases detecting this type of information in a consistent
manner is not possible. By focusing on the appearance of a technology in a first alliance
we are using a homogenous standard across all technologies. We define Technology age
as a dummy variable that equals one if the difference between the year of the contract and
year of first appearance in the population of alliances for the focal technology is less than
or equal to five years.15 The mean value for Technology age is 0.22 which implies that 22 percent of the focal technologies are less than or equal to five years of age.
Just because a technology is old does not necessarily imply that it is prevalent or
has diffused into the industry. We attempt to capture how prevalent a focal technology is
by counting the number of other alliances that used the focal technology until the date of
the sample alliance. As such, we define Technology count as the number of alliances in
the population of Recombinant Capital’s database within the focal technology that have
been initiated until the sample alliance. The mean (median) number of prior alliances in
the population utilizing the same sample focal technology is 214.34 (120). The simple
correlation between Technology count and Max Years Since is 0.5483. This suggests that
while there is a positive correlation, simple age is not the only driving factor of a
technology’s prevalence.
3.4 Pharmaceutical research pipeline
14
We utilize Recombinant Capital’s database and limit the lower end at 1980. This constraint is imposed due to data limitations in other data sources, namely the pipeline data. Moreover, the industry itself was fairly new at this point, with the first round of large scale firms going IPO in the mid 1980s.
15
We follow Higgins and Rodriguez (2006) and Higgins (2007) and construct a
weighted-value of each pharmaceutical firm’s pipeline products using data from NDA
Pipeline, Pharmaprojects and supplemented from ReCapRx from 1989 to 2001. This
measure is referred to as the Score. A relatively high Score indicates a healthy product
pipeline versus a company with a lower value Score. A declining Score in the years prior
to an alliance indicates a company whose product pipeline is deteriorating. Firms in this
situation negotiate and bargain from a position of weakness. Conversely, an increasing
Score value in the years prior to an alliance would indicate that a company’s product
pipeline is expanding and therefore they can bargain from a position of strength (Higgins,
2007).
3.5 Financial data
Financial data for both the pharmaceutical and biotechnology firms is summarized
in Table 2 and is obtained primarily from Compustat. Some financial data is
supplemented from individual firm’s filings and corporate internet sites. Biotechnology
initial public offering (IPO) data is obtained from Securities Data Corporation (SDC).
Pharmaceutical firm external R&D data is collected from Recombinant Capital.
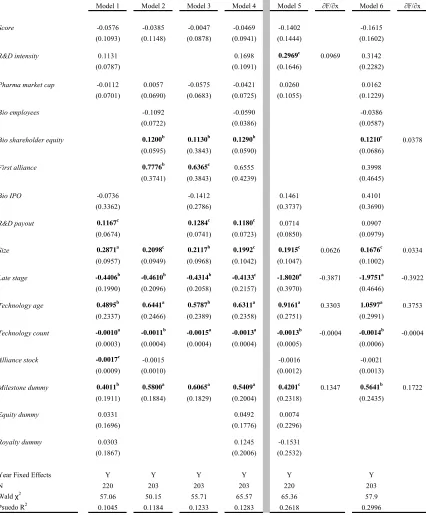
4.0 Empirical findings
4.1 Technological scope
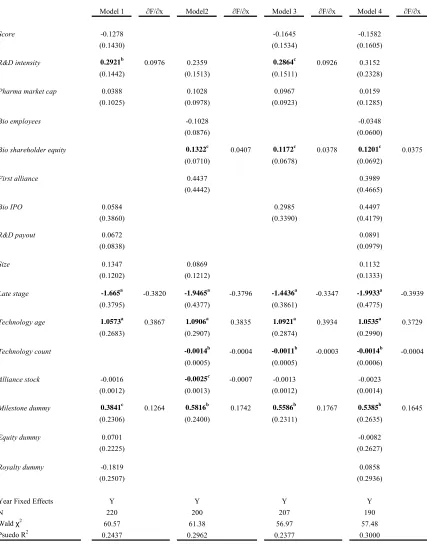
Table 4 presents probit estimates for our data regressing Technology scope on a
series of independent variables expected to affect the probability that a pharmaceutical
firm enters a technologically complex agreement.16 The dependent variable used in the regressions reported in Table 4 is an indicator variable yit,that assumes a value of one for
a given firm i in a specific year t if that firm enters into an alliance that contains more
than one underlying technology, and is zero otherwise.
For independent variables we use a weighted measure of the pharmaceutical
firm’s research pipeline in the year prior to the alliance (Score); the natural log of
pharmaceutical firm R&D expenditures to revenues (R&D intensity); the natural log of
pharmaceutical firm market capitalization (Pharma market cap); the number of biotech
employees (Bio employees); the natural log of biotechnology firm shareholder equity
(Bio shareholder equity); an indicator if the focal alliance is the first one for the
biotechnology firm (First alliance); the natural log of the amount of public equity raised
in biotechnology (IPOs) in the year prior to the alliance (Bio IPO); the ratio of
pharmaceutical firm external R&D expenditures to total R&D expenditures in the year
prior to the alliance (R&D payout); the natural log of the total value of the alliance (Size);
an indicator if the lead product was in late-stage clinical testing (Late stage); an indicator
if the difference between the year of the contract and year of the first alliance in the
population for the focal technology is less than or equal to 5 years (Technology age); the
number of alliances in the population within the focal technology that have been initiated
until the focal alliance (Technology count); the pharmaceutical firm stock of alliances
(Alliance stock); and indicators that identify the presence of milestone payments
(Milestone dummy), equity positions (Equity dummy) and royalties (Royalty dummy).
Year dummies are included in all models. See Table 1 for variable definitions, Table 2
for descriptive statistics and Table 3 for variable correlations.
Across all four models (Model 1 to Model 4) in Table 4, we find a positive and
significant impact of Technology age on the probability that an alliance contract covers
more than one technology. Marginal effects range from 0.3729 to 0.3934 and are all
significant at the 1 percent level. This suggests that newer technologies are often coupled
together or combined with existing technologies in these agreements. The effects on
Technology count bolster this finding. The negative coefficient implies that technologies
that are less prevalently utilized in the population of alliances are more likely to be
coupled with another technology. Taken together we view this as one way to possibly
mitigate risk (exchange hazard) of an underlying technology.
Agreements signed where the lead product is in late stage clinical testing (defined
as either Phase II or Phase III) are less likely to be associated with contracts that cover
more than one technology. The marginal effects on Late stage range from negative 0.33
to negative 0.39. This result is consistent with our expectations about later stage research
since by the time a drug candidate moves into late stage clinical testing it is more focused
We next consider the effect firm size and capabilities have, if any, on contractual
complexity. Interestingly, we find no effect of pharmaceutical firm size as measured by
firm market capitalization, Pharma market cap. Simply, the sheer size of a company
does not appear to have an effect on the technological depth of a contract. Capabilities,
however, do matter. We proxy pharmaceutical firm internal capabilities by Cohen and
Levinthal’s (1989) measure of absorptive capacity defined as R&D expenditures divided
by revenues, R&D intensity. They postulate that a firm’s absorptive capacity is based on
their own internal research and development efforts. As a result, regardless of the
external R&D activities, for example strategic alliances, that a company may engage in,
the firm still must continue to pursue a comprehensive internal research program
(Chesbrough, 2003). We find a positive and significant effect on R&D intensity with
marginal effects ranging from 0.0926 to 0.0976. Higgins and Rodriguez (2006) show
that R&D intensity has a positive influence on a pharmaceutical firm’s ability to engage
in outsourcing acquisitions. Our findings here suggest that in addition to helping dictate
the ability of firms to engage in alliances and acquisitions, it also increases the
probability that a specific alliance is technologically deep. This finding complements the
extant literature in that it suggests that firms that have the internal capability do not
necessarily need to engage in large numbers of alliances, but rather can engage in a
smaller number of more “deep” agreements.
The number of employees is a commonly used proxy to measure the size of a firm
(e.g., Graham and Higgins, 2007; Rothaermel and Hess, 2007; Shan et al, 1994; Acs and
Audretsch, 1989). This measure is often used instead of market capitalization data since
financial information about private companies is not always available.17 We find no
impact between the number of employees of a biotechnology firm, Bio employees, and
the probability that a given contract is technologically deep.
In addition to biotechnology firm size, in terms of the number of employees, we
also examine the effect that firm financial resources, as measured by Bio shareholder
equity, have on the ability to engage in complex agreements. We find a positive and
significant impact of biotechnology firm shareholder equity, Bio shareholder equity, on
17
the probability of a technologically deep contract. Marginal effects range from 0.0375 to
0.0407 and are significant at the 10 percent level. As with the pharmaceutical firms, here
again, it appears that a biotechnology firm’s capabilities, proxied by their assets, are what
matter with respect to being able to undertake more technologically deep contractual
relationships. These findings complement Lerner and Merges (1998) and Higgins
(2007). Firms in stronger financial position are not only able to negotiate from a stronger
position, but these firms are also able to engage in more technologically deep
relationships.
We find a positive and significant relationship between the presence of milestone
payments, Milestone dummy, and the probability of a technologically deep contract.
Marginal effects range from 0.1264 to 0.1767 and are significant at least at the 10 percent
level. We interpret the use of milestone payments as one way pharmaceutical firms are
able to help mitigate potential moral hazard issues surrounding alliance agreements.
Since research funds are fungible, theoretically, biotechnology firms could use research
funds for other internal projects. Milestone payments limit the financial exposure of the
pharmaceutical firm while providing an incentive to the biotechnology firm to meet
specific, verifiable research goals. Jensen and Thursby (2001) find that royalties and
equity are important in dealing with the moral hazard issue surrounding inventor effort.
While neither Royalty dummy nor Equity dummy are significant, we believe milestone
payments are acting in much the same way.18
Of the remaining independent variables only Alliance stock is significant,
however it is only negative and significant in Model 2. In further robustness testing, the
variable remains unstable. The negative coefficient suggests that as firms engage in
larger numbers of alliances the probability that they are technologically deep diminishes.
It would seem that these firms just simply engage in larger numbers of more “shallow”
alliances. The health of a pharmaceutical firm’s research pipeline, Score has been shown
to impact the allocation of control rights (Higgins, 2007) and the probability that a firm
18
engages in an acquisition (Higgins and Rodriguez, 2006), however we find that it has no
effect on the probability a firm engages in a technologically deep contract.
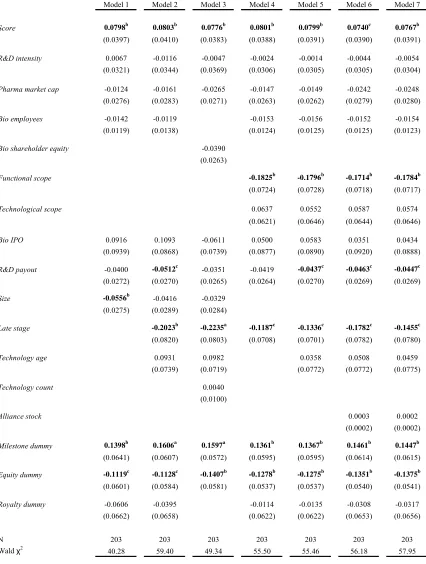
4.2 Functional scope
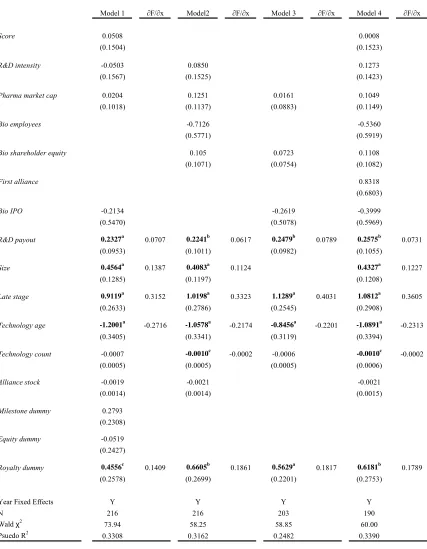
Table 5 presents probit estimates for our data regressing Functional scope on a
series of indicator variables expected to affect the probability that a pharmaceutical firm
enters functionally complex agreement.19 The dependent variable is an indicator yit that assumes a value of one for a given firm i in a specific year t if that firm enters in to an
alliance that contains marketing, manufacturing and/or distribution provisions, and is zero
otherwise. Independent variables are the same as we utilized in Table 4. Year dummies
are included in all models.
By far the most important factor influencing the functional scope of a contract is
the stage of the focal research. The marginal effects for Late stage range from 0.3152 to
0.4031 and are significant across all models at the 1 percent level. This finding is not
unexpected since focal products in later stages of clinical testing have a higher
probability that they will reach FDA approval. As a result, marketing, manufacturing and
distribution rights become much more relevant.
In addition to the stage of the focal product, the overall size of the alliance, Size,
tends to increase the probability that a contract is functionally broad. Marginal effects
range from 0.1124 to 0.1387 and are significant at the 1 percent level. While it would
appear that alliances dealing with later stage products would increase the overall size of
the alliance, the simple correlation between Late stage and Size is only 0.1870.
Across all four models (Model 1 to Model 4), we find a negative and significant
impact of Technology age on the probability that an alliance contract is functionally
broad. Marginal effects range from negative 0.2174 to negative 0.2716 and are all
significant at the 1 percent level. This suggests that newer technologies tend to be apart
of contract agreements that focus more on research and development. As these
technologies are newer, it makes little sense for companies to negotiate marketing,
manufacturing and/or distribution rights. The effects on Technology count bolster this
finding. The negative coefficient implies that technologies that are less prevalently
utilized in the population of alliances are more likely to be functionally narrow. Taken
together this suggests that biotechnology firms have had some success in delaying the
inclusion of these contractual terms. The importance of this will be discussed below
when we discuss the allocation of control rights.
Milestone payments which were demonstrated to be important for Technological
scope are not important here (likewise, the presence of an equity stake, Equity dummy,
has no effect). However, the presence of royalty payments, Royalty dummy, do matter for
functional scope. The simple correlation between Royalty dummy and Functional scope
is 0.2216 and marginal effects range from 0.1409 to 0.1861 and are significant at least at
the 10 percent level. We can infer that biotechnology firms appear to be more likely to
negotiate for royalty payment terms for more functionally broad agreements. Intuitively,
this makes sense since the inclusion of marketing, manufacturing and distribution
provisions may necessitate negotiations on royalty payments.
The proportion of research and development expenses committed to alliances as
measured as a proportion of total research and development expenses, R&D payout, has a
positive and significant impact on the probability that firms engage in functionally broad
agreements. Marginal effects range from 0.0617 to 0.0789 and are significant at least at
the 5 percent level. As pharmaceutical firms commit an ever increasing amount of their
R&D budgets to external alliances, our finding suggest that the contractual landscape
shifts in that the functional scope broadens. This finding ties into overall contractual
complexity, which will be discussed in the next section.
None of the remaining independent variables are significant across any of the
specifications tested. Unlike the previous results, neither firm capability nor size matter
when considering the functional scope of the agreement. Now that both Technological
scope and Functional scope have been addressed individually we combine them and look
at overall contract complexity.
4.3 Contractual complexity
As discussed above, the notion of contractual complexity has been studied
contractual complexity, no work that we are aware of defines complexity as we have here
in a multi-dimensional framework.
Table 6 presents both ordered probit (Model 1 to Model 4) and probit (Model 5
and Model 6) estimates for our data regressing Complex I and Complex II, respectively,
on a series of independent variables expected to affect the probability that a
pharmaceutical firm enters a contractually complex agreement.20 The dependent variable
in Model 1 to Model 4 is categorical ranking from one to four describing the complexity
of the alliance along the previously discussed two dimensions. The dependent variable in
Model 5 and Model 6 is an indicator yit,that assumes a value of one for a given firm i in a
specific year t if that firm enters in a strategic alliance that contains manufacturing and/or
marketing provisions, and is zero otherwise. Independent variables are same as those
utilized in Table 4 and Table 5. Year dummies are included in all models.
The general proposition of transaction cost economics is that managers attempt to
align the features of contractual relationships between firms in order to address issues of
technological uncertainty, asset specificity and/or difficult performance measures
(Williamson, 1985, 1991). Pharmaceutical firms operate in an atmosphere of extreme
technological and research uncertainty with often highly specialized assets. As a result,
alliance agreements between pharmaceutical and biotechnology firms tend to be rather
detailed. Additionally, most pharmaceutical firms engage in many alliances over time.
For example, on average, firms in our sample engaged in approximately 122 alliances.
This experience, both in general and through repeated contact with specific
biotechnology partners leads firms to become more proficient at constructing agreements.
However, there is a split in the extant literature with respect to whether contractual terms
or the contracts themselves become more or less complex as firms engage in more and
more alliances. The potential financial loss to a firm if they are not contractually
protected could potentially reach into the billions of dollars if a new drug is discovered.
Given the value of the potential loss and significant uncertainty underlying the
technological and scientific risks it would seem logical that contractual safeguards would
increase (Williamson, 1985; Klein et al, 1978). Ryall and Sampson (2006) find that
contracts are more complete or detailed when firms have prior alliances. This suggests
firms learn to craft more complex contracts as they gain experience.
However, contrary to Williamson (1985) and Klein et al (1978), Parke (1993) and
Ciccotello and Hornyak (2000) find some evidence of reduced contractual safeguards
between firms engaging in repeated contacts. Along with Gulati (1995) they attribute this
to increased levels of trust. Since the number of pharmaceutical firms that operate within
a particular therapeutic category is relatively small, one would expect that the possibility
of future relationships would prevent biotechnology firms from shirking or reneging on a
contract. Likewise, as Klein (1980) and Klein and Murphy (1997) discuss, firms with
unequal bargaining power, in this case pharmaceutical firms, will also not act
opportunistically as this could damage their reputation and limit their potential future
alliance partners.
The coefficients on Alliance stock, across all models tested, is negative, but is
only significant at the 10 percent level in Model 1. Our results, as limited as they may
be, seem to support Parke (1993) and Ciccotello and Hornyak (2000). Contractual
complexity tends to decline as alliance stock increases. We generate a dummy variable,
Prior, that equals one if the two firms had a prior alliance before the focal alliance.
Models 1 to 6 in Table 6 were recomputed switching out Alliance stock with Prior.
Results were similar to Alliance stock in that the coefficients were negative and
significant at the 10 percent level, but not across all models. Again, these results appear
to support Parke (1993) and Ciccotello and Hornyak (2000).21 This finding is surprising given the extensive development times and high risk of failure coupled with the
possibility of a significant financial payoff.
While cumulative experience appears to favor less complex agreements, alliance
inexperience as measured by First alliance suggests that contracts are more complex if it
is the biotechnology firm’s first alliance. This finding is consistent with Williamson
(1985) and Klein et al (1978) since the level of risk (or perceived risk) on behalf of the
21
biotechnology company (and pharmaceutical firm) is relatively high; the biotechnology
firm’s research performance is untested in the market.
Across all models and both specifications we find that the greater the resources of
the biotechnology firm as measured by Bio shareholder equity, the more complex will be
the contract. The marginal effect in the probit specification in Model 6 is 0.0378 and is
significant at the 10 percent level. As a measure of firm resources, it seems consistent
that as those resources increased contracts would begin to include manufacturing, for
example, since some of the larger biotechnology firms have these capabilities.
Interestingly, we find that the younger the technology, the more likely it is that the
contract will be more complex. The coefficients of Technology age are positive and
significant across all specifications with marginal effects in Model 5 and Model 6 ranging
between 0.3303 and 0.3753, respectively. With such a new technology it is doubtful that
the phase of the focal candidate is driving the result. The correlation between
Technology age and Late stage is negative 0.2955. It might very well be the newness of
the focal candidate that is the reason for the complex contract. With new technologies
the uncertainty of outcome is greater and it is possible that firms are simply trying to lock
up downstream rights while they are less expensive. Lerner et al (2003) show that when
contracts get renegotiated, as they would in this case if the downstream rights were
excluded, the terms received by the biotechnology firms improve.
Complementing a technology’s age is how prevalent the technology has been with
respect to its dispersion in the population of biopharmaceutical alliances. We measure
technology prevalence by Technology count and find that the more prevalent a given
technology is in the population of alliances, the less complex the contractual agreement.
The coefficient on Technology count is negative and significant across all specifications
tested and the simple correlation between Technology count and Technology age is
negative 0.3271.
One of the largest overall factors that predict the probability of a complex contract
is the phase of the focal product. The negative and significant on the coefficient is
interpreted differently here in Table 6 than it was in Table 4 or Table 5. Here in Table 6,
recall the dependent variables are Complex I and Complex II. Complex I is defined, as we
agreements with one technology and a range of contractual breadths (functional scope).
The upper end of the continuum contained agreements with technological depth.
Complex II is a dummy that equals one if the contract is technologically deep (covering
more than one technology). As a result, the interpretation of the marginal effects in
Model 5 and Model 6 (negative 0.3871 and negative 0.3922, respectively) suggest that as
focal candidates move into later stages, they are focused on one technology and this
simplicity is reflected upon in the underlying contracts. Moreover, more complex
agreements in earlier stages of development support the view that future contingencies
are difficult to codify for research intensive firms (Robinson and Stuart, 2007).
Finally, the presence of a milestone payment, Milestone dummy, has a positive
and significant impact on the probability of a contract being more complex. We find no
effect on complexity as a result of the presence of an equity stake, in contrast to Robinson
and Stuart (2007), or the presence of a royalty payment. Coefficients on Milestone
dummy were positive and significant across all models and both specifications with
marginal effects ranging from 0.1347 to 0.1722. Milestones clearly are one way to help
mitigate the risk and uncertainty associated with undertaking research across multiple
technologies. Additionally, milestones can be used as a way to mitigate some of the
underlying moral hazard issues inherent in these relationships.
4.4 Allocation of control rights
Consistent with previous work (Lerner and Merges, 1998; Lerner et al, 2003;
Lerner and Malmendier, 2004; Adegbesan and Higgins, 2007; Higgins, 2007), the total
number of control rights allocated to the pharmaceutical firm is the dependent variable,
Total rights. This dependent variable is tested against various specifications of the same
independent variables we utilized in the previously analyses with a few exceptions. Since
we are interested in contractual complexity we include our two component parts,
Technological scope and Functional scope. We include the individual components in the
reported analysis so we can comment on which, if either, component may be driving the
result.22
22
Given the nature of the dependent variable we test for overdispersion in the data
to determine whether a Poisson or negative binomial model is warranted. We test for
overdispersion utilizing a likelihood ratio test based on the Poisson and negative binomial
distributions (Cameron and Trivedi, 1998). This test tests the equality of the mean and
the variance imposed by the Poisson distribution against the alternative that the variance
exceeds the mean. We reject the null hypothesis and as a result of overdispersion in our
data we utilize a negative binomial model.
Recall contractual complexity, as we define it, is a function of both Functional
scope and Technological scope. In terms of the allocation of control rights only
Functional scope appears to matter. Technological scope is positive but not significant at
any reasonable level in any model tested. This implies that the number of underlying
technologies in an agreement has no effect on the allocation of control rights. On the
other hand, Functional scope is negative and significant with coefficients ranging from
negative 0.1714 to negative 0.1825. For those contracts that contain either marketing or
manufacturing provisions, pharmaceutical firms concede focal rights to biotechnology
firms.23 The natural question then becomes is do pharmaceutical firms use the focal rights to “pay” for marketing and/or manufacturing rights. In order to test this hypothesis
we construct a new variable Functional scope II. Functional scope II is defined as a
dummy that equals one if contract not only contains marketing, manufacturing or
distribution provisions but those rights are allocated to the pharmaceutical firm. When
we replace Functional scope with Functional scope II and repeat Models 4 to 7 we obtain
coefficients ranging from negative 0.2432 to negative 0.3374 that are significant at least
at the 5 percent level. As a result, we can reasonably argue that pharmaceutical firms
“pay” for the marketing and/or manufacturing rights with the focal rights. This finding is
unique in that it shows that pharmaceutical firms are able to “trade” or “purchase”
specific rights with other rights and not just financial terms, which we discuss below.24
23
Recall from Section 3.1 we define our focal rights under the headings of intellectual property rights, licensing rights and exit rights.
24 This result allows us to indirectly observe firm preferences for specific control rights. The extant
We follow Higgins (2007) and measure the relative bargaining position of the
pharmaceutical firm using a weighted measure of the firm’s research pipeline, Score.
The rational behind the use of this measure is simple. Pharmaceutical firms that have
weak (or weakening) research pipeline portfolios are in a weakened bargaining position.
As a result, biotechnology firms should be able to take advantage of this weakened
bargaining position and obtain additional rights. We find this to be the case across all
models tested in Table 7. The coefficients on Score are positive and significant ranging
from 0.0740 to 0.0803. Pharmaceutical firms that have healthier research pipelines are in
a stronger negotiating position and as a result are able to extract rights from their
biotechnology partners. The converse is thus also true. This finding is consistent with
Higgins (2007). Clearly, relative bargaining position of the pharmaceutical firm matters
in the allocation of control rights.
Aghion and Bolton (1992), Holmstrom and Tirole (1997), Lerner et al (2003) and
Higgins (2007) find that research projects in earlier stages of development, which are
presumably those with larger information asymmetries and in greater need of financing,
are associated with a transfer of control rights to the pharmaceutical firm. The variable
Late stage equals one if the lead product in the alliance is in Phase II or Phase III clinical
testing. Coefficients in Models 2 to Model 7 range from negative 0.1187 to negative
0.2023 and are significant at least at the 10 percent level. The direct interpretation of
these coefficients imply pharmaceutical firms give up control rights to biotechnology
firms for products in late-stage clinical testing. The inverse interpretation is that rights
are transferred to pharmaceutical firms for projects in earlier stages of development. This
finding is consistent with the aforementioned empirical work but is in contrast to the
theoretical predictions of Aghion and Tirole (1994).
We have already shown that pharmaceutical firms appear to be “trading” or
“paying” for marketing and manufacturing rights with the focal rights being discussed.
Now we consider whether firms are able to “pay” for additional rights with a variety of
financial terms. In order to determine this we focus on the effects of our direct financial
incentives: Milestone dummy, Equity dummy, and Royalty dummy. We also consider the