Munich Personal RePEc Archive
Borderplex Long-Term Economic Trends
to 2026
Fullerton, Thomas M., Jr. and Kelley, Brian W. and Molina,
Angel L., Jr.
University of Texas at El Paso
11 March 2007
Online at
https://mpra.ub.uni-muenchen.de/30522/
Price $10
The University of Texas at El Paso
Border Region
Modeling Project
Business Report SR07-1
BORDERPLEX LONG-TERM
The University
of Texas at El Paso
Borderplex Long-Term
Economic Trends to 2026
Business Report SR07-1
UTEP Border Region Modeling Project
This business report is a publication of the Border Region Modeling Project and the
Depart-ment of Economics & Finance at the University of Texas at El Paso. For additional
Border Region
information, please visit the College of Business Administration section of the
www.utep.edu
UTEP
web site.
Please send comments to Border Region Modeling Project - CBA 236, Department of
Eco-nomics & Finance, 500 West University, El Paso, TX 79968-0543.
UTEP does not discriminate on the basis of race, color, national origin, sex, religion, age, or
disability in employment or the provision of services.
University of Texas at El Paso
Diana Natalicio, President
Richard Jarvis, Provost
Roberto Osegueda, Vice Provost
College of Business Administration
Bob Nachtmann, Dean
Pat Eason, Associate Dean
Steve Johnson, Associate Dean
Tim Roth, Templeton Professor of Banking & Economics
UTEP Border Region Econometric Modeling Project
Corporate and Institutional Sponsors:
El Paso Electric Company
Hunt Communities
Hunt Building Company
Wells Fargo Bank of El Paso
Federal Reserve Bank of Dallas
Universidad Autónoma de Ciudad Juárez
UTEP College of Business Administration
UTEP Department of Economics & Finance
El Paso Metropolitan Planning Organization
UACJ Instituto de Ciencias Sociales y Administración
Special thanks are given to the corporate and institutional sponsors of the UTEP Border
Re-gion Econometric Modeling Project. El Paso Electric Company and The University of Texas at El
Paso have invested substantial time, effort, and financial resources in making this forecasting project
possible. Econometric research assistance for the current edition of the borderplex long-term outlook
was provided by Marycruz De Leon and George Novela.
Continued maintenance and expansion of the UTEP business modeling system requires
ongo-ing financial support. For information on potential means for supportongo-ing this research effort, please
Executive Overview
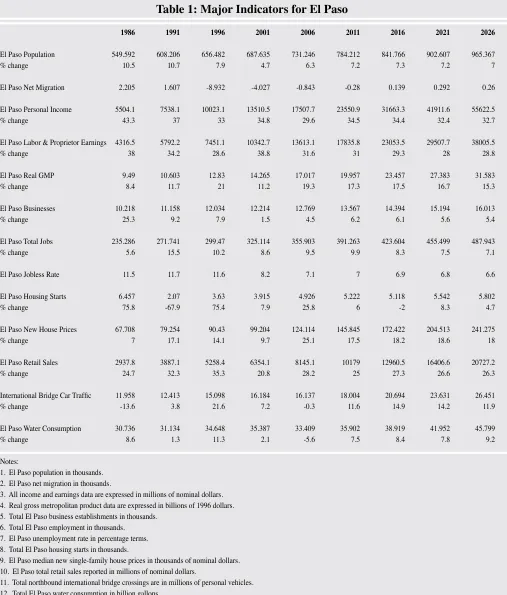
Long-term prospects for the El Paso - Ciudad Juárez
borderplex economy call for steady growth. On the
north side of the border, the population of El Paso is
projected to reach 965 thousand by 2026, the last year
of the forecast period (Table 1). Real gross
metropoli-tan product, the broadest measure of local economic
activity, is expected to increase by more than 85 percent
over the course of the next two decades to more than
$31.5 billion (1996 dollars). Better job market
condi-tions combine with income growth to push total retail
sales above $20.7 billion by the end of the simulation
period. Given this projected state of affairs, the UTEP
Borderplex Econometric Model forecasts housing
starts to average more than 5 thousand units per year
through 2026. Substantially higher single-family home
prices result under these circumstances. Demographic
expansion and business growth jointly lead to greater
demand for water in El Paso. As shown in Table 1,
total consumption will approximate 45.8 billion gallons
per year by the end of the forecast period.
El Paso Demographics
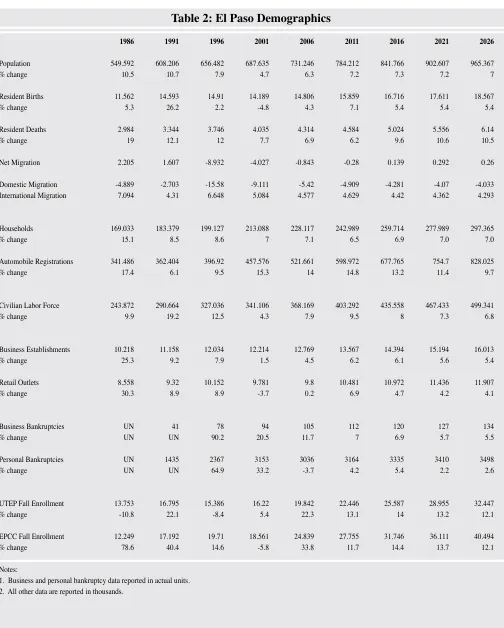
Natural increase is projected to contribute the bulk
of El Paso’s population growth during the next two
decades. Resident births are projected to grow from
just over 14.8 thousand per year in 2006 to nearly 18.6
thousand by 2026. Over the same period, resident
deaths are forecast to grow from approximately 4.3
thousand to approximately 6.1 thousand per year. Net
migration is expected to also contribute to population
growth throughout the simulation period (Table 2).
That is a consequence of substantially stronger job
market performance in El Paso. Much of the latter is
a direct outcome of the BRAC related expansions that
will increase troop levels at Fort Bliss. Because the
local unemployment rate is forecast to close much of
the gap that separates it from its national counterpart,
net domestic out-migration is forecast to drop well
below the levels observed during the 1990s. Given
those trends, the number of households in the Sun City
is should exceed 297.3 thousand by 2026, while
auto-mobile registrations will reach nearly 830 thousand.
Business formation should remain strong, leading to
more than 16 thousand companies in operation by the
end of the forecast period. Of those, more than 11.9
thousand will be retail establishments. Not
surpris-ingly, college enrollments increase steadily under these
conditions.
Employment & the El Paso Labor Market
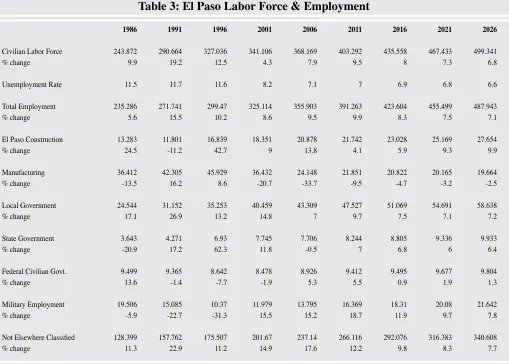
Total employment growth is projected to slightly
out-pace the rate of change for the civilian labor force in
El Paso (Table 3). As a consequence of that scenario,
the unemployment rate trends downward over the
course of the simulation period. The BRAC related
expansions help reverse all of the military employment
losses experienced at Fort Bliss between 1980 and
1996. The large influx of soldiers, civilian personnel,
and their dependents also fuels strong increases in
public school systems and local government payrolls.
Strong rates of expansion are also projected for tertiary
sectors of the metropolitan labor market. Among
BORDERPLEX LONG-TERM
ECONOMIC TRENDS TO 2026
Thomas M. Fullerton, Jr., Brian W. Kelley, and Angel L. Molina, Jr.
Department of Economics & Finance
the latter are health care, communications, business,
education, and professional services. As
manufactur-ing continues to become more capital intensive, labor
requirements across many of its various segments will
decline further. A similar pattern is also predicted for
federal civilian payrolls. Labor quality requirements
for all sectors of the regional economy are intensifying.
Given that, educational attainment will play a central
role in attracting new investment and in determining
worker compensation gains over the course of the next
two decades.
El Paso Personal Income
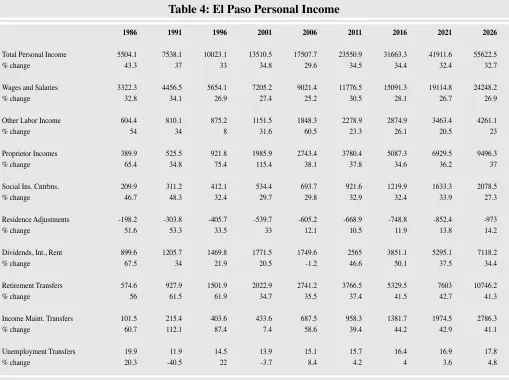
As shown in Table 4, El Paso personal income is
fore-cast to exceed $55.6 billion by 2026. Among the five
largest income components, aging of the baby boom
generation causes retirement transfers to consistently
grow most rapidly during the simulation period. Social
security contributions are also projected to grow
rela-tively quickly as the national retirement wave sweeps
through the United States during the next twenty years.
Wage and salary disbursements are not forecast to keep
pace with other sources of personal income. That is a
continuation of the basic trend that has been observed
during the last two decades in El Paso and the nation
as a whole. A healthy rate of business formation
causes proprietor incomes to expand in step with the
regional economy at-large. Similarly, national
corpo-rate profitability growth translates into rapid growth
for dividends, interest, and rent. Because joblessness
is projected to decline, unemployment transfers are
expected to lag behind other income categories.
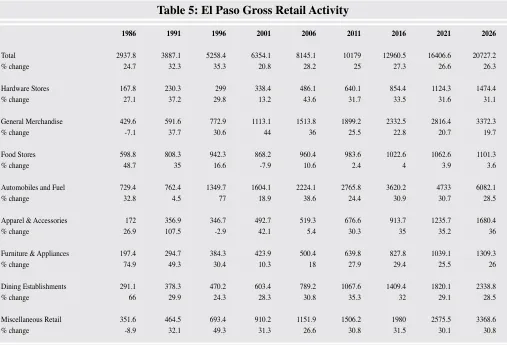
El Paso Retail Sales
Upward trends in demographic and income aggregates
throughout the Borderplex cause retail sales to grow in
El Paso (Table 5). As per capita income performance
improves, it leads to robust rates of expansion for
dining away from home, apparel and accessories, and
automobile sales. Changing family structures also
contribute toward the increases forecast for dining
establishments. Given the latter, overall grocery store
sales expand more slowly than other retail categories.
The outlook for new construction causes furniture
twenty year period under consideration. Total retail
sales are forecast to exceed $20.7 billion by the year
2026.
El Paso Residential Construction & Real Estate
The economic and demographic expansion that is
projected for El Paso causes residential construction
to remain strong over the course of the forecast period
(Table 6). Lower levels of out-migration contribute to
sustained volumes of single-family housing starts that
are substantially higher than those tallied during the
1990s. Total residential construction volumes push
the metropolitan housing stock to greater than 350
thousand units by 2026. Good incomes performance
translates into median prices for both new and
exist-ing units that exceed $210 thousand for sexist-ingle-family
structures by the end of the two decade period in
question. Higher prices, larger units, and moderately
higher mortgage rates combine to push average El
Paso housing payments, exclusive of property taxes
and insurance, to more than $1,300 per month. In
spite of the latter trend, overall affordability improves
as a consequence of sustained income growth in future
years.
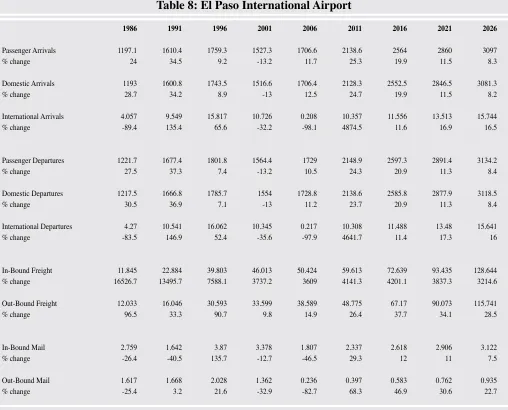
El Paso Air Transportation
Economic expansion, ongoing population growth,
and more rapid business delivery practices combine
to increase the demand for air transportation services
to El Paso and the surrounding Paso del Norte region.
As shown in Table 8, total passenger traffic at El Paso
International Airport is projected to surpass 6.2
mil-lion persons by 2026. Most of the passenger traffic is
expected to be on domestic rather than international
flights. Model simulations indicate that air-borne
freight should more than double from current levels
during the years under consideration. In-bound
de-liveries of inputs and final products are projected to
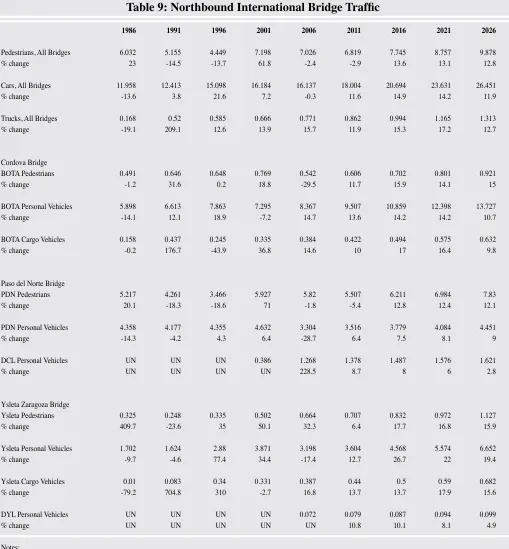
International Bridge Activity
As reported in Table 9, northbound bridge flows from
Ciudad Juárez into El Paso are projected to grow
steadily through the end of the simulation period. By
2026, the total number of pedestrians crossing the
international bridges should exceed 9.8 million. As a
consequence of expanding populations and car
regis-trations on both sides of the river, the total number of
automobile crossings is expected to reach 26.4 million.
Expansion of the maquiladora in-bond assembly sector
throughout the state of Chihuahua continues to result
in increased cargo vehicle flows into Central and East
El Paso. By the end of the forecast period, more than
1.3 million trucks per year are projected to clear U.S.
Customs on this side of the border. The highest
vol-umes of pedestrian traffic are still likely to cross the
downtown Paso del Norte Bridge, while the greatest
numbers of automobiles are projected at the Bridge
of the Americas. Geographic expansion to the east is
likely to cause growth in all three traffic categories at
the Ysleta-Zaragoza point of entry. To reduce
bottle-necks and infrastructure overload at all three bridges,
more regional arteries, personnel, and technology will
be needed to ease the international congestion jointly
faced by El Paso and Ciudad Juárez.
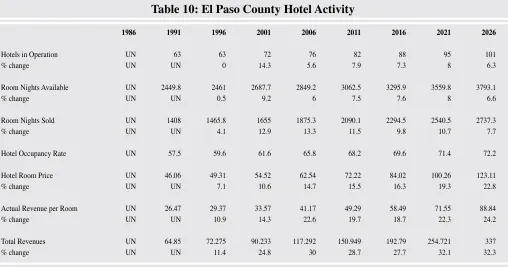
El Paso Hotels
The number of hotels in operation in El Paso County
is forecast to cross the century mark by 2026. That
growth translates into more than 3.75 million room
nights capacity. While the projected rate of
expan-sion in this sector is impressive, it is accompanied
by steadily higher occupancy rates. The latter trend
implies that profitability should remain healthy over
the course of the forecast period. Room rates are
pro-jected to also increase as a consequence of the higher
occupancies. Total revenues are expected to exceed
$335 million in 2026.
El Paso Water Consumption
Water conservation efforts in El Paso have met with
considerable success in recent years. Aggregate usage
per customer is forecast to continue to decline steadily
for much of the forecast period under consideration in
Table 11. Although lower per capita demand levels
are forecast for all four broadly defined customer
categories, the growth in new hook-ups is projected
to more than offset the gains from increased
consump-tion efficiency. Single-family residential meters are
expected surpass 219.2 thousand connections by 2026.
Commercial class accounts are projected to approach
the 10 thousand mark, while not-elsewhere-classified
hook-ups go above 37 thousand that same year.
Ex-pansion of the El Paso Water Utilities customer grid is
thus projected to steadily raise system-wide aggregate
water usage. Model simulations indicate that total
consumption will reach nearly 45.8 billion gallons per
year by the end of the forecast period.
Ciudad Juárez Economic Activity
Good employment opportunities are expected to
en-courage steady volumes of in-migration from central
and southern regions of Mexico to Ciudad Juárez in
coming years (Table 12). That, in combination with
fairly high levels of natural increase, results in
popula-tion of nearly 2.6 million residents in the “Colossus of
the North” by 2026. Strong demographic expansion
plus improving income performance on the south
side of the river cause connections to the municipal
water grid in Ciudad Juárez to grow to 754 thousand
accounts by the end of the simulation period. A
rela-tively progressive rates policy causes a portion of that
growth to be offset by better consumption efficiencies,
but aggregate usage still grows to nearly 318 million
cubic meters per year in 2026. Maquiladora activities
spur many of the expected demographic and industrial
changes. Total in-bond assembly employment is
fore-cast to grow to more than 417 thousand in 2026 (Table
13). More capital intensive investment is expected to
increase plant scales to the point where the number
of employees per factory surpasses the 1,000 mark
by the mid-point of the period under consideration.
Value-added rises steadily due to real per capita output
growth. Hourly wages, inclusive of benefits, should
approximate $6.89 by 2026.
Chihuahua City Economic Activity
percentage terms, employment growth in this
emerg-ing in-bond assembly center will be greater than that
observed in Ciudad Juárez. The latter is accompanied
by an increase in the number of factories in operation in
the state capital, as well as the scale of those operations.
Hourly wages (inclusive of benefits) also increase in
real terms as a result of enhanced productivity.
An-nual output generated at the maquiladora plants in
Chihuahua City is projected to exceed $3.4 billion by
2026. Formal sector jobs increase at a rapid clip for the
period under consideration, growing to more than 346
thousand. Economic expansion also allows population
to expand to greater than 1 million by the end of the
forecast period. Not surprisingly, these circumstances
cause the municipal water grid to expand to more than
361 thousand hook-ups (Table 14). Aggregate water
consumption increases to nearly 95 million cubic
me-ters over the course of the simulation period. Given
the outlook for the metropolitan economy in Chihuahua
City, retail and wholesale activity also expand at fairly
rapid rates.
Las Cruces Economic Conditions
The Las Cruces, New Mexico metropolitan economy is
also projected to expand substantially in future years.
As shown in Table 16, real GMP is projected to more
than double by 2026. Population is forecast to surpass
274 thousand during the same period. Employment
growth in the Greater Mesilla Valley labor market is
expected to benefit from strong demand for workers
in various service-oriented sectors (Table 17). Those
factors help university and college enrollments to trend
upwards, also. Due to the robust long-term outlook for
employment, wage and salary disbursements account
for a large percentage of the increases forecast for
per-sonal income in Doña Ana County (Table 18). Because
of its status as a retirement destination, senior citizen
migration to Las Cruces causes retirement transfers to
grow rapidly, reaching more than $3.8 billion annually
by 2026. Growing numbers of wealthy retirees also
help property incomes to swell to more than $2.7
bil-lion per year by that year.
Historical and Forecast Data
Table 1
Major Indicators for El Paso
Table 2
El Paso Demographics
Table 3
El Paso Labor Force and Employment
Table 4
El Paso Personal Income
Table 5
El Paso Gross Retail Activity
Table 6
El Paso Residential Construction
& Real Estate
Table 7
El Paso Nonresidential Construction
Table 8
El Paso Air Transportation
Table 9
Northbound International Bridge Traffic
Table 10
El Paso Hotel Activity
Table 11
El Paso Water Consumption
Table 12
Ciudad Juárez Demographic Indicators
Table 13
Ciudad Juárez Economic Indicators
Table 14
Chihuahua City Demographic
& Commercial Indicators
Table 15
Chihuahua City Economic Indicators
Table 16
Las Cruces Demographics
& Other Indicators
Table 17
Las Cruces Employment
Table 18
Table 1: Major Indicators for El Paso
1986 1991 1996 2001 2006 2011 2016 2021 2026
El Paso Population 549.592 608.206 656.482 687.635 731.246 784.212 841.766 902.607 965.367 % change 10.5 10.7 7.9 4.7 6.3 7.2 7.3 7.2 7
El Paso Net Migration 2.205 1.607 -8.932 -4.027 -0.843 -0.28 0.139 0.292 0.26
El Paso Personal Income 5504.1 7538.1 10023.1 13510.5 17507.7 23550.9 31663.3 41911.6 55622.5 % change 43.3 37 33 34.8 29.6 34.5 34.4 32.4 32.7
El Paso Labor & Proprietor Earnings 4316.5 5792.2 7451.1 10342.7 13613.1 17835.8 23053.5 29507.7 38005.5 % change 38 34.2 28.6 38.8 31.6 31 29.3 28 28.8
El Paso Real GMP 9.49 10.603 12.83 14.265 17.017 19.957 23.457 27.383 31.583 % change 8.4 11.7 21 11.2 19.3 17.3 17.5 16.7 15.3
El Paso Businesses 10.218 11.158 12.034 12.214 12.769 13.567 14.394 15.194 16.013 % change 25.3 9.2 7.9 1.5 4.5 6.2 6.1 5.6 5.4
El Paso Total Jobs 235.286 271.741 299.47 325.114 355.903 391.263 423.604 455.499 487.943 % change 5.6 15.5 10.2 8.6 9.5 9.9 8.3 7.5 7.1
El Paso Jobless Rate 11.5 11.7 11.6 8.2 7.1 7 6.9 6.8 6.6
El Paso Housing Starts 6.457 2.07 3.63 3.915 4.926 5.222 5.118 5.542 5.802 % change 75.8 -67.9 75.4 7.9 25.8 6 -2 8.3 4.7
El Paso New House Prices 67.708 79.254 90.43 99.204 124.114 145.845 172.422 204.513 241.275 % change 7 17.1 14.1 9.7 25.1 17.5 18.2 18.6 18
El Paso Retail Sales 2937.8 3887.1 5258.4 6354.1 8145.1 10179 12960.5 16406.6 20727.2 % change 24.7 32.3 35.3 20.8 28.2 25 27.3 26.6 26.3
International Bridge Car Traffic 11.958 12.413 15.098 16.184 16.137 18.004 20.694 23.631 26.451
% change -13.6 3.8 21.6 7.2 -0.3 11.6 14.9 14.2 11.9
El Paso Water Consumption 30.736 31.134 34.648 35.387 33.409 35.902 38.919 41.952 45.799 % change 8.6 1.3 11.3 2.1 -5.6 7.5 8.4 7.8 9.2
Notes:
1. El Paso population in thousands. 2. El Paso net migration in thousands.
3. All income and earnings data are expressed in millions of nominal dollars. 4. Real gross metropolitan product data are expressed in billions of 1996 dollars. 5. Total El Paso business establishments in thousands.
6. Total El Paso employment in thousands. 7. El Paso unemployment rate in percentage terms. 8. Total El Paso housing starts in thousands.
9. El Paso median new single-family house prices in thousands of nominal dollars. 10. El Paso total retail sales reported in millions of nominal dollars.
Table 2: El Paso Demographics
1986 1991 1996 2001 2006 2011 2016 2021 2026
Population 549.592 608.206 656.482 687.635 731.246 784.212 841.766 902.607 965.367 % change 10.5 10.7 7.9 4.7 6.3 7.2 7.3 7.2 7
Resident Births 11.562 14.593 14.91 14.189 14.806 15.859 16.716 17.611 18.567 % change 5.3 26.2 2.2 -4.8 4.3 7.1 5.4 5.4 5.4
Resident Deaths 2.984 3.344 3.746 4.035 4.314 4.584 5.024 5.556 6.14 % change 19 12.1 12 7.7 6.9 6.2 9.6 10.6 10.5
Net Migration 2.205 1.607 -8.932 -4.027 -0.843 -0.28 0.139 0.292 0.26
Domestic Migration -4.889 -2.703 -15.58 -9.111 -5.42 -4.909 -4.281 -4.07 -4.033 International Migration 7.094 4.31 6.648 5.084 4.577 4.629 4.42 4.362 4.293
Households 169.033 183.379 199.127 213.088 228.117 242.989 259.714 277.989 297.365 % change 15.1 8.5 8.6 7 7.1 6.5 6.9 7.0 7.0
Automobile Registrations 341.486 362.404 396.92 457.576 521.661 598.972 677.765 754.7 828.025 % change 17.4 6.1 9.5 15.3 14 14.8 13.2 11.4 9.7
Civilian Labor Force 243.872 290.664 327.036 341.106 368.169 403.292 435.558 467.433 499.341 % change 9.9 19.2 12.5 4.3 7.9 9.5 8 7.3 6.8
Business Establishments 10.218 11.158 12.034 12.214 12.769 13.567 14.394 15.194 16.013 % change 25.3 9.2 7.9 1.5 4.5 6.2 6.1 5.6 5.4
Retail Outlets 8.558 9.32 10.152 9.781 9.8 10.481 10.972 11.436 11.907 % change 30.3 8.9 8.9 -3.7 0.2 6.9 4.7 4.2 4.1
Business Bankruptcies UN 41 78 94 105 112 120 127 134 % change UN UN 90.2 20.5 11.7 7 6.9 5.7 5.5
Personal Bankruptcies UN 1435 2367 3153 3036 3164 3335 3410 3498 % change UN UN 64.9 33.2 -3.7 4.2 5.4 2.2 2.6
UTEP Fall Enrollment 13.753 16.795 15.386 16.22 19.842 22.446 25.587 28.955 32.447 % change -10.8 22.1 -8.4 5.4 22.3 13.1 14 13.2 12.1
EPCC Fall Enrollment 12.249 17.192 19.71 18.561 24.839 27.755 31.746 36.111 40.494 % change 78.6 40.4 14.6 -5.8 33.8 11.7 14.4 13.7 12.1
Notes:
Table 3: El Paso Labor Force & Employment
1986 1991 1996 2001 2006 2011 2016 2021 2026
Civilian Labor Force 243.872 290.664 327.036 341.106 368.169 403.292 435.558 467.433 499.341 % change 9.9 19.2 12.5 4.3 7.9 9.5 8 7.3 6.8
Unemployment Rate 11.5 11.7 11.6 8.2 7.1 7 6.9 6.8 6.6
Total Employment 235.286 271.741 299.47 325.114 355.903 391.263 423.604 455.499 487.943 % change 5.6 15.5 10.2 8.6 9.5 9.9 8.3 7.5 7.1
El Paso Construction 13.283 11.801 16.839 18.351 20.878 21.742 23.028 25.169 27.654 % change 24.5 -11.2 42.7 9 13.8 4.1 5.9 9.3 9.9
Manufacturing 36.412 42.305 45.929 36.432 24.148 21.851 20.822 20.165 19.664 % change -13.5 16.2 8.6 -20.7 -33.7 -9.5 -4.7 -3.2 -2.5
Local Government 24.544 31.152 35.253 40.459 43.309 47.527 51.069 54.691 58.638 % change 17.1 26.9 13.2 14.8 7 9.7 7.5 7.1 7.2
State Government 3.643 4.271 6.93 7.745 7.706 8.244 8.805 9.336 9.933 % change -20.9 17.2 62.3 11.8 -0.5 7 6.8 6 6.4
Federal Civilian Govt. 9.499 9.365 8.642 8.478 8.926 9.412 9.495 9.677 9.804 % change 13.6 -1.4 -7.7 -1.9 5.3 5.5 0.9 1.9 1.3
Military Employment 19.506 15.085 10.37 11.979 13.795 16.369 18.31 20.08 21.642 % change -5.9 -22.7 -31.3 15.5 15.2 18.7 11.9 9.7 7.8
Not Elsewhere Classified 128.399 157.762 175.507 201.67 237.14 266.116 292.076 316.383 340.608
% change 11.3 22.9 11.2 14.9 17.6 12.2 9.8 8.3 7.7
Notes:
1. Labor force data are in thousands 2. Unemployment rate data are in percentages. 3. Employment data are in thousands.
Table 4: El Paso Personal Income
1986 1991 1996 2001 2006 2011 2016 2021 2026
Total Personal Income 5504.1 7538.1 10023.1 13510.5 17507.7 23550.9 31663.3 41911.6 55622.5 % change 43.3 37 33 34.8 29.6 34.5 34.4 32.4 32.7
Wages and Salaries 3322.3 4456.5 5654.1 7205.2 9021.4 11776.5 15091.3 19114.8 24248.2 % change 32.8 34.1 26.9 27.4 25.2 30.5 28.1 26.7 26.9
Other Labor Income 604.4 810.1 875.2 1151.5 1848.3 2278.9 2874.9 3463.4 4261.1 % change 54 34 8 31.6 60.5 23.3 26.1 20.5 23
Proprietor Incomes 389.9 525.5 921.8 1985.9 2743.4 3780.4 5087.3 6929.5 9496.3 % change 65.4 34.8 75.4 115.4 38.1 37.8 34.6 36.2 37
Social Ins. Cntrbns. 209.9 311.2 412.1 534.4 693.7 921.6 1219.9 1633.3 2078.5 % change 46.7 48.3 32.4 29.7 29.8 32.9 32.4 33.9 27.3
Residence Adjustments -198.2 -303.8 -405.7 -539.7 -605.2 -668.9 -748.8 -852.4 -973 % change 51.6 53.3 33.5 33 12.1 10.5 11.9 13.8 14.2
Dividends, Int., Rent 899.6 1205.7 1469.8 1771.5 1749.6 2565 3851.1 5295.1 7118.2 % change 67.5 34 21.9 20.5 -1.2 46.6 50.1 37.5 34.4
Retirement Transfers 574.6 927.9 1501.9 2022.9 2741.2 3766.5 5329.5 7603 10746.2 % change 56 61.5 61.9 34.7 35.5 37.4 41.5 42.7 41.3
Income Maint. Transfers 101.5 215.4 403.6 433.6 687.5 958.3 1381.7 1974.5 2786.3 % change 60.7 112.1 87.4 7.4 58.6 39.4 44.2 42.9 41.1
Unemployment Transfers 19.9 11.9 14.5 13.9 15.1 15.7 16.4 16.9 17.8 % change 20.3 -40.5 22 -3.7 8.4 4.2 4 3.6 4.8
Notes:
1. All income data are expressed in millions of dollars.
2. Social insurance contributions are deducted from total regional income estimates. 3. Retirement transfer payments include social security and other retirement payments.
Table 5: El Paso Gross Retail Activity
1986 1991 1996 2001 2006 2011 2016 2021 2026
Total 2937.8 3887.1 5258.4 6354.1 8145.1 10179 12960.5 16406.6 20727.2 % change 24.7 32.3 35.3 20.8 28.2 25 27.3 26.6 26.3 Hardware Stores 167.8 230.3 299 338.4 486.1 640.1 854.4 1124.3 1474.4 % change 27.1 37.2 29.8 13.2 43.6 31.7 33.5 31.6 31.1 General Merchandise 429.6 591.6 772.9 1113.1 1513.8 1899.2 2332.5 2816.4 3372.3 % change -7.1 37.7 30.6 44 36 25.5 22.8 20.7 19.7 Food Stores 598.8 808.3 942.3 868.2 960.4 983.6 1022.6 1062.6 1101.3 % change 48.7 35 16.6 -7.9 10.6 2.4 4 3.9 3.6 Automobiles and Fuel 729.4 762.4 1349.7 1604.1 2224.1 2765.8 3620.2 4733 6082.1 % change 32.8 4.5 77 18.9 38.6 24.4 30.9 30.7 28.5 Apparel & Accessories 172 356.9 346.7 492.7 519.3 676.6 913.7 1235.7 1680.4 % change 26.9 107.5 -2.9 42.1 5.4 30.3 35 35.2 36 Furniture & Appliances 197.4 294.7 384.3 423.9 500.4 639.8 827.8 1039.1 1309.3 % change 74.9 49.3 30.4 10.3 18 27.9 29.4 25.5 26 Dining Establishments 291.1 378.3 470.2 603.4 789.2 1067.6 1409.4 1820.1 2338.8 % change 66 29.9 24.3 28.3 30.8 35.3 32 29.1 28.5 Miscellaneous Retail 351.6 464.5 693.4 910.2 1151.9 1506.2 1980 2575.5 3368.6 % change -8.9 32.1 49.3 31.3 26.6 30.8 31.5 30.1 30.8
Notes:
1. All sales figures are expressed in millions of dollars.
2. Hardware stores include hardware, garden supply, and building materials stores, plus mobile home dealers. 3. General merchandise stores include department, variety, and miscellaneous dry goods stores.
4. Food stores include grocery stores, seafood markets, vegetable stands, candy stores, bakeries, and dairy outlets.
5. Automobiles and fuel includes car and motorcycle dealers, auto parts stores, gasoline service stations, water and rec. vehicle dealers. 6. Dining establishments include restaurants, caterers, ice cream parlors, cafes, bars and nightclubs.
Table 6: El Paso Residential Construction & Real Estate
1986 1991 1996 2001 2006 2011 2016 2021 2026
Total Housing Starts 6.457 2.07 3.63 3.915 4.926 5.222 5.118 5.542 5.802 % change 75.8 -67.9 75.4 7.9 25.8 6 -2 8.3 4.7
Single-Family Starts 4.637 1.9 2.6 3.762 4.093 4.216 4.315 4.719 4.946 % change 81.3 -59 36.8 44.7 8.8 3 2.4 9.4 4.8
Multi-Family Starts 1.82 0.17 1.03 0.153 0.832 1.006 0.803 0.823 0.857 % change 63.1 -90.7 505.9 -85.1 443.9 20.9 -20.2 2.5 4.1
Total Housing Stock 207.8 225.3 235 248.1 269.7 293.4 314.5 331.8 352 % change 15.3 8.4 4.3 5.6 8.7 8.8 7.2 5.5 6.1
Single-Family Stock 148.1 163.1 171.3 183.7 203.8 224.6 243.4 259.1 278 % change 10.8 10.1 5 7.2 10.9 10.2 8.4 6.5 7.3
Multi-Family Stock 59.6 62.2 63.7 64.4 65.9 68.8 71.1 72.7 74 % change 28.1 4.3 2.4 1.2 2.2 4.5 3.4 2.1 1.8
Median New Price 67.708 79.254 90.43 99.204 124.114 145.845 172.422 204.513 241.275 % change 7 17.1 14.1 9.7 25.1 17.5 18.2 18.6 18
Median Resale Price 59.05 65.85 76.075 86.25 114.325 131.617 155.434 184.784 218.448 % change -2.7 11.5 15.5 13.4 32.6 15.1 18.1 18.9 18.2
Average Monthly Payment 492 522 530 559 671 831 974 1139 1337 % change -25.7 6.1 1.6 5.4 20 23.8 17.2 17 17.4
Affordability Index 148.4 179.7 211.4 241.9 232.3 239.8 255.1 269.2 283.8 % change 61.9 21.1 17.6 14.4 -4 3.2 6.4 5.5 5.4
Existing Units Sold 6.197 8.536 9.773 14.901 22.536 23.993 26.538 29.563 32.958 % change -16.4 37.7 14.5 52.5 51.2 6.5 10.6 11.4 11.5
Notes:
1. Housing start and stock data are in thousands.
2. Affordability index increases as household income strengthens relative to mortgage payments. 3. Average monthly mortgage payment is in current dollars.
4. Existing housing units sold includes both stand-alone and multi-family units.
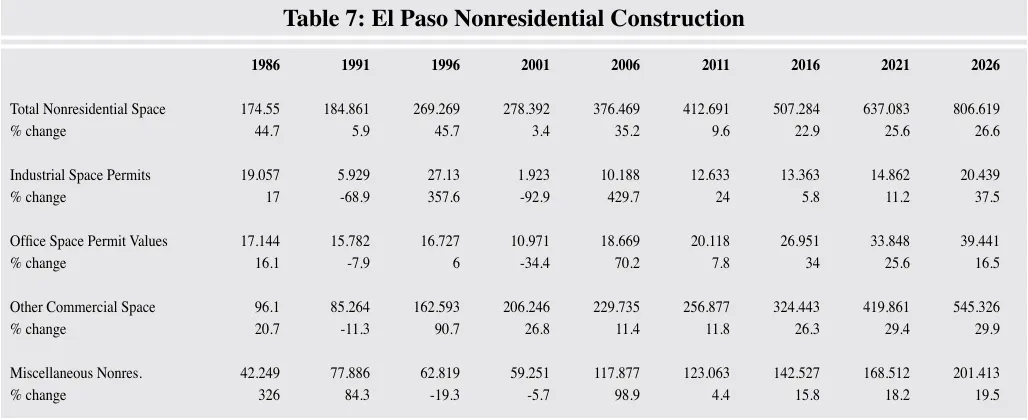
Table 7: El Paso Nonresidential Construction
1986 1991 1996 2001 2006 2011 2016 2021 2026
Total Nonresidential Space 174.55 184.861 269.269 278.392 376.469 412.691 507.284 637.083 806.619 % change 44.7 5.9 45.7 3.4 35.2 9.6 22.9 25.6 26.6
Industrial Space Permits 19.057 5.929 27.13 1.923 10.188 12.633 13.363 14.862 20.439 % change 17 -68.9 357.6 -92.9 429.7 24 5.8 11.2 37.5
Office Space Permit Values 17.144 15.782 16.727 10.971 18.669 20.118 26.951 33.848 39.441
% change 16.1 -7.9 6 -34.4 70.2 7.8 34 25.6 16.5
Other Commercial Space 96.1 85.264 162.593 206.246 229.735 256.877 324.443 419.861 545.326 % change 20.7 -11.3 90.7 26.8 11.4 11.8 26.3 29.4 29.9
Miscellaneous Nonres. 42.249 77.886 62.819 59.251 117.877 123.063 142.527 168.512 201.413 % change 326 84.3 -19.3 -5.7 98.9 4.4 15.8 18.2 19.5
Notes:
1. All nonresidential construction permits data are quoted in millions of dollars.
Table 8: El Paso International Airport
1986 1991 1996 2001 2006 2011 2016 2021 2026
Passenger Arrivals 1197.1 1610.4 1759.3 1527.3 1706.6 2138.6 2564 2860 3097 % change 24 34.5 9.2 -13.2 11.7 25.3 19.9 11.5 8.3
Domestic Arrivals 1193 1600.8 1743.5 1516.6 1706.4 2128.3 2552.5 2846.5 3081.3 % change 28.7 34.2 8.9 -13 12.5 24.7 19.9 11.5 8.2
International Arrivals 4.057 9.549 15.817 10.726 0.208 10.357 11.556 13.513 15.744 % change -89.4 135.4 65.6 -32.2 -98.1 4874.5 11.6 16.9 16.5
Passenger Departures 1221.7 1677.4 1801.8 1564.4 1729 2148.9 2597.3 2891.4 3134.2 % change 27.5 37.3 7.4 -13.2 10.5 24.3 20.9 11.3 8.4
Domestic Departures 1217.5 1666.8 1785.7 1554 1728.8 2138.6 2585.8 2877.9 3118.5 % change 30.5 36.9 7.1 -13 11.2 23.7 20.9 11.3 8.4
International Departures 4.27 10.541 16.062 10.345 0.217 10.308 11.488 13.48 15.641 % change -83.5 146.9 52.4 -35.6 -97.9 4641.7 11.4 17.3 16
In-Bound Freight 11.845 22.884 39.803 46.013 50.424 59.613 72.639 93.435 128.644 % change 16526.7 13495.7 7588.1 3737.2 3609 4141.3 4201.1 3837.3 3214.6
Out-Bound Freight 12.033 16.046 30.593 33.599 38.589 48.775 67.17 90.073 115.741 % change 96.5 33.3 90.7 9.8 14.9 26.4 37.7 34.1 28.5
In-Bound Mail 2.759 1.642 3.87 3.378 1.807 2.337 2.618 2.906 3.122 % change -26.4 -40.5 135.7 -12.7 -46.5 29.3 12 11 7.5
Out-Bound Mail 1.617 1.668 2.028 1.362 0.236 0.397 0.583 0.762 0.935 % change -25.4 3.2 21.6 -32.9 -82.7 68.3 46.9 30.6 22.7
Notes:
Table 9: Northbound International Bridge Traffic
1986 1991 1996 2001 2006 2011 2016 2021 2026
Pedestrians, All Bridges 6.032 5.155 4.449 7.198 7.026 6.819 7.745 8.757 9.878 % change 23 -14.5 -13.7 61.8 -2.4 -2.9 13.6 13.1 12.8
Cars, All Bridges 11.958 12.413 15.098 16.184 16.137 18.004 20.694 23.631 26.451 % change -13.6 3.8 21.6 7.2 -0.3 11.6 14.9 14.2 11.9
Trucks, All Bridges 0.168 0.52 0.585 0.666 0.771 0.862 0.994 1.165 1.313 % change -19.1 209.1 12.6 13.9 15.7 11.9 15.3 17.2 12.7
Cordova Bridge
BOTA Pedestrians 0.491 0.646 0.648 0.769 0.542 0.606 0.702 0.801 0.921 % change -1.2 31.6 0.2 18.8 -29.5 11.7 15.9 14.1 15
BOTA Personal Vehicles 5.898 6.613 7.863 7.295 8.367 9.507 10.859 12.398 13.727 % change -14.1 12.1 18.9 -7.2 14.7 13.6 14.2 14.2 10.7
BOTA Cargo Vehicles 0.158 0.437 0.245 0.335 0.384 0.422 0.494 0.575 0.632 % change -0.2 176.7 -43.9 36.8 14.6 10 17 16.4 9.8
Paso del Norte Bridge
PDN Pedestrians 5.217 4.261 3.466 5.927 5.82 5.507 6.211 6.984 7.83 % change 20.1 -18.3 -18.6 71 -1.8 -5.4 12.8 12.4 12.1
PDN Personal Vehicles 4.358 4.177 4.355 4.632 3.304 3.516 3.779 4.084 4.451 % change -14.3 -4.2 4.3 6.4 -28.7 6.4 7.5 8.1 9
DCL Personal Vehicles UN UN UN 0.386 1.268 1.378 1.487 1.576 1.621 % change UN UN UN UN 228.5 8.7 8 6 2.8
Ysleta Zaragoza Bridge
Ysleta Pedestrians 0.325 0.248 0.335 0.502 0.664 0.707 0.832 0.972 1.127 % change 409.7 -23.6 35 50.1 32.3 6.4 17.7 16.8 15.9
Ysleta Personal Vehicles 1.702 1.624 2.88 3.871 3.198 3.604 4.568 5.574 6.652 % change -9.7 -4.6 77.4 34.4 -17.4 12.7 26.7 22 19.4
Ysleta Cargo Vehicles 0.01 0.083 0.34 0.331 0.387 0.44 0.5 0.59 0.682 % change -79.2 704.8 310 -2.7 16.8 13.7 13.7 17.9 15.6
DYL Personal Vehicles UN UN UN UN 0.072 0.079 0.087 0.094 0.099 % change UN UN UN UN UN 10.8 10.1 8.1 4.9
Notes:
1. All bridge data are for northbound traffic categories into the City of El Paso.
2. Pedestrian, personal vehicle (cars, light trucks, mini-vans), and cargo vehicle data are reported in millions.
Table 10: El Paso County Hotel Activity
1986 1991 1996 2001 2006 2011 2016 2021 2026
Hotels in Operation UN 63 63 72 76 82 88 95 101 % change UN UN 0 14.3 5.6 7.9 7.3 8 6.3
Room Nights Available UN 2449.8 2461 2687.7 2849.2 3062.5 3295.9 3559.8 3793.1 % change UN UN 0.5 9.2 6 7.5 7.6 8 6.6
Room Nights Sold UN 1408 1465.8 1655 1875.3 2090.1 2294.5 2540.5 2737.3 % change UN UN 4.1 12.9 13.3 11.5 9.8 10.7 7.7
Hotel Occupancy Rate UN 57.5 59.6 61.6 65.8 68.2 69.6 71.4 72.2
Hotel Room Price UN 46.06 49.31 54.52 62.54 72.22 84.02 100.26 123.11 % change UN UN 7.1 10.6 14.7 15.5 16.3 19.3 22.8
Actual Revenue per Room UN 26.47 29.37 33.57 41.17 49.29 58.49 71.55 88.84 % change UN UN 10.9 14.3 22.6 19.7 18.7 22.3 24.2
Total Revenues UN 64.85 72.275 90.233 117.292 150.949 192.79 254.721 337 % change UN UN 11.4 24.8 30 28.7 27.7 32.1 32.3
Notes:
Table 11: El Paso Water Consumption
1986 1991 1996 2001 2006 2011 2016 2021 2026
Total Water Customers 118.768 131.71 148.14 167.448 189.846 212.125 232.328 250.174 271.419 % change 14.1 10.9 12.5 13 13.4 11.7 9.5 7.7 8.5
Single-Family Meters 104.044 112.612 123.432 136.286 154.293 172.195 188.765 202.556 219.218 % change 14.6 8.2 9.6 10.4 13.2 11.6 9.6 7.3 8.2
Multi-Family Meters 4.881 4.918 4.764 4.73 4.765 4.815 4.861 4.9 4.937 % change 2.5 0.8 -3.1 -0.7 0.7 1.1 1 0.8 0.7
Commercial Business Meters 7.457 7.622 8.224 8.973 8.583 8.953 9.296 9.627 9.955 % change 10.8 2.2 7.9 9.1 -4.4 4.3 3.8 3.6 3.4
Industrial Business Meters 0.125 0.199 0.196 0.206 0.184 0.188 0.194 0.202 0.213 % change 30.2 59.2 -1.5 5.1 -10.7 2 3.3 4.2 5.3
Other Meter Connections 2.261 6.359 11.524 17.253 22.022 25.973 29.213 32.888 37.097 % change 29.3 181.2 81.2 49.7 27.6 17.9 12.5 12.6 12.8
Total Water Consumed 30.736 31.134 34.648 35.387 33.409 35.902 38.919 41.952 45.799 % change 8.6 1.3 11.3 2.1 -5.6 7.5 8.4 7.8 9.2
Single-Family Gallons 17.341 16.044 18.803 19.932 18.992 20.877 22.824 24.533 26.741 % change 9.3 -7.5 17.2 6 -4.7 9.9 9.3 7.5 9
Multi-Family Gallons 3.366 4.033 3.521 3.525 3.15 3.113 3.166 3.175 3.243 % change 24 19.8 -12.7 0.1 -10.6 -1.2 1.7 0.3 2.1
Commercial Gallons Cons. 5.622 4.264 4.363 4.37 3.882 4.018 4.201 4.392 4.585 % change 7.6 -24.1 2.3 0.2 -11.2 3.5 4.6 4.6 4.4
Industrial Gallons Consumed 0.614 3.15 1.176 0.496 0.435 0.405 0.427 0.451 0.484 % change -33.9 413 -62.7 -57.8 -12.4 -6.9 5.5 5.6 7.3
Other Water Consumption 3.793 3.642 6.786 7.064 6.95 7.49 8.301 9.4 10.746 % change 6.1 -4 86.3 4.1 -1.6 7.8 10.8 13.2 14.3
Notes:
1. Water customer meter connections are reported in thousands. 2. El Paso water consumption data are reported in billion gallons.
Table 12: Ciudad Juarez Demographic Indicators
1986 1991 1996 2001 2006 2011 2016 2021 2026
Ciudad Juarez Population 701.489 832.834 1057.316 1297.379 1510.132 1765.547 2051.223 2339.896 2591.215 % change 19.3 18.7 27 22.7 16.4 16.9 16.2 14.1 10.7
Resident Births 19.342 18.858 24.873 33.42 29.052 33.839 38.169 42.571 46.608 % change 6.1 -2.5 31.9 34.4 -13.1 16.5 12.8 11.5 9.5
Resident Deaths 4.471 4.184 5.028 5.822 6.393 7.243 8.149 9.169 10.292 % change 20 -6.4 20.2 15.8 9.8 13.3 12.5 12.5 12.2
Net Migration 9.505 19.661 25.685 50.964 26.814 27.073 29.35 22.389 10.093
Domestic Migration 16.599 23.971 32.333 56.048 31.39 31.703 33.77 26.751 14.386 International Migration -7.094 -4.31 -6.648 -5.084 -4.577 -4.629 -4.42 -4.362 -4.293
Cd. Juarez Water Meters 119.821 171.87 219.007 273.954 355.909 441.455 537.437 643.537 753.981 % change 37 43.4 27.4 25.1 29.9 24 21.7 19.7 17.2
Total Water Consumption 88.99 120.599 141.098 160.205 172.968 207.3 242.83 280.246 317.79 % change 22.9 35.5 17 13.5 8 19.8 17.1 15.4 13.4
Notes:
Table 13: Ciudad Juarez Economic Indicators
1986 1991 1996 2001 2006 2011 2016 2021 2026
Total Maquiladora Emp. 86.526 123.971 172.926 228.445 230.169 288.49 339.219 384.238 417.427 % change 96.7 43.3 39.5 32.1 0.8 25.3 17.6 13.3 8.6
Juarez Maquiladora Plants 180 255 264 307 294 307 317 323 328 % change 45.2 41.7 3.5 16.3 -4.2 4.4 3.3 1.9 1.5
Average Hourly Wages 1.03 2.08 2.03 3.86 4.35 4.9 5.48 6.11 6.89 % change -49.5 101.5 -2.4 89.9 12.8 12.5 11.7 11.7 12.8
Total Value Added 457.4 1097.3 1444.7 3535.2 4164.9 5910.4 7738.6 9699 11740.4 % change 24.2 139.9 31.7 144.7 17.8 41.9 30.9 25.3 21
Total Formal Sector Emp. UN 213.482 286.51 375.988 381.954 489.825 579.15 659.326 718.761 % change UN UN 34.2 31.2 1.6 28.2 18.2 13.8 9
Total Mfg. Employment UN 136.329 195.642 248.757 239.069 303.473 357.144 403.761 436.433 % change UN UN 43.5 27.1 -3.9 26.9 17.7 13.1 8.1
Commerce Employment UN 29.449 26.402 40.2 42.08 54.004 63.997 73.778 82.223 % change UN UN -10.3 52.3 4.7 28.3 18.5 15.3 11.4
Regulated Industry Emp. UN 5.713 6.856 11.851 11.92 15.978 20.25 24.178 27.363 % change UN UN 20 72.9 0.6 34 26.7 19.4 13.2
Services & Other Emp. UN 41.991 57.61 75.18 88.885 116.37 137.759 157.609 172.742 % change UN UN 37.2 30.5 18.2 30.9 18.4 14.4 9.6
Retail Sales Activity UN UN 92.9 95.4 126.1 162.6 195.6 227.1 254.2 % change UN UN UN 2.7 32.2 29 20.3 16.1 11.9
Wholesale Activity UN UN 85.9 114 101.5 136.2 167.6 198.9 230.4 % change UN UN UN 32.7 -11 34.2 23 18.7 15.9
Notes:
1. Ciudad Juarez employment data are reported in thousands.
2. Ciudad Juarez maquiladora hourly wages are reported in nominal dollar equivalents and include benefits.
3. The maquiladora industry standard work week is 45 hours.
4. Ciudad Juarez maquiladora value-added data are expressed in millions of nominal dollars. 5. Ciudad Juarez formal sector jobs are those covered by the social security system in Mexico. 6. Regulated sectors include transportation, communications, and public utilities.
Table 14: Chihuahua City Demographic & Commercial Indicators
1986 1991 1996 2001 2006 2011 2016 2021 2026
Chihuahua City Population 482.169 548.902 636.282 694.426 740.148 805.563 872.725 941.009 1010.434 % change 14.3 13.8 15.9 9.1 6.6 8.8 8.3 7.8 7.4
Chihuahua City Water Meters UN 75.45 127.469 186.026 225.402 263.24 296.918 329.485 361.982 % change UN UN 68.9 45.9 21.2 16.8 12.8 11 9.9
Total Water Consumption UN 47.85 55.006 64.149 61.721 72.325 79.683 86.977 94.58 % change UN UN 15 16.6 -3.8 17.2 10.2 9.2 8.7
Retail Activity Index UN UN 82.2 99.2 128.7 155.6 184.7 216.8 243 % change UN UN UN 20.7 29.8 20.9 18.7 17.4 12.1
Wholesale Activity Index UN UN 76.4 97.2 104.4 122.3 145.2 169.4 191 % change UN UN UN 27.2 7.4 17.2 18.7 16.7 12.8
Notes:
1. Chihuahua City population and water meter data are reported in thousands. 2. Chihuahua City water consumption data are reported in million cubic meters.
Table 15: Chihuahua City Economic Indicators
1986 1991 1996 2001 2006 2011 2016 2021 2026
Total Maquiladora Emp. 20.751 31.498 33.069 42.99 45.864 60.961 73.671 86.108 100.515 % change 311.9 51.8 5 30 6.7 32.9 20.8 16.9 16.7
Chihuahua City Maq. Plants 41 57 67 81 76 84 89 94 99 % change 78.3 39 17.5 20.9 -6.2 10.5 6 5.6 5.3
Maq. Average Hourly Wages 0.89 2.02 2.09 4.65 4.83 5.42 6.05 6.78 7.62 % change -46.9 127.9 3.5 122.3 3.9 12.2 11.6 12.1 12.3
Total Value Added 81.5 270.6 325.1 991.4 1057.6 1592.9 2107.4 2702.3 3467.3 % change 118.9 232.2 20.1 204.9 6.7 50.6 32.3 28.2 28.3
Total Formal Sector Emp. UN 131.633 137.348 180.359 183.931 235.478 273.083 310.233 346.693 % change UN UN 4.3 31.3 2 28 16 13.6 11.8
Total Mfg. Employment UN 44.582 57.271 80.755 71.43 88.092 101.469 111.199 119.361 % change UN UN 28.5 41 -11.5 23.3 15.2 9.6 7.3
Commerce Employment UN 17.524 21.682 32.982 36.915 50.197 64.632 79.104 93.536 % change UN UN 23.7 52.1 11.9 36 28.8 22.4 18.2
Regulated Industry Emp. UN 10.765 9.183 9.001 9.187 10.948 12.509 14.041 15.568 % change UN UN -14.7 -2 2.1 19.2 14.3 12.2 10.9
Services & Other Emp. UN 58.762 49.212 57.621 66.398 86.241 94.473 105.889 118.229 % change UN UN -16.3 17.1 15.2 29.9 9.5 12.1 11.7
Notes:
1. Chihuahua City employment data are reported in thousands.
2. Chihuahua City maquiladora hourly wages are reported in nominal dollars and include benefits.
3. The maquiladora industry standard work week is 45 hours.
Table 16: Las Cruces Demographic & Other Indicators
1986 1991 1996 2001 2006 2011 2016 2021 2026
Population 120.474 141.228 165.618 176.598 193.536 214.909 234.59 253.982 274.178 % change 20.9 17.2 17.3 6.6 9.6 11 9.2 8.3 8
Business Establishments 2.21 2.626 3.084 3.226 3.573 3.904 4.138 4.346 4.573 % change 42.8 18.8 17.4 4.6 10.8 9.3 6 5 5.2
Business Bankruptcies UN 18 49 65 67 74 79 84 89 % change UN UN 172.2 32.7 3.1 10.4 6.8 6.3 6
Personal Bankruptcies UN 353 382 626 906 938 973 991 1020 % change UN UN 8.2 63.9 44.7 3.6 3.7 1.9 2.9
NMSU Fall Enrollment 13.718 15.344 14.748 15.224 16.264 18.045 19.835 21.876 24.009 % change 10.5 11.9 -3.9 3.2 6.8 11 9.9 10.3 9.7
DABCC Fall Enrollment 0.625 3.423 3.883 4.717 6.921 8.705 10.534 12.259 13.706 % change UN 447.7 13.4 21.5 46.7 25.8 21 16.4 11.8
Personal Income 1283.8 1847.4 2550.4 3460 4651.9 6564.4 9064.9 12195.1 16304.2 % change 65 43.9 38.1 35.7 34.4 41.1 38.1 34.5 33.7
Labor and Proprietor Earnings 891.5 1220.1 1549.2 2068.1 2944.5 3994.2 5265.4 6809.8 8805 % change 58 36.8 27 33.5 42.4 35.7 31.8 29.3 29.3
Real GMP 1.821 2.136 2.379 2.686 3.576 4.512 5.501 6.689 8.169 % change 23.9 17.3 11.4 12.9 33.1 26.2 21.9 21.6 22.1
Total Employment 50.221 60.362 67.48 76.905 89.725 101.593 111.487 120.512 129.733 % change 24.7 20.2 11.8 14 16.7 13.2 9.7 8.1 7.7
Notes:
1. The Las Cruces metropolitan economy is comprised by Dona Ana County. 2. Population, college enrollment, and business establishment data are in thousands. 3. All income and earnings data are expressed in millions of dollars.
3. Labor and proprietor earnings encompass wage and salary disbursements, other labor income, and proprietor earnings. 4. Real gross metropolitan product data are expressed in billions of 1996 dollars.
Table 17: Las Cruces Employment
1986 1991 1996 2001 2006 2011 2016 2021 2026
Las Cruces Total Emp. 50.221 60.362 67.48 76.905 89.725 101.593 111.487 120.512 129.733 % change 24.7 20.2 11.8 14 16.7 13.2 9.7 8.1 7.7
Construction Employment 3.312 3.09 4.619 4.515 6.053 6.594 7.098 7.727 8.553 % change 52.1 -6.7 49.5 -2.3 34.1 8.9 7.6 8.9 10.7
Manufacturing 3.621 3.151 2.988 3.368 3.936 4.149 4.376 4.588 4.814 % change 30.6 -13 -5.2 12.7 16.9 5.4 5.5 4.8 4.9
State Government 6 6.64 7.149 8.603 9.185 10.009 10.682 11.263 11.84 % change 28.7 10.7 7.7 20.3 6.8 9 6.7 5.4 5.1
Local Government 4.826 6.165 7.52 7.039 8.358 9.12 9.708 10.227 10.748 % change 20.4 27.7 22 -6.4 18.7 9.1 6.5 5.3 5.1
Federal Civilian Govt. 4.355 4.543 3.816 3.349 3.421 3.5 3.596 3.717 3.807 % change 3.6 4.3 -16 -12.2 2.1 2.3 2.7 3.4 2.4
Military Employment 0.703 0.777 0.714 0.631 0.623 0.661 0.674 0.695 0.712 % change 25.5 10.5 -8.1 -11.6 -1.3 6.2 1.8 3.1 2.5
Not Elsewhere Classified 27.404 35.996 40.674 49.4 58.149 67.559 75.353 82.295 89.258
% change 25.3 31.4 13 21.5 17.7 16.2 11.5 9.2 8.5
Notes:
1. Employment data are expressed in thousands.
Table 18: Las Cruces Personal Income
1986 1991 1996 2001 2006 2011 2016 2021 2026
Total Personal Income 1283.8 1847.4 2550.4 3460 4651.9 6564.4 9064.9 12195.1 16304.2 % change 7.7 7.2 4.8 10.9 8.4 6.7 6.6 5.9 6
Wages and Salaries 645.4 867.8 1132.7 1509 2123.2 2879.3 3778.8 4867.3 6237.7 % change 5.6 5.8 4.5 4 7.8 6 5.4 5.1 5.1
Other Labor Income 109.7 163.3 204.7 251.6 425.7 548.9 713.1 876.7 1095.6 % change 4.7 7.9 1.5 6.2 8.9 5.7 4.7 4.3 4.7
Proprietor Incomes 136.5 188.9 211.8 307.5 395.6 565.9 773.5 1065.8 1471.7 % change 18.4 3.8 -10.6 51.4 8.3 6.8 6.2 6.7 6.6
Social Ins. Cntrbns. 38.9 62.9 86.4 114.6 161.8 224.2 304.6 415.1 533.6 % change 10.6 11.2 3.3 6.4 8.3 6.6 6.2 6.7 5.2
Residence Adjustments 30 69.2 137.7 217.5 258.1 352.4 474.8 627 817.6 % change 36.1 22.4 7.8 7.5 6.4 6.4 6 5.6 5.4
Dividends, Int., Rent 243.8 348.4 487 612.5 598.6 949.3 1469.2 2044.1 2740.4 % change 7.7 6.4 10.4 11.9 9.6 8.3 9.4 6.1 6
Retirement Transfers 130.2 218.6 366.9 571.9 851.8 1264.9 1830.9 2658.4 3809.2 % change 7 11 8.3 18.4 9.8 7.7 7.8 7.6 7.5
Inc. Maint. Transfers 22.2 48.5 89.1 94.4 149.2 215.7 316.9 458.1 652.7 % change 10.5 21.3 10 1.6 8.6 8.1 7.8 7.4 7.2
Unemployment Transfers 5 5.6 6.9 10.2 11.6 12.1 12.4 12.7 13 % change -10.6 23.9 4.6 -1.1 -6.7 0.5 0.5 0.5 0.5
Notes:
1. All Las Cruces income data are expressed in millions of dollars.
2. Social insurance contributions are deducted from total regional income estimates. 3. Retirement transfer payments include social security and other retirement payments.