Developments in signal processing for computerised diagnosis in clinical neurophysiology
Full text
Figure

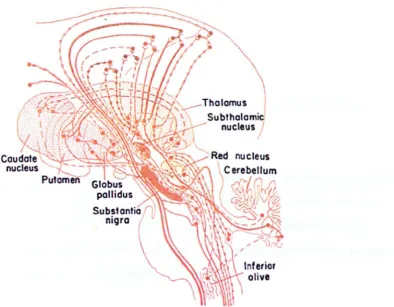
![Figure 2.5 The locations of the globus pallidus and striatum in the brain (this figure was obtained from Fox [1990])](https://thumb-us.123doks.com/thumbv2/123dok_us/8010748.764094/36.534.52.481.263.572/figure-locations-globus-pallidus-striatum-brain-figure-obtained.webp)


Related documents
It was found in the present study that compared to normal individuals, patients with adrenal and pituitary insufficiency did not have the capacity to raise their blood sugar
Fig.8 shows that the greater channel distortion parameters(or the eigenvalues spread degrees) is, the slower convergence rate the NLMS adaptive filter will have, and
The lack of significant changes in EMG amplitude of the quadriceps muscle ob- served after eccentric exercise at 25˚ of hip flexion can also indicate that eccentric ex-
With this in mind, we propose a provably secure SSH instantiation (SSH-$NPC) that uses randomized CBC mode for the underlying encryption scheme and that requires that encoded
By using the iterative schemes proposed by Moudafi [], Iemoto and Takahashi [] stud- ied the approximation of common fixed points of nonexpansive mappings and nonspread-
By means of the second-order theory of the open resonator and field matching method, a reliable dielectric measurement theory of the open resonator for non-planar objects is
Department of Mathematics Education, The Research Institute of Natural Sciences, College of Education, Gyeongsang National University, Chinju 660-701, Korea. E-mail
Notably, TMB and PD-L1 expression demonstrated total independence among several tumor types for which PD-1/PD-L1 inhibitor therapy is effective and widely used in the clinical care
