Open Journal of Geology, 2016, 6, 47-57
Published Online January 2016 in SciRes. http://www.scirp.org/journal/ojg http://dx.doi.org/10.4236/ojg.2016.61006
Geochemical Study of Almoqlaq Intrusive
Body in North of Asadabad in Hamedan
Province, Iran
Ahmad Farnin
Islamic Azad University, North Tehran Branch, Tehran, Iran
Received 15 December 2015; accepted 25 January 2016; published 28 January 2016
Copyright © 2016 by author and Scientific Research Publishing Inc.
This work is licensed under the Creative Commons Attribution International License (CC BY). http://creativecommons.org/licenses/by/4.0/
Abstract
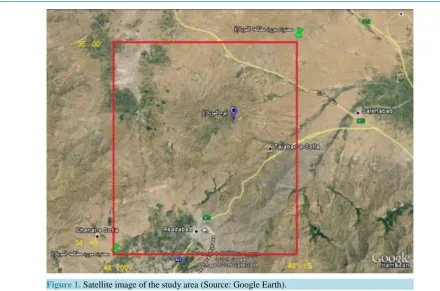
The study area is located in the west of Iran and in the north of Asadabad. This is the range be-tween Eastern lengths of 00', 48˚ to 15', 48˚, and northern latitudes of 45', 34˚ to 00', 35˚. This range is limited from north to the asphalt road of Hamadan Qorveh, Sanandaj, and from the East and Southeast, to Asadabad of Kermanshah-Hamedan road, and from the West to Chahardoli plain and from the south to the plains and the town of Asadabad. According to the geological map of the study area, intrusive outcropping of diorite-gabbro of Almoqlaq, and quartz syenite is at Almoqlaq mountains. Intrusive rocks of the region, based on the total Alkali oxide, against silica rocks of study area fall within the quartz monzonite, gabbro, granodiorite, granite, and syenite between quartz and alkali granite. And granite in the study area (due to aluminum saturation index), is in the range of metaluminous, and metaluminous to peraluminous. Based on normalized spider dia-gram with the upper crust, the typical study area belongs to this model, and most of the elements are placed near or on standard line of 1.
Keywords
Almoqlaq, Geochemistry, Intrusion, Alkali Granite, Metaluminous, Quartz Monzonite and Spider Diagram
1. Introduction
Figure 1. Satellite image of the study area (Source: Google Earth).
Asadabad.
In the north region, there are located Qeshlaq and Pahnebar and Hamekasi; and in the east it is limited to the villages of Ali Baba, Akhtehchi, Lower hand Tajiabad and DEHNO; and from the southeast it is limited to, Ra-sulabad village; from the west it is limited to the villages of Qarakand, Poshtdarband, Gholdareh, Pirmalu, Cha-ruq; and from the south it is limited to villages of Tarkhinabad and the town of Asadabad (Figure 2).
2. Access to the Area
From Hamedan, this area is accessible by two paved roads. One by Hamedan-Asadabad road, in which, the study area is located in its West, and from Hamadan to the highest point of the road in Asadabad Gorge which is about 35 km away, and from there, via dirt road which was constructed by Department of Telecommunications, and then, by the ways paved for native access, access into the mountains of Almuglaq. Other road is from Ha-madan to Sanandaj, from asphalt way to Hamekasi village, with a length of 25 km, and from there, to the village of Baba Ali, and lump iron ore. Also, by dirt-gravel roads, from Asadabad or from Hamekasi village, everyone can access to the plain of Chardoli and to Qarakand village, and then, by a narrow dirt road again to foothills of Almoqlaq (Figure 2).
Almoqlaq peak height is 2993 meters above sea level. Irregularities in the area are in the connection with li-thological characteristics and tectonic phenomena, and from the perspective of the formation geomorphological Almoqlaq cone of High Mountain located in the proximity of Mount Alvand, its slope is moderate, and overall appearance is affected by the intrusion of Almoqlaq and evokes a dome-shaped bulge in the mind. Almoqlaq area, from the perspective of structural geology of Iran, is located in Sanandaj-Sirjan and has general characte-ristics of this zone.
3. Intrusive Bodies of Study Area
3.1. Almoqlaq Masses of Diorite-Gabbro
A. Farnin
Figure 2. Map of access roads to the study area (topographic map 1:250,000 Hamadan, Armed Forces Geographical
Organization, 2001; (Source: Google Earth).
are more likely from gray to light gray with green and sometimes dark spots.
3.2. Mass of Quartz Syenite in the Mountains of Almoqlaq
In Almoqlaq Mountains, there are many outcrops of quartz syenite rocks which are a combination of different cognitive stone, inclusind quartz syenite, granodiorite and quartz micro Monsosyenite. These rocks have gentle topography and for the most part, they are covered by debris. The results can be found in the following Tables 1-3 and figures.
4. Observations and Results
In the diagram [1], it is used of alkali oxides (Na2O + K2O) in the silica of SiO2 (Figure 3). As we can see in the diagram, ten samples were used namely, four samples in quartz monzonite border, one sample in monzonite and a sample in monzonite quartz border a sample is located on the border of quartz monzonite and granite, two lo-cated within granite, a sample is lolo-cated in granite and granodiorite border and a sample lolo-cated within the gab-bro.
Delarosh et al. classification (1980) is based on cationic core elements ratios, and expressed as mg cation. In this category, the results are plotted on a graph of two variables of XY and using graphical parameters of R1, R2. In this diagram, R1 is placed in the X-axis, and R2 is located Y-axis. The cation graph defined by R2, R1, which is = 4 Si-11 (Na + K) − 2 (Fe + Ti) R1 and R2 = 6Ca + 2Mg + Al. Based on the chart below four samples of rocks studied area, ranging from quartz monzonite a sample of gabbro, a sample is within the granodiorite, three are in the range of granite, and an example is in the range between quartz alkali syenite and granite (Figure 4).
Change plot of K2O versus SiO2 are presented by changes in weight percentage, the two oxide K2O and SiO2, and it has been shown, 4 magmatic series tholeiitic, calc-alkaline, calc-alkaline which are rich in potassium and Shoshsonitic. According to this chart, two samples of rocks are located in tholeites range, two are in the range of calc-alkaline series, six samples are located in the series of calc-alkaline and rich in potassium (Figure 5).
Figure 3. Total alkali oxide (Na2O + K2O), against silica (SiO2) [1].
Figure 4. Classification charts of Delarosh et al., 1980 [2].
of gabbro, two of tonalite, a sample of granodiorite sample, two samples of quartz monzonite, three samples of quartz, and one sample are located out of the defined range (Figure 6).
[image:4.595.149.483.385.635.2]A. Farnin
[image:5.595.88.539.526.723.2]Figure 5. Change plot of K2O versus SiO2 (Peccerillo and Taylor, 1976) [2].
Figure 6. Classification of rocks based on the diagram (Debon & Le Fort PQ) [2].
Table 1. Chemical analysis of the main elements of the study area (author finding).
S.N. F.52 F.29 F.53 F.25 F.54 F.28 F.56 F.35 F.44 F.37
Formula (%) (%) (%) (%) (%) (%) (%) (%) (%) (%)
SiO2 67.41 69.76 76.96 61.39 62.32 73.42 68.03 47.89 61.85 69.52
Al2O3 15.34 16.21 12.73 16.15 15.96 13.69 15.24 14.53 16.11 15.84
Fe2O3 3.34 2.41 0.92 7.56 6.42 1.53 3.23 14.86 6.82 2.43
CaO 1.63 3.11 0.89 3.26 2.89 1.59 1.45 9.98 3.21 0.55
Na2O 5.03 5.26 6.89 4.88 4.52 7.69 5.04 3.12 4.82 5.42
K2O 4.25 1.69 0.27 3.06 3.26 0.02 4.02 0.98 3.11 4.69
MgO 0.48 0.44 0.15 0.96 1.18 0.27 0.69 4.96 1.29 0.32
TiO2 0.561 0.542 0.191 1.334 0.968 0.493 0.451 1.536 1.201 0.352
MnO 0.048 0.021 0.005 0.123 0.115 0.016 0.067 0.146 0.147 0.007
P2O5 0.076 0.083 0.028 0.421 0.271 0.044 0.076 0.088 0.198 0.061
S 0.008 0.006 0.008 0.006 0.005 0.008 0.009 0.012 0.007 0.006
Table 2. Normative composition in the samples of study area (author finding).
Sample F.52 F.29 F.53 F.25 F.54 F.28 F.56 F.35 F.44 F.37
Q 18.079 25.26 34.062 14.129 16.365 25.97 19.407 3.116 13.991 18.561
C 0 0.272 0 0 0.39 0 0.143 0 0 0.993
Or 25.116 9.987 1.596 18.084 19.266 0.118 23.757 5.791 18.379 27.716
Ab 42.562 44.509 58.301 41.293 38.247 65.071 42.647 26.401 40.786 45.863
An 6.725 14.887 3.01 13.124 12.567 2.777 6.697 22.747 13.136 2.33
Di 0 0 0.434 0 0 1.451 0 16.627 0 0
Wo 0 0 0 0 0 0.531 0 0 0 0
Hy 1.196 1.096 0.172 2.391 2.939 0 1.719 4.646 3.213 0.797
Il 0.084 0.031 0 0.249 0.234 0.015 0.122 0.284 0.298 0.001
Hm 3.34 2.41 0.92 7.56 6.42 1.53 3.23 14.86 6.82 2.43
Tn 0.609 0 0.469 0.211 0 1.19 0 3.404 1.054 0
Ru 0.269 0.526 0 1.118 0.845 0 0.387 0 0.615 0.352
Ap 0.18 0.197 0.066 0.997 0.642 0.104 0.18 0.208 0.469 0.144
Pr 0.015 0.011 0.008 0.011 0.009 0.015 0.017 0.022 0.013 0.011
Sum 98.176 0.011 99.039 99.166 97.924 98.772 98.306 98.106 98.774 99.198
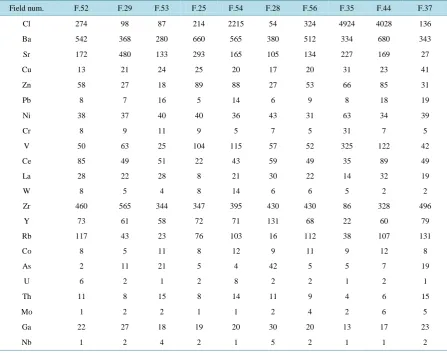
Table 3. The results of chemical analysis for trace elements, in the samples of the study area (in ppm) (author finding).
Field num. F.52 F.29 F.53 F.25 F.54 F.28 F.56 F.35 F.44 F.37
Cl 274 98 87 214 2215 54 324 4924 4028 136
Ba 542 368 280 660 565 380 512 334 680 343
Sr 172 480 133 293 165 105 134 227 169 27
Cu 13 21 24 25 20 17 20 31 23 41
Zn 58 27 18 89 88 27 53 66 85 31
Pb 8 7 16 5 14 6 9 8 18 19
Ni 38 37 40 40 36 43 31 63 34 39
Cr 8 9 11 9 5 7 5 31 7 5
V 50 63 25 104 115 57 52 325 122 42
Ce 85 49 51 22 43 59 49 35 89 49
La 28 22 28 8 21 30 22 14 32 19
W 8 5 4 8 14 6 6 5 2 2
Zr 460 565 344 347 395 430 430 86 328 496
Y 73 61 58 72 71 131 68 22 60 79
Rb 117 43 23 76 103 16 112 38 107 131
Co 8 5 11 8 12 9 11 9 12 8
As 2 11 21 5 4 42 5 5 7 19
U 6 2 1 2 8 2 2 1 2 1
Th 11 8 15 8 14 11 9 4 6 15
Mo 1 2 2 1 1 2 4 2 6 5
Ga 22 27 18 19 20 30 20 13 17 23
A. Farnin
Figure 7. Geochemical classification of intrusive rocks using total figure of Alkali
against silica (Cox et al., 1979) [2].
a sample is gabbro rocks and is located in basic range.
Classification of rocks based on Debon & Le Fort AB chart: This graph covers A = Al − (K + Na + 2Ca) and B = Fe + Mg + Ti parameters which is indicative of two ranges of Peraluminous and metaluminous. According to below diagram, three of the rocks are located in the study area of metaluminous, and contain biotite ± amphi-bole ± pyroxene Clino, four rock samples from the study area are located in the meta area, and the are composed of biotite, amphibole ± pyroxene, two are located on the border of Peraluminous and metaalumina (3 and 4) and the range includes biotite, amphibole, pyroxene and biotite ± a little bit of amphibole. One of the rocks range. one of the rocks of the study area is in the region of Peraluminous, and is located on the border of 2 and 3, which includes biotite ± a small amount of amphibole, muscovite and biotite. See Figure 8.
Classification of rocks based on (Alkali-Lime): In this graph which is introduced in the name of MALI, pa-rameters of (Na2O + K2O), in front of SiO2 (Figure 9) are used. In this diagram, nine samples are in the range of calcite and a sample is placed in the alkaline range.
Todays, the saturation of aluminum has been accepted as an important factor in determining the origin of gra-nitoid magma and is of particular importance. Based on this index, peraluminous granites are divided into 4 cat-egories of metaluminous, Peralkaline and sub-alumina [3].
PerAlumina Al2O3> (Na2O + K2O + CaO)
Metaluminous (Na2O + K2O + CaO) > Al2O3> (Na2O + K2O) Saab alumina Al2O3= (Na2O + K2O)
Peralkaline Al2O3< (Na2O + K2O)
Aluminium saturation index is defined by the following relationship: Al/NK = Al2O3/(Na2O + K2O)
Al/CNK = Al2O3/(Na2O + K2O + CaO)
Based on the chart [3], seven samples are in the range of meta-alumina and two samples are on the border of meta-alumina to per-alumina, a sample located within Peraluminous (Figure 10).
Normalized graph of the area under study, with normal Mvrbhay, Sun & MacDonough 1989 [4]: According to this model, elements LILE) Rb, K (Ba, and light rare earths (LREE) (Ce, La), compared to the elements (Nb, Ti) HFS, enriched show, and in our model, most chemicals, placed on top of the standard line 1, the MORB. In this pattern, anomalies Pb observed. Based on these charts, examples area of study, depletion of elements P, Ti, and enriched Pb, and almost all elements, are higher than the standard line 1, the MORB, that this issue shows a lack of independence of the mantle source depleted (MORB) (Figure 11).
Figure 8. Classification of rocks, according to the chart A (B) Debon & Le Fort [3].
Figure 9. Classification based on Alkali-Lime (Peacock, 1931) Aluminium saturation
index [3].
could be the result of magma fractionation and crustal contamination. Elements of Zr, Th, Y, have a positive anomaly, and these elements can indicate infection with the upper crust (Figure 12).
According to this model, the Nb element has negative anomaly, and to the upper crust, suggesting the deple-tion. Elements of Y, Zr are also central to the case, which has enriched and the positive anomalies of these ele-ments may indicate infection with the upper crust. Most eleele-ments are near or on the standard line 1, the Upper crust (Figure 13).
5. Conclusions
[image:8.595.166.470.377.567.2]A. Farnin
Figure 10. The chart of A/NK against A/CNK to distinguish peraluminous, metalu-
[image:9.595.160.471.93.343.2]minous and Peralkaline magmas [3].
Figure 11. The normalized spider diagrams, from the study area samples with normal
diagonals [4].
[image:9.595.159.471.379.610.2]Figure 12. Charts the norm sample of the study area, with primitive mantle
[image:10.595.166.468.85.287.2](MacDonough & Sun, 1989) [4].
Figure 13. Normalized charts, samples of the study area, with the upper crust [5].
medium-grained texture, and rich hornblende and plagioclase, and the sample-and-white are gray.
These rocks are the main minerals including quartz, feldspar, plagioclase, hornblende, and minor minerals, not including Apec, and sphene, and biotite, and secondary minerals, chlorite and sericite are included. Accord-ing to the graph, normalized samples studied area, with the upper crust, rocks of the study area belong to this pattern, and most elements are near or on line 1 standard.
Acknowledgements
Gratitude and thanked from the unconditional and unfailing guidance of venerable professor, Mr. Doctor Arda-lan who guided me in compiling this article.
References
[1] Middlemost, E.A.K. (1985) Magmas and Magmatic Rocks. An Introduction to Igneous Petrology. Longman Group,
[image:10.595.158.472.323.530.2]A. Farnin
[2] Wilson, R. (1990) Igneous Petrogenesis. Unwin Hyman Ltd.‚ 466 p.
[3] Shand, S.J. (1943) Coronas and Coronites. Bull. Geol. Soci. America, No. 56, 247-266.
[4] Sun, S. and McDonough, W.F. (1989) Chemical and Isotopic Systematic of Oceanic Basalts: Implications for Mantle
Composition and Processes. Geological Special Publication No. 42, 313-345.
[5] Taylor, R.P. and Mclennan, S.M. (1985) The Continental Crust, Its Composition and Evolution. Black Wall, Oxford,

![Figure 3. Total alkali oxide (Na2O + K2O), against silica (SiO2) [1].](https://thumb-us.123doks.com/thumbv2/123dok_us/8010469.764045/4.595.149.483.385.635/figure-total-alkali-oxide-na-against-silica-sio.webp)
![Figure 6. Classification of rocks based on the diagram (Debon & Le Fort PQ) [2].](https://thumb-us.123doks.com/thumbv2/123dok_us/8010469.764045/5.595.88.539.526.723/figure-classification-rocks-based-diagram-debon-le-fort.webp)
![Figure 7. Geochemical classification of intrusive rocks using total figure of Alkali against silica (Cox et al., 1979) [2]](https://thumb-us.123doks.com/thumbv2/123dok_us/8010469.764045/7.595.164.467.86.288/figure-geochemical-classification-intrusive-rocks-figure-alkali-silica.webp)
![Figure 9. Classification based on Alkali-Lime (Peacock, 1931) Aluminium saturation index [3]](https://thumb-us.123doks.com/thumbv2/123dok_us/8010469.764045/8.595.159.470.94.348/figure-classification-based-alkali-lime-peacock-aluminium-saturation.webp)
![Figure 10. The chart of A/NK against A/CNK to distinguish peraluminous, metalu- minous and Peralkaline magmas [3]](https://thumb-us.123doks.com/thumbv2/123dok_us/8010469.764045/9.595.159.471.379.610/figure-chart-distinguish-peraluminous-metalu-minous-peralkaline-magmas.webp)
![Figure 12. Charts the norm sample of the study area, with primitive mantle (MacDonough & Sun, 1989) [4]](https://thumb-us.123doks.com/thumbv2/123dok_us/8010469.764045/10.595.158.472.323.530/figure-charts-norm-sample-study-primitive-mantle-macdonough.webp)
