S O F T W A R E
Open Access
HiFive: a tool suite for easy and efficient
HiC and 5C data analysis
Michael EG Sauria
1, Jennifer E. Phillips-Cremins
2, Victor G. Corces
3and James Taylor
1*Abstract
The chromatin interaction assays 5C and HiC have advanced our understanding of genomic spatial organization, but analysis approaches for these data are limited by usability and flexibility. The HiFive tool suite provides efficient data handling and a variety of normalization approaches for easy, fast analysis and method comparison. Integration of MPI-based parallelization allows scalability and rapid processing time. In addition to single-command analysis of an entire experiment from mapped reads to interaction values, HiFive has been integrated into the open-source, web-based platform Galaxy to connect users with computational resources and a graphical interface. HiFive is open-source software available from http://taylorlab.org/software/hifive/.
Keywords:Chromatin conformation, Normalization, Software, Spatial organization, Scalable, Galaxy
Background
In the more than a decade since the vast majority of the human genome was first sequenced, it has become clear that sequence alone is insufficient to explain the complex gene and RNA regulatory patterns seen over time and across cell types in eukaryotes. The context of specific se-quences – whether from combinations of DNA-binding transcription factors (TFs) [1–3], methylation of the DNA itself [4, 5], or local histone modifications [4, 6]–is inte-gral to how the cell utilizes each sequence element. Al-though we have known about the potential roles that sequentially distant but spatially proximal sequences and their binding and epigenetic contexts play in regulating expression and function, it has only been over the past decade that new sequencing-based techniques have en-abled high-throughput analysis of higher-order structures of chromatin and investigation into how these structures interact among themselves and with other genomic ele-ments to influence cellular function.
Several different sequencing methods for assessing chromatin interactions have been devised, all based on preferentially ligating spatially close DNA sequence frag-ments. These approaches include ChIA-Pet [7], tethered chromosome capture [8], and the chromatin conformation
capture technologies of 3C, 4C, 5C, and HiC [9–12] (Additional file 1: Figure S1). While these assays have allowed a rapid expansion of our understanding of the nature of genome structure, they also have presented some formidable challenges.
In both HiC and 5C, systematic biases resulting from the nature of the assays have been observed [13, 14], resulting in differential representation of sequences in the resulting datasets. While analyses at a larger scale are not dramatically affected by these biases due to the large number of data points being averaged over, higher-resolution approaches must first address these challenges. This is becoming more important as the resolution of experiments is increasing [15]. Several analysis methods have been described in the literature and applied to correcting biases in HiC [14–21] and 5C data [22–24]. There is still room for improving our ability to remove this systematic noise from the data and resolve finer-scale features and, perhaps more im-portantly, for improving the usability and reproducibil-ity of normalization methodologies.
A second challenge posed by data from these types of assays is one of resources. Unlike other next-generation sequencing assays where even single-base resolution is limited to a few billion data points, these assays assess pairwise combinations, potentially increasing the size of the dataset by several orders of magnitude. For a three billion base pair genome cut with a six-base restriction * Correspondence:[email protected]
1
Departments of Biology and Computer Science, Johns Hopkins University, Baltimore, MD 21218, USA
Full list of author information is available at the end of the article
enzyme (RE), the number of potential interaction pairs is more than half a trillion (if considering both fragment ends) while a four-base RE can yield more than two and a half quadrillion interaction pairs. Even allowing that the vast majority of those interactions will be absent from the sequencing data, the amount of information that needs to be handled and the complexity of normal-izing these data still pose a major computational hurdle, especially for investigators without access to substantial computational resources.
Here we describe HiFive, a suite of tools developed for handling both HiC and 5C data using a combination of empirically determined and probabilistic signal modeling. HiFive has performance on par or better than other avail-able methodologies while showing superior speed and efficient memory usage through parallelization and data management strategies. In addition to providing a simple interface with no preprocessing or reformatting require-ments, HiFive offers a variety of normalization approaches including versions of all commonly used algorithmic approaches allowing for straightforward optimization and method comparison within a single application. In addition to its command line interface, HiFive is also avail-able through Galaxy, an open-source web-based platform, connecting users with computational resources and the ability to store and share their 5C and HiC analyses. All of
these aspects of HiFive make it simple to use and fast, and make its analyses easily reproducible.
The HiFive analysis suite
HiFive was designed with three goals: first, to provide a simple-to-use interface for flexible chromatin interaction data analysis; second, to provide well-documented support for 5C analysis; and third, to improve performance over existing methodologies while reducing analysis runtimes. These are accomplished through a stand-alone program built on a Python library designed for customizable ana-lysis and supported under the web-based platform Galaxy.
User interface
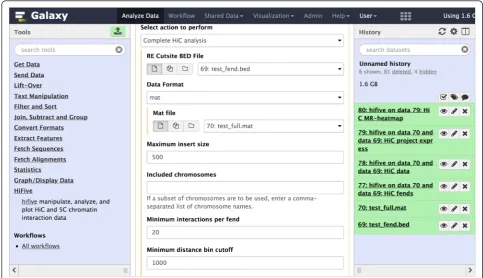
HiFive provides three methods of use: the command line; the Internet; or as a development library. The command line interface provides users with the ability to perform analyses as a series of steps or as a single unified analysis. The only inputs that HiFive requires are a description of the genomic partitioning and interaction data, either dir-ectly as mapped reads or counts of reads associated with the partitioned genome (for example, fragment pairs and their observed reads). HiFive handles all other formatting and data processing. In addition, HiFive has been bundled as a set of tools available through Galaxy (Fig. 1). This not only provides support with computational resources but
[image:2.595.55.539.428.706.2]also ensures simple installation of all prerequisite libraries and packages. HiFive was also created to allow custom creation of analysis methods as a development library for chromatin interaction analysis through extensive docu-mentation and an efficient data-handling framework.
Organization of HiFive
At its core, HiFive is a series of hierarchical data struc-tures building from general to specific information. There are four primary file types that HiFive creates, all relying on the Numpy scientific computing Python package for efficient data arrays and fast data access. These structures include genomic partitioning, ob-served interactions, distance-dependence relationship and normalization parameters, and heatmaps of ob-served and expected interactions. By separating these attributes, many datasets can utilize the same genomic partitioning and multiple analyses can be run using the same interaction data without the need to reload or process information.
Data processing and filtering
In order to process 5C or HiC data, the first step after mapping is converting the data into a form compatible with the desired workflow. HiFive appears to be nearly alone in its ability to handle mapped data without add-itional processing (the only exception is HiCLib [17]). Reads can be read directly from numerous BAM-formatted files, and this may be done as an independent step or within the integrated one-step analysis. HiCLib also possesses the ability to input data directly from mapped read files. In all other cases, reads need to be con-verted to other formats. HiCPipe [14] provides scripts for some but not all of these processes, while HiCNorm [16] relies on pre-binned reads. In all cases aside from HiFive, a workflow is required to move from mapped reads to normalization.
Filtering is accomplished in two phases, during the ini-tial processing of reads and during project creation (Additional file 1: Figures S2 and S3). The first phase limits data to acceptable paired-end combinations. For 5C data, this means reads mapping to fragments probed with opposite-orientation primers. HiC data use two cri-teria, total insert size (a user-specified parameter) and orientation/fragment relationship filtering. In the latter case, reads originating from non-adjacent fragments or from adjacent fragments and in the same orientation are allowed, similar to Jinet al.[19] (Additional file 1: Figure S4). The second phase, common to both 5C and HiC data, is an iterative filtering based on numbers of interactions per fragment or fragment end (fend). Briefly, total num-bers of interactions for each fragment are calculated, and fragments with insufficient numbers of interaction part-ners are removed along with all of their interactions. This
is repeated until all fragments interact with a sufficient number of other non-filtered fragments. This filtering is crucial for any fragment or fend-specific normalization scheme to ensure sufficient interdependency between interaction subsets to avoid convergence issues.
Distance-dependence signal estimation
One feature of HiFive that is notably absent from nearly all other available analysis software is the ability to incorporate the effects of sequential distance into the normalization. One exception to this is HiTC [21], which uses a loess re-gression to approximate the distance-dependence relation-ship of 5C data to genomic distance. This method does not, however, allow for any other normalization of 5C data. Another is Fit-Hi-C [25], although this software assigns confidence estimates to mid-range contact bins rather than normalizing entire datasets. This feature is of particular im-portance for analysis of short-range interactions such as this in 5C data, or for making use of counts data rather than a binary observed/unobserved indicator. For 5C data, HiFive uses a linear regression to estimate parameters for the relationship between the distance and log-counts (Additional file 1: Figure S5). HiC data require a more nuanced approximation because of the amount of data involved and the non-linear relationship over the range of distances queried. To achieve this, HiFive uses a linear piece-wise function to approximate the distance-dependent portion of the HiC signal, similar but distinct from that used by Fit-Hi-C. HiFive partitions the total range of interactions into equally sized log-transformed distance bins with the exception of the smallest bin, whose upper bound is specified by the user. Mean counts and log-transformed distances are calculated for each bin and a line is used to connect each set of adjacent bin points (Additional file 1: Figure S6). For distances extending past the first and last bins, the line segment is simply extended from the last pair of bins on either end. Simultaneously, a similar distance-dependence function is constructed using a binary indicator of observed/unobserved instead of read counts for each fend pair. All distances are measured be-tween fragment or fend midpoints.
HiFive normalization algorithms
The Express algorithm is a generalized version of matrix balancing. While it can use the Knight-Ruiz al-gorithm [26] for extremely fast standard matrix balan-cing (ExpressKR), the Express algorithm also has the ability to take into account differing numbers of pos-sible interactions and find corrections weighted by these numbers of interactions. The set of valid interac-tions is defined as setA, interactions whose fends have both passed the above-described filtering process and whose inter-fend distance falls within user-specified limits. In addition, because counts are log-transformed for 5C normalization, only non-zero interactions are in-cluded in setA. For each interactioncbetween fends or fragments i and j for HiC and 5C, respectively, in the set of valid interactions A, correction parameter fi is updated as in (1) for HiC and (2) for 5C.
f′
i¼fi
ffiffiffiffiffiffiffiffiffiffiffiffiffi X
j∈Ai
cij Eij X
j∈Ai
1 v u u u u u
t ð1Þ
fi′¼fiþ X cij∈Ai
i;j
ln cij −Eij
X cij∈Ai
i;j 2
ð2Þ
The expected value of each HiC interaction is simply product of the exponent of the expected distance-dependent signalD(i,j)and the fend corrections (3).
Eij¼eD ið Þ;jf
ifj ð3Þ
5C interactions have expected values that correspond to the log-transformed count and are the sum of each signal component (4).
Eij¼D ið Þ þ;j fiþfj ð4Þ
By scaling the row sums based on number of interac-tions, the weighted matrix balancing allows exclusion of interactions based on interaction size criteria without skewing correction factors due to non-uniform restric-tion site distriburestric-tion, posirestric-tion along the chromosome, or filtered fragments or fends due to read coverage. Because it can incorporate the distance-dependent signal, the Ex-press algorithm can operate on counts data unlike most other matrix balancing approaches, although it also can be performed on binary data (observed vs. unobserved) or log-transformed counts for HiC and 5C, respectively. This algorithm allows for adjustment of counts based on the estimated distance-dependence signal prior to normalization in both weighted (1 and 2) and un-weighted (Knight-Ruiz) versions.
The multiplicative Probability algorithm models the data assuming some probability distribution with a prior equal to the estimated distance-dependent signal. HiC data can be modeled either with a Poisson or binomial distribution (Additional file 1: Figure S7). In the case of the binomial distribution, counts are transformed into a binary indicator of observed/unobserved and the distance-dependence approximation function is based on this same binary data. 5C data are modeled using a lognormal distri-bution. In both cases only counts in the set of reads A (described above) are modeled.
For both the Express and Probability algorithms, a backtracking-line gradient descent approach is used for learning correction parameters. This allows the learning raterto be updated each iterationtto satisfy the Armijo criteria (5) based on the costC, ensuring that parameter updates are appropriate.
Armijo¼Ct−Ct−1r
X
i∈A
∇fi
ð Þ2 ð
5Þ
Filtering interactions by interaction size
Chromatin topology is organized around highly reprodu-cible regions of frequent local interactions termed‘ topo-logical domains’[27]. Within these structures it has been observed that specific features can influence the frequency of interactions in a biased and differential way up- and downstream of them, such as transcript start sites (TSS) and CTCF-bound sites [14]. In order to account for sys-tematic noise and bias without confounding normalization efforts with meaningful biological-relevant structures, HiFive allows filtering out of interactions using interaction size cutoffs. In order to assess the effects of filtering out shorter-sized interactions, we analyzed data both with and without a lower interaction distance cutoff. For HiC data we analyzed two mouse embyronic stem cells (ESC) data-sets with no lower limit and with a lower distance limit of 500 Kb using each of the described normalization algo-rithms. This size was chosen to eliminate all but the weak-est interaction effects observed for TSSs and CTCF-bound sites [28]. HiC normalization performance was assessed using the inter-dataset correlations. For 5C data, there is a much smaller range of interactions. In order to handle this, we set a lower interaction size cutoff of 50 Kb. 5C normalization performance was assessed as the correl-ation between 5C data and HiC data of the same cell type [27] and binned based on probed 5C fragments to create identically partitioned sets of interactions and normalized using HiFive’s Probability algorithm.
interactions and for overall inter-chromosomal interac-tions (Additional file 1: Figure S8). Overall, excluding short-range interactions made little difference for the Ex-press algorithm but did improve the performance of the Probability and Binning algorithms. The 5C algorithms showed an opposite result, with almost universal de-crease in performance when short-range interactions are excluded (Additional file 1: Figure S9). As a result, learning HiC normalization parameters using HiFive al-gorithms was performed excluding interactions shorter than 500 Kb and 5C analyses were performed using all interaction sizes. All analyses subsequent to normalization (for example, dataset correlations) were performed across all interactions.
Analyzing 5C data
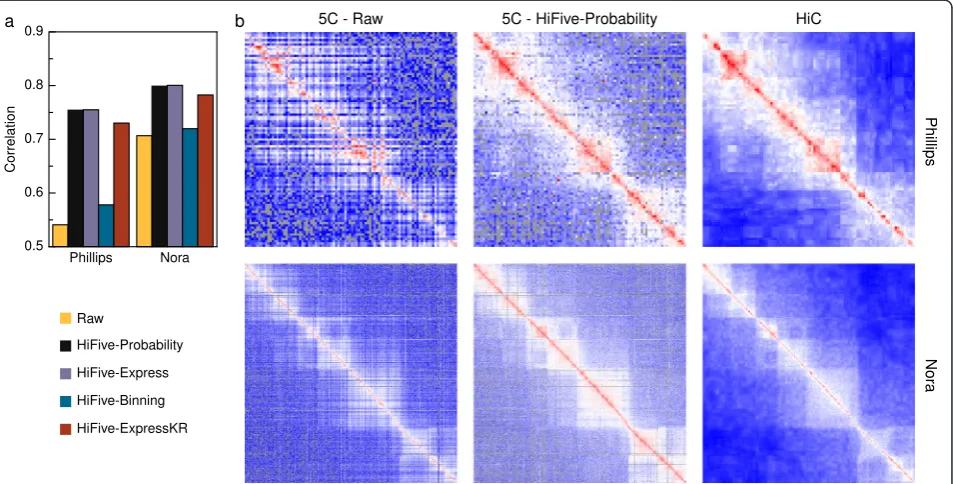
To date, limited work has focused on processing of 5C data to remove technical biases [22–24, 29]. Of that, none has been formalized in published analysis software. In order to assess HiFive’s performance in normalizing 5C data, we used two different 5C mouse ESC datasets [23, 24] and found correlations to HiC data of the same cell type [27] and binned based on probed 5C fragments to create identically partitioned sets of interactions (Fig. 2, Additional file 1: Figures S9 and S10). HiC interactions were normalized using either HiFive’s probability algo-rithm (Fig. 2) or HiCPipe (Additional file 1: Figure S10) and heatmaps were dynamically binned to account for
sparse coverage (see Additional file 1: Methods: 5C-HiC data correlations). Correlations were found between all non-zero pairs of bins (fragment level resolution) follow-ing log-transformation. All of HiFive’s 5C algorithms showed an improved correlation with HiC data compared to raw data, regardless of HiC normalization approach. The Binning algorithm showed the least improvement, likely due to the limits on the number of bins into which features could be partitioned and characteristics missing from the model, such as primer melting temperature. The standard matrix-balancing approach (ExpressKR) showed good improvement, although not quite as good as the Express and Probability algorithms. All of these normali-zations were accomplished in less than one minute pro-ceeding from a BED file and a counts file to heatmaps.
HiC analysis software comparison
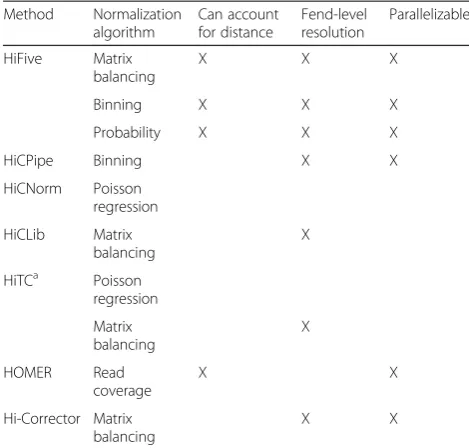
Several algorithms have been proposed to handle inter-action data normalization (Table 1). These analysis ap-proaches can be divided into two varieties, probabilistic and matrix balancing. The probabilistic approach is further divided into combinatorial and multiplicative corrections. The combinatorial probability model is im-plemented in HiCPipe [14] and remains one of the most popular approaches. This approach uses one or more restriction fend characteristics partitioned into ranges of values and iteratively learns correction values for each combination of ranges based on a binomial
[image:5.595.62.539.443.685.2]distribution of observed versus unobserved fend inter-actions. A multiplicative modeling approach is used in the analysis software HiCNorm [16]. HiCNorm uses a Poisson regression model using binned counts instead of binary output and assuming that biases from fend characteristics are multiplicative between bin combina-tions. A different multiplicative approach is matrix balancing, which finds a value for each row/column of a symmetric matrix (or in this case, heatmap) such that after multiplication of each matrix value by its associ-ated row and column values, the sum of each row and column is one. This has been described with at least four different implementations in the literature [15, 17, 20, 30] although only two software packages making use of it have been published (HiCLib [17], now included in the R package HiTC [21] and Hi-Corrector [20]). For this paper, we chose to use our own implementation of the algorithm described by Knight and Ruiz [26] for compari-son due to speed and ease of use considerations.
Method performances
To assess HiC analysis method performances we used two different pairs of HiC datasets [15, 27, 31], finding inter-action correlations across different restriction digests of the same cell type genomes. The Dixon et al. data [27] were produced using mouse ESCs digested with either HindIII or NcoI, yielding approximately 4 Kb fragments. The Selvaraj et al.data [31] were produced from human GM12878 cells using HindIII, while the Rao et al. data [15] were produced from human GM12878 cells using the 4 bp restriction enzyme MboI, producing approximately
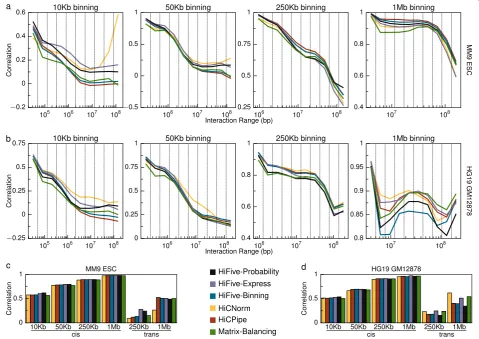
250 bp fragments. This allowed assessment of method performance and data handling across a range of experi-mental resolutions. Correlations were calculated for 10 mutually exclusive intra-chromosomal (cis) interaction ranges and across all cis interactions simultaneously for four binning resolutions. Correlations were also calculated for inter-chromosomal interactions for two resolutions.
HiC analysis methods showed varied performances across interaction size ranges, resolutions, and datasets for intra-chromosomal interactions (Fig. 3a and b). For small interaction sizes, HiFive’s Probability and Express algorithms performed consistently well regardless of resolution. At longer interaction distances the Express algorithm typically outperformed the Probability algo-rithm. HiCNorm showed a nearly opposite performance with poorer inter-dataset correlations for shorter-range interactions but higher correlations at longer ranges, relative to other methods. HiCPipe’s performance ap-peared to depend on binning resolution. At higher resolu-tions (≤50 Kb), HiCPipe performed worse than the majority of methods. However at lower resolutions it tended to outperform other methods, regardless of inter-action size range. HiFive’s Binning algorithm had a more consistent performance around the middle of all of the methods across all binning resolutions, with the exception of the 1 Mb resolution for the human data where it per-formed the worst. Standard matrix balancing consistently performed at or near the bottom of the group regardless of the interaction size range or resolution.
Correlations across all intra-chromosomal interactions showed much more consistency between analysis method-ologies (Fig. 3c and d). This is primarily due to the fact that the main driver of dataset correlation, the inter-action distance-counts relationship, was present in all of the analyzed data. HiFive’s Probability and Express algo-rithms were again top performers across almost every intra-chromosomal comparison, although the Probability algorithm showed a decreasing advantage with decreasing binning resolution. HiCNorm, HiCPipe, matrix balancing, and HiFive’s Binning algorithm were highly consistent in terms of performance for the mouse datasets. For the hu-man inter-dataset correlations HiCPipe and matrix balan-cing showed a slightly better performance than average while HiCNorm faired worse. HiFive’s Express algorithm was still the top performer.
[image:6.595.55.290.111.335.2]Inter-chromosomal datasets showed a wider range of performances and were strongly dependent on which datasets were being analyzed (Fig. 3c and d). For mouse inter-chromosomal interactions, HiFive’s Probability and Express algorithms performed much better than other methods at the 250 Kb binning resolution, but consistent with other methods at the 1 Mb resolution. HiCNorm showed worse performance at both bin sizes for the mouse datasets. HiCPipe showed the best performance at
Table 1A comparison of HiC Analysis software algorithms and features
Method Normalization algorithm
Can account for distance
Fend-level resolution
Parallelizable
HiFive Matrix balancing
X X X
Binning X X X
Probability X X X
HiCPipe Binning X X
HiCNorm Poisson regression
HiCLib Matrix balancing
X
HiTCa Poisson regression
Matrix balancing
X
HOMER Read
coverage
X X
Hi-Corrector Matrix balancing
X X
aThis method is an R-based implementation of HiCLib’s and HiCNorm’s
the 1 Mb resolution, slightly above other methods, but the second worst performance at the 250 Kb resolution. Re-sults for the human datasets were more consistent across resolutions. HiCNorm, HiFive’s Express algorithm, and matrix balancing performed best in both cases with Ex-press doing slightly better at the 250 Kb resolution and HiCNorm at the 1 Mb resolution. The remaining methods showed similar performance to each other, although HiF-ive’s Probability algorithm performed slightly worse than HiFive’s Binning algorithm and HiCPipe.
The inconsistency between results for cis and trans interactions suggests that no approach is ideal for both types of interactions. To further explore this we looked at the effects of pseudo-counts in the Binning/HiCPipe normalization scheme and the effects of distance-dependence on normalization. Pseudo-counts are values added to both expected and observed reads to mitigate
the impact of stochastic effects. HiCPipe showed a stronger performance compared to HiFive’s Binning al-gorithm at longer ranges and at larger bin sizes. We de-termined that the primary difference was the inclusion of pseudo-counts in all feature bins prior to normalization. By progressively adding counts, we found that cis inter-action correlations decreased at shorter interinter-action ranges and overall, although the correlations increased at longer ranges and for trans interactions (Additional file 1: Figure S11).
[image:7.595.58.538.92.431.2]sizes, stronger 1 Mb binned trans correlations, and poorer overall cis interaction correlations across all bin sizes.
Computational requirements
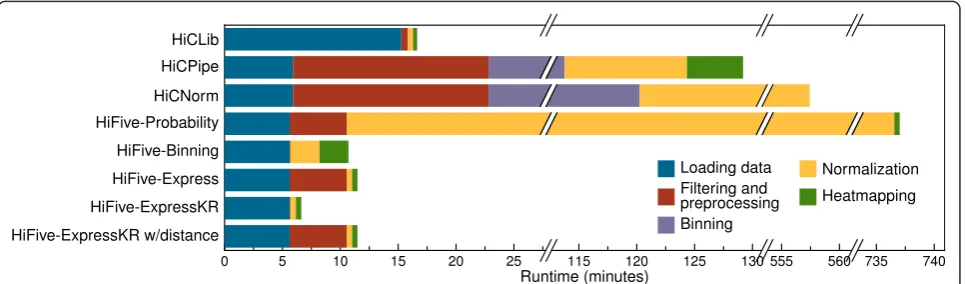
In order to determine the computational requirements of each analysis method, we ran each analysis on an abbrevi-ated dataset consisting of a single chromosome of cis in-teractions from the mouse NcoI dataset starting from loading data through producing a 10 Kb heatmap. All normalizations were run using a single processor and pub-licly available scripts/programs. The exception to this was binning the counts and fragment feature data for HiC-Norm. No script was provided for this step so one was written in R to supplement HiCNorm’s functionality.
Runtimes varied greatly between normalization methods, ranging from less than 7 min to approximately 12.5 h (Fig. 4). With the exception of HiFive’s Probability algo-rithm, HiFive performed better in terms of runtime than all other algorithms. HiCPipe and HiCNorm both showed long runtimes at least an order of magnitude above other methods. The slowest approach, though, was HiFive’s Probability algorithm. This was due to its modeling of every interaction combination across the chromosome. HiFive’s implementation of the Knight-Ruiz matrix balancing algorithm, ExpressKR, showed a dramatically faster runtime than any other approach. This was the result of HiFive’s fast data loading and ef-ficient heatmapping without the need for distance-dependence parameter calculations.
Scalability
Because of the ever-increasing resolution of experiments and the corresponding size of interaction datasets, scal-ability is a primary concern for HiC data analysis. Al-though we compared methods on an even playing field, this does not reflect the complete performance picture
when considering finer-scale resolution, processing a complete genome interaction dataset, and more available computational resources.
There are two approaches to determining analysis reso-lution, prior to or after normalization. Of the methods presented, only HiCNorm determines the resolution of analysis prior to normalization. While it performs well, this means that the processing time and memory require-ments scale exponentially with resolution. We were un-able to perform any analyses at resolutions for bin sizes smaller than 10 Kb using this approach. The remaining methods all find correction values for individual fends, meaning that corrections are performed prior to binning interactions.
The increase in dataset size, either due to genome size itself or a finer-scale partitioning of the genome, can be offset by employing more processing power by means of parallelization. HiCLib and HiCNorm do not appear to have any such capability. HiCPipe does have the ability to parallelize calculation of model bin sizes prior to normalization and calculations for heatmap production, although a single processor performs all of the actual normalization calculations. HiFive, on the other hand, has the ability to run in parallel for nearly all phases of an analysis. The two exceptions are loading the initial data and filtering reads, although the latter is very fast already. All normalization algorithms, including the Knight-Ruiz algorithm implemented in HiFive, have been parallelized for HiC analysis using MPI. The parallelization is implemented in such a way that the additional memory overhead for each new process is minimal.
Conclusions
HiC analysis remains a challenging subject, as demon-strated by the varied performances across all method-ologies discussed here. No single approach appears to
[image:8.595.58.541.552.694.2]be ideally suited for all cases, suggesting that the experi-mental goal should drive the choice of analysis software. It is unclear how best to assess HiC normalization perform-ance as there is no ‘gold standard’ for determining the quality of a HiC dataset or how well systematic noise has been accounted for during an analysis. As seen in the dif-ferences in correlation between mouse and human data-sets (Fig. 3), factors such as restriction fragment size distributions, cut site density, sequencing depth, and HiC protocol can dramatically impact the similarity of resulting datasets. Further, in order to detect biologically relevant features against the background of the distance-signal re-lationship, the data need to be transformed, typically using a log-transformation. This skews the resulting comparison by ignoring interactions for which no reads have been ob-served, an increasing problem as binning size decreases or interaction size increases. At longer ranges, non-zero bins are sparse and dominated by macro features (such as A-B compartments), a situation that can result in increasing correlations (Fig. 3a and b). Two observations suggest this is not an artifact. First, the long-range interaction correl-ation increase is seen in the human but not mice data, reflecting differences in genome organization. Second, the correlation increases are seen across all methodologies and algorithms.
Normalization software attempts to account for many of these confounding factors and allow direct comparison between datasets produced by different labs, protocols, and even across species although what can reasonably be expected in terms of this normalization process is unclear. This question depends on many factors and we may not have sufficient understanding of chromatin architecture variability across a cell population to answer it accurately. The resolution (bin size), similarity of datasets in terms of sequencing depth, restriction fragment size distributions, and protocol, as well as cell population size and popula-tion similarity from which the HiC libraries were made will all influence the correlation. At a low resolution, say 1 Mb, we should expect nearly a perfect correlation. How-ever, at much higher resolution differences in mappability and RE cut-site frequency will strongly influence the correlation. Further, we need to consider the distance de-pendence of the signal as this is the strongest driver of the correlation and can give a false impression of comparabil-ity between datasets.
To address these normalization challenges, we have created HiFive, an easy-to-use, fast, and efficient frame-work for frame-working with a variety of chromatin conform-ation data types. Because of the modular storage scheme, re-analysis and downstream analysis is made easier without additional storage or processing require-ments. We have included several different normalization approaches and made nearly all aspects of each algorithm adjustable, allowing users to tune parameters for a wide
range of analysis goals. HiFive is parallelized via MPI, making it highly scalable for nearly every step of HiC data processing.
For 5C data, HiFive is the only analysis program avail-able for normalization and allows easy management of 5C data. We have demonstrated that 5C data normaliza-tions performed by HiFive greatly improve consistency between 5C data and corresponding HiC data across multiple datasets.
We have also shown HiFive’s performance in handling HiC data. HiFive is consistently performing at or above other available methods as measured by inter-dataset correlations for cis interactions. In addition, we have demonstrated that HiFive is tunable to achieve superior trans performance if desired, albeit at the expense of performance across cis interactions. HiFive has also proved capable of handling very high-resolution data, making it useful for the next generation of HiC experi-mental data.
In terms of performance considerations, our analysis suggests that, out of all of the methods considered, the balance between speed and accuracy is best achieved by HiFive-Express or HiFive-ExpressKR. This appears to be true regardless of resolution or dataset size. In order to get this performance, it is crucial to use the distance-dependence adjustment prior to normalizing, necessitat-ing the need to pre-calculate the distance-dependence function. Because this requires iterating over every pos-sible interaction, using multiple processors is highly rec-ommended. If not possible, HiFive-ExpressKR without distance correction is a robust fallback method. If compu-tational resources are not a limiting factor, we recommend HiFive-Probability. With approximately 100 CPUs, the high-resolution human data were processed in about a day. At fine-scale binning, this approach yields the best re-sults of all methods.
While HiFive allows for superior normalization of data compared to other available software under many condi-tions, it also provides users with alternative options for fast analysis with minimal computational requirements at only a slight accuracy cost, opening high-resolution HiC and 5C analysis to a much larger portion of the sci-entific community. HiFive is available at http://taylorla-b.org/software/hifive/. Source code is provided under an MIT license and at https://github.com/bxlab/hifive or installed using pip from http://pypi.python.org.
Additional files
Additional file 1:A detailed methods section, a table listing the sources of datasets used, and Supplemental figures.(PDF 2245 kb)
Additional file 3:A tar archive containing all scripts using to generate the data, analyses, and figures presented in this paper.
(BZ2 20009 kb)
Additional file 4:The software documentation.(PDF 530 kb)
Abbreviations
3C:chromosome conformation capture; 5C: 3C carbon copy; bp: base pair; cis: intra-chromosomal; CPU: central processing unit; ESC: Embryonic stem cell; Fend: fragment-end; Kb: kilobase; Mb: megabase; MPI: message passing interface; RE: restriction enzyme; trans: inter-chromosomal.
Competing interests
The authors declare that they have no competing interests.
Authors’contributions
MEGS, JEPC, VGC, and JT conceived the project and developed feature requirements. JEPC made significant contributions to the design of the 5C tools. MEGS developed all algorithms, designed and wrote all software, and wrote the manuscript. JT contributed to the manuscript and supported the project. All authors read and approved the final manuscript.
Acknowledgements
Research reported in this publication was supported by the National Institutes of Health under awards R01GM035463 to VC and R01DK065806 to JT and by American Recovery and Reinvestment Act (ARRA) funds through grant number RC2HG005542 to JT. The content is solely the responsibility of the authors and does not necessarily represent the official views of the National Institutes of Health.
Author details
1Departments of Biology and Computer Science, Johns Hopkins University,
Baltimore, MD 21218, USA.2Department of Bioengineering, University of Pennsylvania, Philadelphia, PA 19103, USA.3Department of Biology, Emory University, Atlanta, GA 30322, USA.
Received: 8 May 2015 Accepted: 14 October 2015
References
1. Arnone MI, Davidson EH. The hardwiring of development: organization and function of genomic regulatory systems. Development. 1997;124:1851–64. 2. Zinzen RP, Girardot C, Gagneur J, Braun M, Furlong EE. Combinatorial
binding predicts spatio-temporal cis-regulatory activity. Nature. 2009;462:65–70. 3. He A, Kong SW, Ma Q, Pu WT. Co-occupancy by multiple cardiac
transcription factors identifies transcriptional enhancers active in heart. Proc Natl Acad Sci U S A. 2011;108:5632–7.
4. Cantone I, Fisher AG. Epigenetic programming and reprogramming during development. Nat Struct Mol Biol. 2013;20:282–9.
5. Varriale A. DNA Methylation, epigenetics, and evolution in vertebrates: facts and challenges. Int J Evol Biol. 2014;2014:475981.
6. Kimura H. Histone modifications for human epigenome analysis. J Hum Genet. 2013;58:439–45.
7. Fullwood MJ, Han Y, Wei CL, Ruan X, Ruan Y. Chromatin interaction analysis using paired-end tag sequencing. Curr Protoc Mol Biol. 2010;Chapter 21:Unit 21.15.21–25.
8. Kalhor R, Tjong H, Jayathilaka N, Alber F, Chen L. Genome architectures revealed by tethered chromosome conformation capture and population-based modeling. Nat Biotechnol. 2012;30:90–8.
9. Dekker J, Rippe K, Dekker M, Kleckner N. Capturing chromosome conformation. Science. 2002;295:1306–11.
10. Dostie J, Richmond TA, Arnaout RA, Selzer RR, Lee WL, Honan TA, et al. Chromosome Conformation Capture Carbon Copy (5C): a massively parallel solution for mapping interactions between genomic elements. Genome Res. 2006;16:1299–309.
11. Zhao Z, Tavoosidana G, Sjolinder M, Gondor A, Mariano P, Wang S, et al. Circular chromosome conformation capture (4C) uncovers extensive networks of epigenetically regulated intra- and interchromosomal interactions. Nat Genet. 2006;38:1341–7.
12. Lieberman-Aiden E, van Berkum NL, Williams L, Imakaev M, Ragoczy T, Telling A, et al. Comprehensive mapping of long-range interactions reveals folding principles of the human genome. Science. 2009;326:289–93. 13. van Berkum NL, Dekker J. Determining spatial chromatin organization of
large genomic regions using 5C technology. Methods Mol Biol. 2009;567:189–213.
14. Yaffe E, Tanay A. Probabilistic modeling of Hi-C contact maps eliminates systematic biases to characterize global chromosomal architecture. Nat Genet. 2011;43:1059–65.
15. Rao SS, Huntley MH, Durand NC, Stamenova EK, Bochkov ID, Robinson JT, et al. A 3D map of the human genome at kilobase resolution reveals principles of chromatin looping. Cell. 2014;159:1665–80.
16. Hu M, Deng K, Selvaraj S, Qin Z, Ren B, Liu JS. HiCNorm: removing biases in Hi-C data via Poisson regression. Bioinformatics. 2012;28:3131–3. 17. Imakaev M, Fudenberg G, McCord RP, Naumova N, Goloborodko A, Lajoie
BR, et al. Iterative correction of Hi-C data reveals hallmarks of chromosome organization. Nat Methods. 2012;9:999–1003.
18. Hu M, Deng K, Qin Z, Dixon J, Selvaraj S, Fang J, et al. Bayesian inference of spatial organizations of chromosomes. PLoS Comput Biol. 2013;9:e1002893. 19. Jin F, Li Y, Dixon JR, Selvaraj S, Ye Z, Lee AY, et al. A high-resolution map of
the three-dimensional chromatin interactome in human cells. Nature. 2013;503:290–4.
20. Li W, Gong K, Li Q, Alber F, Zhou XJ. Hi-Corrector: a fast, scalable and memory-efficient package for normalizing large-scale Hi-C data. Bioinformatics. 2015;31:960–2.
21. Servant N, Lajoie BR, Nora EP, Giorgetti L, Chen CJ, Heard E, et al. HiTC: exploration of high-throughput‘C’experiments. Bioinformatics. 2012;28:2843–4.
22. Rousseau M, Fraser J, Ferraiuolo MA, Dostie J, Blanchette M. Three-dimensional modeling of chromatin structure from interaction frequency data using Markov chain Monte Carlo sampling. BMC Bioinformatics. 2011;12:414.
23. Nora EP, Lajoie BR, Schulz EG, Giorgetti L, Okamoto I, Servant N, et al. Spatial partitioning of the regulatory landscape of the X-inactivation centre. Nature. 2012;485:381–5.
24. Phillips-Cremins JE, Sauria ME, Sanyal A, Gerasimova TI, Lajoie BR, Bell JS, et al. Architectural protein subclasses shape 3D organization of genomes during lineage commitment. Cell. 2013;153:1281–95.
25. Ay F, Bailey TL, Noble WS. Statistical confidence estimation for Hi-C data reveals regulatory chromatin contacts. Genome Res. 2014;24:999–1011. 26. Knight PA, Ruiz D. A fast algorithm for matrix balancing. IMA J Numerical
Anal. 2013;33:1029–47.
27. Dixon JR, Selvaraj S, Yue F, Kim A, Li Y, Shen Y, et al. Topological domains in mammalian genomes identified by analysis of chromatin interactions. Nature. 2012;485:376–80.
28. Floyd SR, Pacold ME, Huang Q, Clarke SM, Lam FC, Cannell IG, et al. The bromodomain protein Brd4 insulates chromatin from DNA damage signalling. Nature. 2013;498:246–50.
29. Naumova N, Imakaev M, Fudenberg G, Zhan Y, Lajoie BR, Mirny LA, et al. Organization of the mitotic chromosome. Science. 2013;342:948–53. 30. Cournac A, Marie-Nelly H, Marbouty M, Koszul R, Mozziconacci J.
Normalization of a chromosomal contact map. BMC Genomics. 2012;13:436. 31. Selvaraj S, RD J, Bansal V, Ren B. Whole-genome haplotype reconstruction
using proximity-ligation and shotgun sequencing. Nat Biotechnol. 2013;31:8.
Submit your next manuscript to BioMed Central and take full advantage of:
• Convenient online submission
• Thorough peer review
• No space constraints or color figure charges
• Immediate publication on acceptance
• Inclusion in PubMed, CAS, Scopus and Google Scholar
• Research which is freely available for redistribution