Improved Detection of Respiratory
Pathogens by Use of High-Quality
Sputum with TaqMan Array Card
Technology
Bernard J. Wolff,aAnna M. Bramley,bKathleen A. Thurman,a
Cynthia G. Whitney,aBrett Whitaker,cWesley H. Self,dSandra R. Arnold,e,f Christopher Trabue,eRichard G. Wunderink,gJon McCullers,e,f,h
Kathryn M. Edwards,dSeema Jain,bJonas M. Winchella
Division of Bacterial Diseases, Centers for Disease Control and Prevention, Atlanta, Georgia, USAa; Influenza Division, Centers for Disease Control and Prevention, Atlanta, Georgia, USAb; Division of Viral Diseases, Centers for Disease Control and Prevention, Atlanta, Georgia, USAc; Vanderbilt University School of Medicine, Nashville, Tennessee, USAd; University of Tennessee Health Science Center/Saint Thomas Health, Nashville, Tennessee, USAe; Le Bonheur Children's Hospital, Memphis, Tennessee, USAf; Northwestern University Feinberg School of Medicine, Chicago, Illinois, USAg; St. Jude Children's Research Hospital, Memphis, Tennessee, USAh
ABSTRACT New diagnostic platforms often use nasopharyngeal or oropharyngeal (NP/OP) swabs for pathogen detection for patients hospitalized with community-acquired pneumonia (CAP). We applied multipathogen testing to high-quality spu-tum specimens to determine if more pathogens can be identified relative to NP/OP swabs. Children (⬍18 years old) and adults hospitalized with CAP were enrolled over 2.5 years through the Etiology of Pneumonia in the Community (EPIC) study. NP/OP specimens with matching high-quality sputum (defined as ⱕ10 epithelial cells/low-power field [lpf] andⱖ25 white blood cells/lpf or a quality score [q-score] definition of 2⫹) were tested by TaqMan array card (TAC), a multipathogen real-time PCR de-tection platform. Among 236 patients with matched specimens, a higher proportion of sputum specimens had ⱖ1 pathogen detected compared with NP/OP specimens in children (93% versus 68%;P⬍0.0001) and adults (88% versus 61%; P⬍0.0001); for each pathogen targeted, crossing threshold (CT) values were earlier in sputum.
Both bacterial (361 versus 294) and viral detections (245 versus 140) were more common in sputum versus NP/OP specimens, respectively, in both children and adults. When available, high-quality sputum may be useful for testing in hospitalized CAP patients.
KEYWORDS community-acquired pneumonia, pneumonia, multipathogen, diagnostics, TaqMan array card, NP/OP, TAC, sputum
A
cute respiratory infections (ARI), especially lower respiratory tract (LRT) infections, including community-acquired pneumonia (CAP), are a significant cause of mor-bidity and mortality globally (1–3). Despite advances in diagnostic testing beyond culture-based methods, including molecular and antigen-based approaches, pneumo-nia etiology often remains undetermined even when systematic and comprehensive specimen collection and methods are employed, particularly in adults (1, 2); one reason for this is that specimens directly from the lungs are often not available. Upper respiratory tract specimens, such as nasopharyngeal and oropharyngeal (NP/OP) swabs, are often collected for molecular testing of respiratory pathogens due to the ease of collection. Some studies suggest that LRT specimens, such as sputum, endotracheal aspirates (ETA), and bronchoalveolar lavage (BAL) fluids, have improved sensitivity compared with NP/OP swabs; while issues of specificity needed to inform clinicianReceived26 August 2016Returned for
modification5 October 2016Accepted12
October 2016
Accepted manuscript posted online19
October 2016
CitationWolff BJ, Bramley AM, Thurman KA,
Whitney CG, Whitaker B, Self WH, Arnold SR, Trabue C, Wunderink RG, McCullers J, Edwards KM, Jain S, Winchell JM. 2017. Improved detection of respiratory pathogens by use of high-quality sputum with TaqMan array card technology. J Clin Microbiol 55:110 –121. https://doi.org/10.1128/JCM.01805-16.
EditorAndrew B. Onderdonk, Brigham and
Women's Hospital
Copyright© 2016 American Society for
Microbiology. All Rights Reserved.
Address correspondence to Jonas M. Winchell, jwinchell@cdc.gov.
crossm
on May 16, 2020 by guest
http://jcm.asm.org/
decision making remain, diagnostic results from LRT specimens may be informative to understand the whole array of possible pathogens and codetections, which could improve our understanding of pathogenesis in ARI and CAP, including the respiratory microbiome (4–11).
For this study, we specifically used the TaqMan array card (TAC) (Thermo Fisher Scientific), a multipathogen detection technology, to simultaneously detect bacterial and viral respiratory pathogens in matched NP/OP and high-quality sputum specimens from patients hospitalized with ARI, including a subset with CAP, to understand pathogenic yield with specific pathogen detections and also codetections.
RESULTS
Characteristics of included patients. Of 236 patients hospitalized with ARI for whom both NP/OP and high-quality sputum specimens were collected, 82 (35%) were children and 154 (65%) were adults (Table 1). NP/OP and sputum specimens were collected within 3 days of hospital admission; each specimen type was collected within 2 days of the other. Radiographic pneumonia was confirmed in 204 (86%) hospitalized patients with ARI (Table 1).
Distribution of respiratory pathogens overall results. In matched NP/OP and high-quality sputum specimens collected from 236 patients, there were a combined 415 bacterial and 254 viral detections. A pathogen was detected in 215 (91%) sputum specimens and 191 (81%) NP/OP specimens. A higher proportion of sputum specimens hadⱖ1 pathogen detected compared with NP/OP specimens in children (93% versus 68%;P⬍0.0001) and adults (88% versus 61%;P⬍0.0001).
[image:2.585.41.371.84.403.2]Overall, viral pathogens were more frequently detected in children than in adults when considering both specimen types (45% versus 29%;P⬍ 0.001). Among those TABLE 1Patient demographics
Characteristic
Total (nⴝ236) (no. [%])
Children (nⴝ82) (no. [%])
Adults (nⴝ154) (no. [%]) Site
Chicago 28 (11.9) N/Aa 28 (18.2)
Memphis 82 (34.8) 82 (100) N/A
Nashville 126 (53.4) N/Aa 126 (81.8)
Age group
0–23 mo 50 (21.2) 50 (61.0)
2–4 yr 16 (6.8) 16 (19.5)
5–9 yr 6 (2.5) 6 (7.3)
10–17 yr 10 (4.2) 10 (12.2)
18–49 yr 41 (17.4) 41 (26.6)
50–64 yr 52 (22.0) 52 (33.8)
65–79 yr 45 (19.1) 45 (29.2)
ⱖ80 yr 16 (6.8) 16 (10.4)
Gender
Male 132 (55.9) 46 (56.1) 86 (55.8)
Race/ethnicity
Non-Hispanic white 106 (44.9) 11 (13.4) 95 (61.7)
Non-Hispanic black 113 (47.9) 64 (78.1) 49 (31.8)
Hispanic 11 (4.7) 4 (4.9) 7 (4.6)
Other 6 (2.5) 3 (3.7) 3 (2.0)
Radiographic pneumonia 204 (86.4) 68 (82.9) 136 (88.3)
Timing of specimen collection, median days (IQRb)
Hospital admission to sputum collection 1 (0–1) 1 (0–1) 1 (0–1) Hospital admission to NP/OP collection 1 (0–1) 1 (0–1) 1 (0–1) Sputum collection to NP/OP collection 0 (0–0) 0 (0–0) 0 (0–0)
aN/A, not applicable.
bIQR, interquartile range.
on May 16, 2020 by guest
http://jcm.asm.org/
with at least one specimen type that was positive for a virus, detections were more frequent in high-quality sputum than in NP/OP specimens (96% versus 55%;P⬍0.001). Among children, 46% of viral detections were in high-quality sputum alone, and among adults, 44% of viral detections were detected in high-quality sputum only. Both bacterial (361 versus 294) and viral detections (245 versus 140) were more common in sputum specimens than in NP/OP specimens, respectively, in both children and adults. Distribution of respiratory pathogens in children.Every child had at least one pathogen detected. Among 82 children, a pathogen was detected in 99% of NP/OP specimens and 100% of high-quality sputum specimens (totaln⫽164); overall, there were 379 detections (210 [55%] bacteria and 169 [45%] viruses) (Table 2). Among these, 28 (7%) (22 bacteria and 6 viruses) were from NP/OP specimens only, 121 (32%) (44 bacteria and 77 viruses) were from high-quality sputum specimens only, and 230 (61%) (144 bacteria and 86 viruses) were from both specimens. For each pathogen tested, the diagnostic yield was higher for sputum specimens than for NP/OP swabs, but the increase in yield varied from pathogen to pathogen, ranging from the lowest increase in yield for respiratory syncytial virus (RSV) (9%) to the highest for adenovirus (214%). On average, sputum increased diagnostic yield by 84.7% for the pathogens tested in children. Parechovirus detections were unique to sputum.
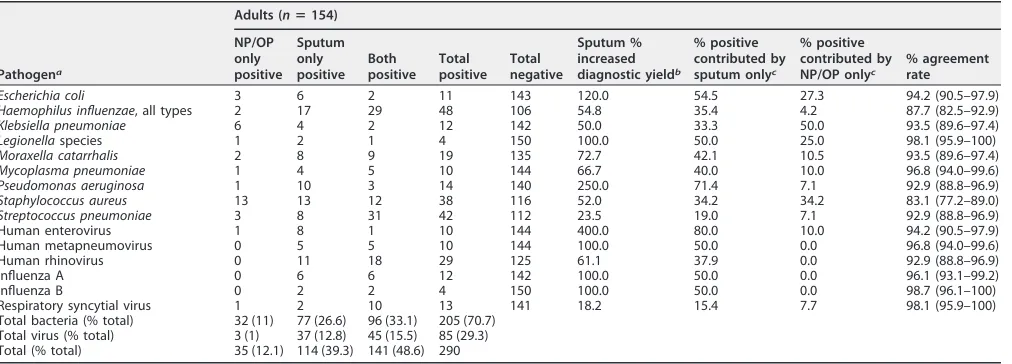
Distribution of respiratory pathogens in adults.A pathogen was detected in 91% of adults by either specimen type. Among 154 adults, a pathogen was detected in 72% of NP/OP specimens and 86% of high-quality sputum specimens (totaln⫽308); overall, there were 290 detections (205 [71%] bacteria and 85 [29%] viruses) (Table 3). Among these 290 detections, 35 (12%) (32 bacteria and 3 viruses) were from the NP/OP specimens only, 114 (39%) (77 bacteria and 37 viruses) were from high-quality sputum specimens only, and 141 (49%) (96 bacteria, 45 viruses) were from both specimens. For adults, the diagnostic yield was also higher for sputum than for NP/OP swabs, ranging from 18% higher for RSV to 400% higher for human enterovirus. On average, sputum increased diagnostic yield by 104.6% for the pathogens tested in adults.
Crossing threshold values of positive matched NP/OP and sputum specimens. Figure 1A displays the average difference in the crossing threshold (CT) values for the
viral pathogens among those who were positive in both specimen types. Only para-influenza virus 1 (PIV1) (n ⫽1) and PIV3 (n ⫽3) had earlierCTvalues in the NP/OP
[image:3.585.43.550.83.255.2]specimen than in matched high-quality sputum specimens, but these differences were TABLE 2Testing results of children specimens
Pathogena
Children (nⴝ82)
NP/OP only positive (no.)
Sputum only positive (no.)
Both positive (no.)
Total positive (no.)
Total negative (no.)
Sputum % increased
diagnostic yieldb
% positive contributed by
sputum onlyc
% positive contributed by
NP/OP onlyc
% agreement rate
Haemophilus influenzae, all types 5 11 44 60 22 22.4 18.3 8.3 80.5 (71.9–89.1) Moraxella catarrhalis 2 9 42 53 29 20.5 17.0 3.8 86.6 (79.2–94.0) Mycoplasma pneumoniae 0 1 6 7 75 16.7 14.3 0.0 98.8 (96.4–100) Staphylococcus aureus 8 8 8 24 58 50.0 33.3 33.3 80.5 (71.9–89.1) Streptococcus pneumoniae 3 13 41 57 25 29.5 22.8 5.3 80.5 (71.9–89.1) Streptococcus pyogenes 4 2 2 8 74 33.3 25.0 50.0 92.7 (87.1–98.3)
Adenovirus, all types 1 15 6 22 60 214.3 68.2 4.5 80.5 (71.9–89.1)
Human coronavirus OC43 0 4 2 6 76 200.0 66.7 0.0 95.1 (90.5–99.8)
Human enterovirus 1 21 9 31 51 210.0 67.7 3.2 73.2 (63.6–82.8)
Human metapneumovirus 0 1 7 8 74 14.3 12.5 0.0 98.8 (96.4–100)
Human parainfluenza virus 4 0 6 3 9 73 200.0 66.7 0.0 92.7 (87.1–98.3)
Human parechovirus 0 4 0 4 78 100.0 0.0 95.1 (90.5–99.8)
Human rhinovirus 1 18 21 40 42 81.8 45.0 2.5 76.8 (67.7–86.0)
Respiratory syncytial virus 3 3 32 38 44 8.6 7.9 7.9 92.7 (87.1–98.3)
Total bacteria (% total) 22 (5.8) 44 (11.6) 144 (38) 210 (55.4) Total virus (% total) 6 (1.6) 77 (20.3) 86 (22.7) 169 (44.6) Total (% total) 28 (7.4) 121 (31.9) 230 (60.7) 379
aPathogens with 3 or fewer detections are not shown. Those includeBordetella pertussis(0),Chlamydophila pneumoniae(1),Legionellaspecies (0), human coronavirus 229E (0), human coronavirus HKU1 (2), human coronavirus NL63 (0), human parainfluenza virus 1 (1), human parainfluenza virus 2 (2), human parainfluenza virus 3 (3), influenza A (2), influenza B (0), influenza C (1).
bIncrease in diagnostic yield contributed by sputum was calculated as follows: (positive detections by sputum only)/(positive detections by sputum and NP/OP⫹ positive detections by NP/OP only) (33).
cContribution calculations were performed as follows: (number of positives found in only one specimen type)/(total number of positives found in either specimen type).
on May 16, 2020 by guest
http://jcm.asm.org/
not statistically significant. Twelve viral targets had earlier CTvalues in high-quality
sputum than in the matched NP/OP specimen, of which six were statistically significant differences; most notable were rhinovirus detections, which were on average 12.3 cycles earlier in high-quality sputum than in the NP/OP specimen (n ⫽39), but this pattern was also true for influenza A viruses (8.8 cycles;n⫽7), human enterovirus (4.8 cycles;n⫽10), RSV (4.4 cycles;n⫽42), human metapneumovirus (HMPV) (3.1 cycles; n⫽12), and human parainfluenza virus 4 (5.1 cycles;n⫽3).
The results of the bacterial pathogens also demonstrated consistently earlier CT
values (Fig. 1B). Escherichia coli was the only bacterial pathogen that had an earlier averageCTvalue in the NP/OP specimen than high-quality sputum, but this difference
was not statistically significant. The remaining 11 bacterial pathogens all had earlierCT
values in high-quality sputum than in the NP/OP specimen, with four targets displaying statistically significant differences between CT values in the two different specimen
types (Haemophilus influenzae, Moraxella catarrhalis, Mycoplasma pneumoniae, and Streptococcus pneumoniae). Among samples from 11 patients with both specimen types positive forM. pneumoniae, high-quality sputum had an averageCTvalue that was 6.5
cycles earlier than NP/OP. A single sputum-NP/OP pair containedBordetella pertussisin both specimens; the high-quality sputum specimen had aCTvalue that was 18.2 cycles
earlier than the NP/OP specimen. Nine other pathogens had earlier CT values in
high-quality sputum that ranged from 1 cycle (Staphylococcus aureus;n⫽20) to 7.5 cycles (Legionella pneumophila;n⫽1).
Frequency of detections in children and adults.The frequency of detection for 16 of 20 pathogens included on both pediatric and adult TAC, and detected on either specimen type, was higher in children than in adults (Fig. 2). Several viruses were each significantly (P⬍0.001) more frequently detected in children than adults considering either specimen type, including adenovirus (27% versus 0.6%), enterovirus (38% versus 6%), RSV (46% versus 8%), and human rhinovirus (49% versus 19%). Several bacterial detections were also significantly (P⬍0.001) more frequent in children than adults, includingStreptococcus pyogenes(10% versus 2%),H. influenzae(73% versus 31%),M. catarrhalis(65% versus 12%), andS. pneumoniae(70% versus 27%).
[image:4.585.43.549.82.264.2]The total number of detections in any individual patient was also higher in children than in adults. All 82 children were positive for ⱖ1 pathogen, and 78 (95%) were positive forⱖ2 pathogens (Fig. 3A) when considering both specimens. The majority of TABLE 3Testing results of adult specimens
Pathogena
Adults (nⴝ154)
NP/OP only positive
Sputum only positive
Both positive
Total positive
Total negative
Sputum % increased
diagnostic yieldb
% positive contributed by
sputum onlyc
% positive contributed by
NP/OP onlyc
% agreement rate
Escherichia coli 3 6 2 11 143 120.0 54.5 27.3 94.2 (90.5–97.9) Haemophilus influenzae, all types 2 17 29 48 106 54.8 35.4 4.2 87.7 (82.5–92.9) Klebsiella pneumoniae 6 4 2 12 142 50.0 33.3 50.0 93.5 (89.6–97.4) Legionellaspecies 1 2 1 4 150 100.0 50.0 25.0 98.1 (95.9–100) Moraxella catarrhalis 2 8 9 19 135 72.7 42.1 10.5 93.5 (89.6–97.4) Mycoplasma pneumoniae 1 4 5 10 144 66.7 40.0 10.0 96.8 (94.0–99.6) Pseudomonas aeruginosa 1 10 3 14 140 250.0 71.4 7.1 92.9 (88.8–96.9) Staphylococcus aureus 13 13 12 38 116 52.0 34.2 34.2 83.1 (77.2–89.0) Streptococcus pneumoniae 3 8 31 42 112 23.5 19.0 7.1 92.9 (88.8–96.9)
Human enterovirus 1 8 1 10 144 400.0 80.0 10.0 94.2 (90.5–97.9)
Human metapneumovirus 0 5 5 10 144 100.0 50.0 0.0 96.8 (94.0–99.6)
Human rhinovirus 0 11 18 29 125 61.1 37.9 0.0 92.9 (88.8–96.9)
Influenza A 0 6 6 12 142 100.0 50.0 0.0 96.1 (93.1–99.2)
Influenza B 0 2 2 4 150 100.0 50.0 0.0 98.7 (96.1–100)
Respiratory syncytial virus 1 2 10 13 141 18.2 15.4 7.7 98.1 (95.9–100)
Total bacteria (% total) 32 (11) 77 (26.6) 96 (33.1) 205 (70.7) Total virus (% total) 3 (1) 37 (12.8) 45 (15.5) 85 (29.3) Total (% total) 35 (12.1) 114 (39.3) 141 (48.6) 290
aPathogens with 3 or fewer detections are not shown. Those includeA. baumannii(0),B. pertussis(3),C. pneumoniae(1),Streptococcus pyogenes(3), adenovirus (1), human parainfluenza virus 1 (1), human parainfluenza virus 2 (1), human parainfluenza virus 3 (3), influenza C (1).
bIncrease in diagnostic yield contributed by sputum was calculated as follows: (positive detections by sputum only)/(positive detections by sputum and NP/OP⫹ positive detections by NP/OP only) (33).
cContribution calculations were performed as follows: (number of positives found in only one specimen type)/(total number of positives found in either specimen type).
on May 16, 2020 by guest
http://jcm.asm.org/
FIG 1(A) MeanCTdifference for viral and (B) bacterial pathogens. Thexaxis represents the pathogen tested, and the code for each
pathogen is listed in Table 4. The high-quality sputum and NP/OPCTvalues were averaged for each target when results were positive
from both specimen types. The high-quality sputumCTaverage was subtracted from the matching NP/OPCT. A positive number along
theyaxis indicates the number of cycles the high-quality sputum specimen outperformed the matching NP/OP specimen, while a negative number indicates the number of cycles the NP/OP specimen outperformed the high-quality sputum specimen. The number of patients in which both specimens were positive is given below the target code on thexaxis, and an asterisk indicates statistical significance (Pⱕ0.05) using a pairedttest.
on May 16, 2020 by guest
http://jcm.asm.org/
[image:5.585.52.461.60.645.2]children (n⫽58; 71%) had three to six detected pathogens. In children, an average of 2.6 bacterial pathogens was detected when considering both specimens, 2.0 detections in NP/OP alone and 2.3 detections in sputum only. An average of 2.1 viral pathogens was detected when considering both specimens, 1.1 detections in NP/OP alone and 2.0 detections in sputum alone.
Among 154 adults, 140 (91%) were positive forⱖ1 pathogen and 94 (61%) forⱖ2 pathogens (Fig. 3B). The majority of adults (n⫽103; 67%) tested positive for either one or two pathogens. In adults, an average of 1.3 bacterial pathogens was detected when considering both specimens, 0.8 detections in NP/OP alone and 1.1 in sputum alone. The average adult patient tested positive for 1.3 viruses when considering both specimens, 0.83 for NP/OP alone and 1.12 viruses in sputum only.
The most common codetection observed with either a bacterial or viral pathogen considering both specimen types wasH. influenzaeandS. pneumoniaein pediatric (n⫽ 46) and adult patients (n ⫽ 13). M. catarrhalis and S. aureus were also frequently codetected with other bacteria in both age groups. The viral targets adenovirus, enterovirus, RSV, and rhinovirus were most often codetected with the other pathogens tested in children. Enterovirus, RSV, and rhinovirus were the most common codetec-tions for the viral pathogens in adults (see Fig. S3 and S4 in the supplemental material).
DISCUSSION
Using a novel multipathogen testing platform, we simultaneously tested for a large number of bacterial and viral respiratory pathogens with paired NP/OP and high-quality sputum specimens from adults and children hospitalized with ARI, the majority of whom had CAP. More viruses than bacteria were detected in both children and adults, and CT values were earlier for almost all pathogens in high-quality sputum than in
FIG 2Target detection frequencies in the child and adult cohorts in NP/OP and sputum specimens. Frequencies of pathogens present on both the pediatric and adult card were analyzed. Thexaxis represents the pathogen tested, and the code for each target is listed in Table 4. They axis represents percent positive for both the adult (gray) and child (black) cohorts.
on May 16, 2020 by guest
http://jcm.asm.org/
[image:6.585.43.503.74.386.2]NP/OP specimens. These data demonstrate the potential utility of high-quality sputum and TAC as valuable tools for multipathogen testing, adding to the evidence base that the use of LRT specimens, when available, can help identify potential CAP pathogens in hospitalized patients (12, 13).
Our analysis demonstrated that using TAC on high-quality sputum led to 32% more detections in children and 39% more in adults than NP/OP specimens only. These missed detections represent a substantial loss in the potential identification of CAP pathogens and remarkably yielded more viruses in children and adults. In our analysis, viruses were missed in 13% of adults and 20% of children when high-quality sputum
FIG 3The number of pathogens detected in individual patients for children (A) and adults (B). The number of pathogens detected in either the NP/OP or high-quality sputum specimen for each patient was calculated. Thexaxis represents the number of pathogens detected in a single specimen, and theyaxis represents the number of patients in which that number of pathogens was found. The percentages for each are stated above each bar.
on May 16, 2020 by guest
http://jcm.asm.org/
[image:7.585.41.463.78.564.2]was not included in the original viral testing algorithm. This correlates to other studies that demonstrated a preference for LRT specimens (8, 14–16). The observed increased detection of bacteria in high-quality sputum for adults compared with that for children may be, in part, because the adult TAC had four extra bacterial targets (Acinetobacter baumannii,E. coli,Klebsiella pneumoniae, andPseudomonas aeruginosa) compared with those of the pediatric card; these 4 targets accounted for approximately 20% of the bacterial detections in adults.
In many instances, there was a dramatic increase in detection from high-quality sputum for pathogens for which the recommended and most commonly collected specimen is an upper respiratory swab, such asM. pneumoniae, rhinovirus, enterovirus, HMPV, and influenza. For example, rhinovirus would have been missed in 45% of children and 38% of adults tested, and in adults alone, half of the influenza and 40% of theM. pneumoniaedetections would have been missed if high-quality sputum was not included. Nearly every viral pathogen tested in children was more frequently detected when high-quality sputum testing was added than with NP/OP testing alone. However, high-quality sputum did not result in a noticeable increase in the detection of RSV,S. pyogenes, andS. aureus. However, RSV did have a statistically significant earlier averageCTvalue in sputum specimens than in NP/OP specimens. Collectively, the data
from this study highlight the increased sensitivity of high-quality sputum when testing for respiratory pathogens, although detection does not necessarily equate to the etiologic agent.
TheCTvalues were also consistently earlier in high-quality sputum compared with
those in paired NP/OP specimens. This gives earlier time-to-detection on a real-time PCR platform, higher confidence in the results due to the earlierCTvalues possibly due
to higher pathogen load, and a likely earlier limit of detection. We also noted a greater and favorableCTdifference for the viral pathogens compared with that of the bacterial
targets in sputum compared with NP/OP specimens. Specifically, earlier and increased detection of adenovirus, enterovirus, and rhinovirus in sputum samples is somewhat surprising given that these viruses have varied spectrums of clinical presentation and are often associated with upper respiratory infections (17–19). Our findings are in agreement with other studies using LRT specimens, which also demonstrated increased detections and earlier CT values compared with those of upper respiratory tract
specimens (4, 5, 8, 11). Our rhinovirus data correlates with data from Karhu et al. who reported rhinovirus to be the most common viral pathogen found in BAL specimens among ventilated patients admitted to the intensive care unit (8). In addition, Gadsby et al. also found rhinovirus to be the most common pathogen from sputum specimens from admitted patients with radiologically confirmed CAP using PCR (6). Our adenovi-rus, enteroviadenovi-rus, and rhinovirus results along with the data from Karhu et al. and Gadsby et al. indicate that greater concentrations of certain viruses in the LRT may be present in patients with CAP compared with those detected in NP/OP specimens alone (6, 8). The ability to detect bacteria and to accurately measure CTvalues may have been
affected by the antibiotic treatment that these CAP patients received before sample collection.
While our results indicate that high-quality sputum can outperform NP/OP speci-mens in detecting the majority of targets, high-quality sputum samples were difficult to obtain. Among all adults (n⫽2,488) enrolled in the EPIC study, approximately 33% had a sputum specimen of any quality, among which 36% were high-quality, resulting in our sample only representing 12% of enrolled patients. The pediatric sputum speci-mens in this analysis were not part of the main EPIC study pediatric protocol, and thus sampling was only performed at the Memphis site for an exploratory substudy. However, among 977 enrolled children at the Memphis site, induced sputum collection was attempted in 93% of patients, among whom only 19% produced specimens of high-quality, representing only 18% of enrollees.
TAC may offer several advantages over traditional molecular testing methods. The simultaneous detection of many pathogens using TAC offers a comparable limit of detection with standard singleplex real-time PCR assays while reducing error by
on May 16, 2020 by guest
http://jcm.asm.org/
eliminating the need for excess handling associated with aliquoting, transporting, and setup of the tests necessary using culture methods (20, 21). Using TAC, we investigated a larger number of pathogens that were both bacterial and viral to further examine the value of LRT specimens for pathogen detection.
This study has limitations. First, as in any multipathogen study, including those using the TAC platform, the attribution of a causative etiology is difficult when multiple detections occur in a patient. Further, detection of a pathogen does not equate causation, and asymptomatic control sputum samples were not available (22, 23). Second, although sputum specimens can be considered LRT specimens, the possibility of upper respiratory tract “contaminants” partially affecting the results exists as the sputum must transit the oropharynx during collection, particularly for bacteria known to colonize the oropharynx (24, 25). Thus, sputum results require further clinical interpretation by clinicians. Third, our sample size was small because we focused on high-quality sputum samples due to higher confidence in high-quality specimens specifically for bacterial determinations in CAP. High-quality specimens may not be needed for virus detection, but this warrants further study. Fourth, specimen quality can vary between patients and standardization of specimens is difficult, thereby limiting pathogen load confidence. Fifth, while TAC technology requires certain infra-structure to be in place and is not yet commercially available, it has previously been shown to be extremely valuable in outbreak settings, with the CDC serving as a reference lab for testing (26, 27). This analysis demonstrates the potential use of TAC for pathogen detection in clusters of hospitalized patients with ARI or CAP for whom high-quality sputum and/or NP/OP samples are available. Sixth, we did not have the resources to test BAL fluid or ETA, but other studies have already demonstrated the utility of these specimen types for both bacteria and viruses using real-time PCR (8). And finally, although TAC tests for a number of pathogens, the list is not exhaustive, and several targets that were tested had too few detections to comment on the benefit of sputum testing. This may be the result of the antibiotic treatment that a large number of patients received prior to specimen collection. More expansive studies are needed to determine if the results hold true for a wider variety of pathogens that have clinical relevance (28).
This analysis underscores the increased pathogen yield when collecting high-quality sputum specimens from patients hospitalized with ARI, including CAP, highlighting TAC as a potentially valuable tool for respiratory pathogen detection. While TAC may not be available in all settings, it is important to note that TAC is a PCR-based method and demonstrates the utility of molecular-based methods for the detection of respiratory pathogens. Further research, including determining the etiologic fraction in studies with non-ill controls, is needed to determine the utility of using molecular methods to test high-quality sputum from both children and adults with pneumonia for both bacteria and viruses. While high-quality LRT specimens can be difficult to obtain and more cumbersome to process due to their viscous nature, the substantial improvement in detection and concentration of potential pathogens may ultimately lead to a better understanding of the role of specific respiratory pathogens in the pathogenesis of ARI, including CAP, and also the respiratory microbiome. This improved knowledge may lead to the future development of new therapeutics as well as diagnostics for bacterial and viral respiratory pathogens.
MATERIALS AND METHODS
Study population and case definitions.From 1 January 2010 to 30 June 2012, children of⬍18 years and adults were enrolled in the Etiology of Pneumonia in the Community (EPIC) study at three pediatric hospitals (one each in Memphis, TN, Nashville, TN, and Salt Lake City, UT), three adult hospitals in Chicago, IL, and two adult hospitals in Nashville, TN (1, 2). However, this analysis was limited to one pediatric hospital in Memphis, two adult hospitals in Nashville, and one adult hospital in Chicago, which were able to collect and store sputum specimens from enrolled patients (Table 1). The study protocol was approved by the institutional review board at each institution and at the CDC. Written informed consent was obtained before specimen collection.
The CDC EPIC study details have been previously described (1, 2). Briefly, patients were enrolled if they were admitted to study hospitals with evidence of acute infection and respiratory illness and had
on May 16, 2020 by guest
http://jcm.asm.org/
chest radiography consistent with pneumonia as assessed by the clinical team. For the previously published EPIC study main analysis, radiographic pneumonia was further defined by independent confirmation by a dedicated study radiologist. However, for this analysis, we included all enrolled patients based on the initial inclusion criteria and not on the final determination of radiographic pneumonia, and here this is referred to as ARI; only patients who had both a NP/OP swab and high-quality sputum specimen were included.
Clinical specimen collection and processing. For all patients, combined NP/OP swabs were collected for molecular detection of respiratory viruses and atypical bacteria using singleplex real-time PCR methods (1, 2). Expectorated sputum was requested from adults with a productive cough. Pediatric sputum specimens were only obtained at the Memphis pediatric hospital as part of an exploratory substudy; children with sufficient cough to produce sputum (based on an examination by a respiratory therapist) were asked to expectorate (older children) or have sputum suctioned through the nose or mouth into a sterile container. For those without spontaneous sputum production, induction was undertaken with inhaled hypertonic saline (after albuterol to prevent wheeze); after productively coughing, the child would expectorate or have the sputum suctioned (see the supplemental material). For both adults and children, sputum samples underwent Gram stain and bacterial culture using standard methods. High-quality sputum was defined asⱕ10 epithelial cells/low-power field (lpf) and
ⱖ25 white blood cells/lpf or a q-score definition of 2⫹(29).
After initial testing at each site, NP/OP and sputum specimens were stored at less than or equal to
⫺70°C and shipped to the CDC for long-term storage at⫺80°C. High-quality sputum specimens were processed by combining 300l of specimen with 300l of 1,4-dithiothreitol (DTT) (Fisher Scientific) at a concentration of 12.5 mM and incubated at room temperature until the specimen was emulsified, usually 1 h. Total nucleic acid (TNA) was extracted using the MagNA Pure Compact system with TNA isolation kit I (Roche Applied Science) per the manufacturer’s recommendations. The Total_NA_Plasma_ external_lysis_V3_2 program was used with an input volume of 600 l of the combined DTT and specimen mixture and eluted in 100l. After extraction, 200l of nuclease-free water (Promega) was added to bring the final elution volume to 300l. For NP/OP specimens, the MagNA Pure Compact was programmed using the Total_NA_Plasma_100_400 program with an input volume of 300l and an elution volume of 100l. Both sputum and NP/OP specimen extracts were tested the same day, and the remaining specimen and extract was stored at less than or equal to⫺70°C.
[image:10.585.42.374.84.385.2]TaqMan array card testing.Pediatric specimens were tested for 26 pathogens and adult specimens for 24 pathogens (Table 4) on customized TAC (Fig. 2; see also Fig. S1 in the supplemental material); specific pathogens were slightly different for children and adults based on the published pneumonia etiology literature in each population (30, 31). TAC was run on the ViiA 7 real-time PCR system (Thermo Fisher Scientific) using the AgPath-ID one-step kit (Thermo Fisher Scientific) as previously described (21, TABLE 4Pathogens tested and corresponding codes for figures
Pathogen Code Population tested
Acinetobacter baumannii ABAU Adults
Escherichia coli ECSH Adults
Klebsiella pneumoniae KLPN Adults
Pseudomonas aeruginosa PSAE Adults
Human coronavirus 229E HCV1 Children
Human coronavirus HKU1 HCV4 Children
Human coronavirus NL63 HCV2 Children
Human coronavirus OC43 HCV3 Children
Human parainfluenza virus 4 PIV4 Children
Human parechovirus HPEV Children
Adenovirus, all types ADEV Children and adults
Bordetella pertussis BOP1 Children and adults
Chlamydophila pneumoniae CHPN Children and adults
Haemophilus influenzae, all types HIAT Children and adults
Human enterovirus ENTV Children and adults
Human metapneumovirus HMPV Children and adults
Human parainfluenza virus 1 PIV1 Children and adults
Human parainfluenza virus 2 PIV2 Children and adults
Human parainfluenza virus 3 PIV3 Children and adults
Human rhinovirus RHIV Children and adults
Influenza A FLUA Children and adults
Influenza B FLUB Children and adults
Influenza C FLUC Children and adults
Legionellaspecies LSPP Children and adults
Moraxella catarrhalis MOCA Children and adults
Mycoplasma pneumoniae MYPN Children and adults
Respiratory syncytial virus RESV Children and adults
Staphylococcus aureus STAU Children and adults
Streptococcus pyogenes GAST Children and adults
Streptococcus pneumoniae STPN Children and adults
on May 16, 2020 by guest
http://jcm.asm.org/
32). Briefly, a master mix of 50l of 2⫻reaction buffer and 4l of enzyme mix was prepared, and 46
l of extracted total nucleic acid was added to the master mix for a total volume of 100l. The 100l mixture was dispensed into the loading well of the card and centrifuged twice on a Sorvall Legend T (Thermo Fisher Scientific) at 1,200 rpm to ensure equal loading of the wells. Six specimens, one negative control, and one positive control were included in each run (21, 32). Validation data for TAC versus individual real-time PCR assays were described by Kodani et al. (21).
Data analysis.TAC results were analyzed in the ViiA 7 RUO software version 1.1 and exported into Microsoft Excel 2010 where global analysis was performed. Crossing threshold (CT) values were reported
for each pathogen with an earlier CT value suggesting a higher pathogen load. For each assay,
high-quality sputumCTvalues were subtracted from their matched NP/OPCTvalues to determine the
relative pathogen load of each specimen type. A positive number indicates an earlier CTvalue for
high-quality sputum suggesting a higher load. Bacterial and viral detections in each specimen type were compared between children and adults and between high-quality sputum and NP/OP specimens using chi-square or Fisher’s exact test as appropriate. An increase in diagnostic yield contributed by the sputum was calculated as follows: (positive detections by sputum only)/(positive detections by sputum and NP/OP⫹positive detections by NP/OP only) (33). Percent agreement between sputum and NP/OP results was determined by calculating the total number of times NP/OP and sputum agreed for each target divided by the total number of patients tested. High-quality sputum and NP/OPCTvalues for each
pathogen were compared using a pairedttest. All comparisons were performed in SAS version 9.3 (Cary, NC); aPvalue of⬍0.05 was considered significant.
SUPPLEMENTAL MATERIAL
Supplemental material for this article may be found at https://doi.org/10.1128/ JCM.01805-16.
TEXT S1, PDF file, 0.1 MB.
ACKNOWLEDGMENT
The findings and conclusions in this report are those of the authors and do not necessarily represent the views of the Centers for Disease Control and Prevention.
REFERENCES
1. Jain S, Self WH, Wunderink RG, Fakhran S, Balk R, Bramley AM, Reed C, Grijalva CG, Anderson EJ, Courtney DM, Chappell JD, Qi C, Hart EM, Carroll F, Trabue C, Donnelly HK, Williams DJ, Zhu Y, Arnold SR, Ampofo K, Waterer GW, Levine M, Lindstrom S, Winchell JM, Katz JM, Erdman D, Schneider E, Hicks LA, McCullers JA, Pavia AT, Edwards KM, Finelli L. 2015. Community-acquired pneumonia requiring hospital-ization among U.S. adults. N Engl J Med 373:415– 427. https://doi.org/ 10.1056/NEJMoa1500245.
2. Jain S, Williams DJ, Arnold SR, Ampofo K, Bramley AM, Reed C, Stock-mann C, Anderson EJ, Grijalva CG, Self WH, Zhu Y, Patel A, Hymas W, Chappell JD, Kaufman RA, Kan JH, Dansie D, Lenny N, Hillyard DR, Haynes LM, Levine M, Lindstrom S, Winchell JM, Katz JM, Erdman D, Schneider E, Hicks LA, Wunderink RG, Edwards KM, Pavia AT, McCullers JA, Finelli L. 2015. Community-acquired pneumonia requiring hospital-ization among U.S. children. N Engl J Med 372:835– 845. https://doi.org/ 10.1056/NEJMoa1405870.
3. Liu L, Johnson HL, Cousens S, Perin J, Scott S, Lawn JE, Rudan I, Campbell H, Cibulskis R, Li M, Mathers C, Black RE. 2012. Global, regional, and national causes of child mortality: an updated systematic analysis for 2010 with time trends since 2000. Lancet 379:2151–2161. https:// doi.org/10.1016/S0140-6736(12)60560-1.
4. Branche AR, Walsh EE, Formica MA, Falsey AR. 2014. Detection of respi-ratory viruses in sputum from adults by use of automated multiplex PCR. J Clin Microbiol 52:3590 –3596. https://doi.org/10.1128/JCM.01523-14. 5. Choi SH, Hong SB, Ko GB, Lee Y, Park HJ, Park SY, Moon SM, Cho OH, Park
KH, Chong YP, Kim SH, Huh JW, Sung H, Do KH, Lee SO, Kim MN, Jeong JY, Lim CM, Kim YS, Woo JH, Koh Y. 2012. Viral infection in patients with severe pneumonia requiring intensive care unit admission. Am J Respir Crit Care Med 186:325–332. https://doi.org/10.1164/rccm.201112 -2240OC.
6. Gadsby NJ, Russell CD, McHugh MP, Mark H, Conway Morris A, Lauren-son IF, Hill AT, Templeton KE. 2016. Comprehensive molecular testing for respiratory pathogens in community-acquired pneumonia. Clin Infect Dis 62:817– 823. https://doi.org/10.1093/cid/civ1214.
7. Juven T, Mertsola J, Waris M, Leinonen M, Meurman O, Roivainen M, Eskola J, Saikku P, Ruuskanen O. 2000. Etiology of community-acquired
pneumonia in 254 hospitalized children. Pediatr Infect Dis J 19:293–298. https://doi.org/10.1097/00006454-200004000-00006.
8. Karhu J, Ala-Kokko TI, Vuorinen T, Ohtonen P, Syrjala H. 2014. Lower respiratory tract virus findings in mechanically ventilated patients with severe community-acquired pneumonia. Clin Infect Dis 59:62–70. https://doi.org/10.1093/cid/ciu237.
9. Moore C, Corden S, Sinha J, Jones R. 2008. Dry cotton or flocked respiratory swabs as a simple collection technique for the molecular detection of respiratory viruses using real-time NASBA. J Virol Methods 153:84 – 89. https://doi.org/10.1016/j.jviromet.2008.08.001.
10. Ruuskanen O, Järvinen A. 2014. What is the real role of respiratory viruses in severe community-acquired pneumonia? Clin Infect Dis 59: 71–73. https://doi.org/10.1093/cid/ciu242.
11. Ruuskanen O, Lahti E, Jennings LC, Murdoch DR. 2011. Viral pneumonia. Lancet 377:1264 –1275. https://doi.org/10.1016/S0140-6736(10)61459-6. 12. Johansson N, Kalin M, Tiveljung-Lindell A, Giske CG, Hedlund J. 2010. Etiology of community-acquired pneumonia: increased microbiological yield with new diagnostic methods. Clin Infect Dis 50:202–209. https:// doi.org/10.1086/648678.
13. Wiemken T, Peyrani P, Bryant K, Kelley RR, Summersgill J, Arnold F, Carrico R, McKinney WP, Jonsson C, Carrico K, Ramirez J. 2013. Incidence of respiratory viruses in patients with community-acquired pneumonia admitted to the intensive care unit: results from the Severe Influenza Pneumonia Surveillance (SIPS) project. Eur J Clin Microbiol Infect Dis 32:705–710. https://doi.org/10.1007/s10096-012-1802-8.
14. Memish ZA, Al-Tawfiq JA, Makhdoom HQ, Assiri A, Alhakeem RF, Albar-rak A, Alsubaie S, Al-Rabeeah AA, Hajomar WH, Hussain R, Kheyami AM, Almutairi A, Azhar EI, Drosten C, Watson SJ, Kellam P, Cotten M, Zumla A. 2014. Respiratory tract samples, viral load, and genome fraction yield in patients with Middle East respiratory syndrome. J Infect Dis 210: 1590 –1594. https://doi.org/10.1093/infdis/jiu292.
15. Schneider E, Chommanard C, Rudd J, Whitaker B, Lowe L, Gerber SI. 2015. Evaluation of patients under investigation for MERS-CoV infection, United States, January 2013-October 2014. Emerg Infect Dis 21: 1220 –1223. https://doi.org/10.3201/eid2107.141888.
16. Yeh E, Luo RF, Dyner L, Hong DK, Banaei N, Baron EJ, Pinsky BA. 2010. Preferential lower respiratory tract infection in swine-origin 2009
on May 16, 2020 by guest
http://jcm.asm.org/
A(H1N1) influenza. Clin Infect Dis 50:391–394. https://doi.org/10.1086/ 649875.
17. Arruda E, Pitkaranta A, Witek TJ, Jr, Doyle CA, Hayden FG. 1997. Fre-quency and natural history of rhinovirus infections in adults during autumn. J Clin Microbiol 35:2864 –2868.
18. Makela MJ, Puhakka T, Ruuskanen O, Leinonen M, Saikku P, Kimpimaki M, Blomqvist S, Hyypia T, Arstila P. 1998. Viruses and bacteria in the etiology of the common cold. J Clin Microbiol 36:539 –542.
19. Nokso-Koivisto J, Raty R, Blomqvist S, Kleemola M, Syrjanen R, Pitkaranta A, Kilpi T, Hovi T. 2004. Presence of specific viruses in the middle ear fluids and respiratory secretions of young children with acute otitis media. J Med Virol 72:241–248. https://doi.org/10.1002/jmv.10581. 20. Diaz MH, Waller JL, Napoliello RA, Islam M, Wolff BJ, Burken DJ, Holden
RL, Srinivasan V, Arvay M, McGee L, Oberste MS, Whitney CG, Schrag SJ, Winchell JM, Saha SK. 2013. Optimization of multiple pathogen detec-tion using the TaqMan array card: applicadetec-tion for a populadetec-tion-based study of neonatal infection. PLoS One 8:e66183. https://doi.org/10.1371/ journal.pone.0066183.
21. Kodani M, Yang G, Conklin LM, Travis TC, Whitney CG, Anderson LJ, Schrag SJ, Taylor TH, Jr, Beall BW, Breiman RF, Feikin DR, Njenga MK, Mayer LW, Oberste MS, Tondella MLC, Winchell JM, Lindstrom SL, Erd-man DD, Fields BS. 2011. Application of TaqMan low-density arrays for simultaneous detection of multiple respiratory pathogens. J Clin Micro-biol 49:2175–2182. https://doi.org/10.1128/JCM.02270-10.
22. Jain S, Pavia AT. 2016. Editorial commentary: the modern quest for the “holy grail” of pneumonia etiology. Clin Infect Dis 62:826 – 828. https:// doi.org/10.1093/cid/civ1219.
23. Musher DM. 2016. Editorial commentary: quantitative molecular ap-proach to diagnosing pneumonia. Clin Infect Dis 62:824 – 825. https:// doi.org/10.1093/cid/civ1216.
24. Brumfitt W, Willoughby MLN, Bromley LL. 1957. An evaluation of sputum examination in chronic bronchitis. Lancet 270:1306 –1309. https:// doi.org/10.1016/S0140-6736(57)91637-9.
25. Lees AW, McNaught W. 1959. Bacteriology of lower-respiratory tract secretions, sputum, and upper-respiratory-tract secretions in “normals” and chronic bronchitics. Lancet 274:1112–1115. https://doi.org/10.1016/ S0140-6736(59)90099-6.
26. Cieslak PR, Britt A, Hicks LA, Conklin LM, Van Beneden C, Garrison L,
Winchell JM, Schneider E, Erdman DD, Fry A, Jain S, Uyeki T, Finelli L, Lindstrom SL, Clark TA, Tondella MLC, Shieh W, Zaki SR, Fleming-Dutra KE. 2012. Unexplained Respiratory Disease Outbreak working group activities—worldwide, March 2007-September 2011. Morb Mortal Wkly Rep 61:480 – 483.
27. Tomczyk S, Arriola CS, Beall B, Benitez A, Benoit SR, Berman L, Bresee J, da Gloria Carvalho M, Cohn A, Cross K, Diaz MH, Francois Watkins LK, Gierke R, Hagan JE, Harris A, Jain S, Kim L, Kobayashi M, Lindstrom S, McGee L, McMorrow M, Metcalf BL, Moore MR, Moura I, Nix WA, Nyan-goma E, Oberste MS, Olsen SJ, Pimenta F, Socias C, Thurman K, Waller J, Waterman SH, Westercamp M, Wharton M, Whitney CG, Winchell JM, Wolff B, Kim C. 2016. Multistate outbreak of respiratory infections among unaccompanied children, June-July 2014. Clin Infect Dis 63:48 –56. https://doi.org/10.1093/cid/ciw147.
28. Honkinen M, Lahti E, Osterback R, Ruuskanen O, Waris M. 2012. Viruses and bacteria in sputum samples of children with community acquired pneumonia. Clin Microbiol Infect 18:300 –307. https://doi.org/10.1111/ j.1469-0691.2011.03603.x.
29. Bartlett RC. 1974. Medical microbiology: quality, cost, and clinical rele-vance, p 24 –31. John Wiley & Sons, Hoboken, NJ.
30. Marston BJ, Plouffe JF, File TM, Jr, Hackman BA, Salstrom SJ, Lipman HB, Kolczak MS, Breiman RF. 1997. Incidence of community-acquired pneu-monia requiring hospitalization: results of a population-based active surveillance study in Ohio. Arch Intern Med 157:1709 –1718. https:// doi.org/10.1001/archinte.157.15.1709.
31. Michelow IC, Olsen K, Lozano J, Rollins NK, Duffy LB, Ziegler T, Kauppila J, Leinonen M, McCracken GH. 2004. Epidemiology and clinical charac-teristics of community-acquired pneumonia in hospitalized children. Pediatrics 113:701–707. https://doi.org/10.1542/peds.113.4.701. 32. Kodani M, Winchell JM. 2012. Engineered combined-positive-control
template for real-time reverse transcription-PCR in multiple-pathogen-detection assays. J Clin Microbiol 50:1057–1060. https://doi.org/10.1128/ JCM.05987-11.
33. Hammitt LL, Kazungu S, Welch S, Bett A, Onyango CO, Gunson RN, Scott JA, Nokes DJ. 2011. Added value of an oropharyngeal swab in detection of viruses in children hospitalized with lower respiratory tract infection. J Clin Microbiol 49:2318 –2320. https://doi.org/10.1128/JCM.02605-10.