Parametric Study & Development of Surrogate
Models of Friction Stir Welding Process of Copper
Plate
Vipul Pranami1
1
Assistant Professor of Mechanical Department, K.J. Institute of Engineering and Technology, Savli
Abstract: Friction stir welding is a pretty a new solid-state amalgamation process. This amalgamation method is energy proficient, environment friendly, and handy. In unambiguous, it can be used to yoke high strength aerospace aluminum alloys and other metallic alloys that are hard to weld by orthodox fusion welding. FSW is deliberated to be the most significant growth in metal joining in a era. In latest times, friction stir processing (FSP) was established for microstructural modification of metallic materials. In this research paper, optimization of friction stir welding of copper plate is talked. Exact accent has been given to: (i) mechanisms responsible for the formation of welds and microstructural improvement, and (ii) effects of friction stir welding parameters on resultant microstructure and concluding mechanical properties. The technology diffusion has gloomily overtaken the fundamental accepting of microstructural evolution and microstructure– goods relationships.
Keywords: Friction stir welding, friction stir processing, thermo-mechanical modeling, DataFit, Minitab, regression analysis,
linear and nonlinear, residual stress.
I. INTRODUCTION
In order to conduct parametric study of FSW process, experiment methodology’s design is implemented in this study. Design of experiment (DOE) technique is used to optimize the number of experiments required to determine the effects of various factors affecting the response of the system. It eliminates the need for extensive experimental analysis and reduces the computational time and cost. The described sections depict the details of DOE and development of surrogate models for FSW process.
II. DESIGNOFEXPERIMENTS
Thermal and mechanical models developed in the [1] are used as base models for carrying out parametric studies. The very first step is to identify important independent input factors & response variables. Response variables selected are: (a) Maximum temperature T, (b) residual stress R. Input variables affecting T are: (a) Heat input H, (b) welding speed (S) and variables affecting are: H, S and clamping location (C). Identification of the range and the specific levels at which selected factors have to be varied. Table I lists the process parameters, their range and selected levels used in this study for maximum temperature T and residual stress R.
TABLE I
THE PROCESS PARAMETERS, THEIR RANGE AND DESIGN LEVEL USED
response process
parameters units range level 1 level 2 level 3 level 4 level 5
Temperature (T)
Weld Speed (S) mm/s 0.5-2.54 0.5 0.85 1.00 1.69 2.54
Heat Input (H) watt 500-970 500 600 760 970
Residual stress (R)
Clamping
location (C) mm/s 0.5-2.54 0.5 0.85 1 1.69 2.54
Heat Input (H) watt 500-970 500 600 760 970
Clamping
location (C) mm 50.2-76.2 50.2 76.2
TABLE III
DESIGN MATRIX WITH FACTORS,SELECTED LEVELS AND RECORDED RESPONSE TEMPERATURE (T)FOR PARAMETRIC STUDY
Heat input (watt) H Weld speed (mm/s) S Temperature (°C) T
500 0.50 1117.721
500 0.85 1012.28
500 1.00 967.505
500 1.69 795.271
500 2.54 643.857
600 0.50 1313.42
600 0.85 1188.72
600 1.00 1135.30
600 1.69 928.272
600 2.54 753.712
760 0.50 1455
760 0.85 1424.85
760 1.00 1407.68
760 1.69 1146.799
760 2.54 903.794
970 0.50 160
970 0.85 1480
970 1.00 1490
970 1.69 1396.29
970 2.54 1155.04
III.SURROGATEMODELSOFFRICTIONSTIRWELDING
A surrogate models can be used for optimization studies. It can be used to model the design objectives or to model the constraints. They are constructed to establish the relationship between the output responses and process parameters. For any given set of data linear or nonlinear regression, neural networks, response surface approximations, support vector regression, etc. can be used to model a surrogate model. In this study we have used Linear and nonlinear regression methods are used to construct surrogate models. At last their performance was analyzed and evaluated.
IV.DEVELOPMENTOFMODELFORRESPONSE–TEMPERATURET
To establish relationship between the selected input process parameters and the thermal response variable the multiple regression analysis was used. As stated above heat input (H) and welding speed (S) are the selected input process parameters for the response temperature (T). The simulated data obtained in table B.1 in appendix B, is used for setting up surrogate models. To compute the regression constants for multi-linear regression model, Minitab 17, data analysis statistical software was used. Temperature’s fitted linear regression model is given by equation (1).
T = 741.2 + 1.0329 × H - 238.0 × S ………. (1) Table III includes the results of multiple linear regression analysis.
TABLE IIIII
REGRESSION MODEL FOR RESPONSE TEMPERATURE USING MINITAB 17
Predictor Coefficient Standard Error t-ratio Prob (t)
Constant 741.2 67.8 10.93 0.00
Heat Input 1.0329 0.0850 12.15 0.00
Weld Speed -238 20.9 -11.41 0.00
T = -3408.6 + 747.34 × ln (H) - 238.0 × S ………. (2) Table IV includes the complete nonlinear regression analysis using model definition Y = a + b * ln (x1) + c * x2
TABLE IVV
REGRESSION MODEL FOR RESPONSE TEMPERATURE USING DATAFIT 9.0
Variable Value Standard Error t-ratio Prob(t)
a -3408.568455 342.150087 -9.962202 0.0
b 747.3398705 52.2288802 14.308939 0.0
c -238.0038116 17.9793487 -13.237621 0.0
V. DEVELOPMENTOFMODELFORRESPONSE–RESIDUALSTRESSR
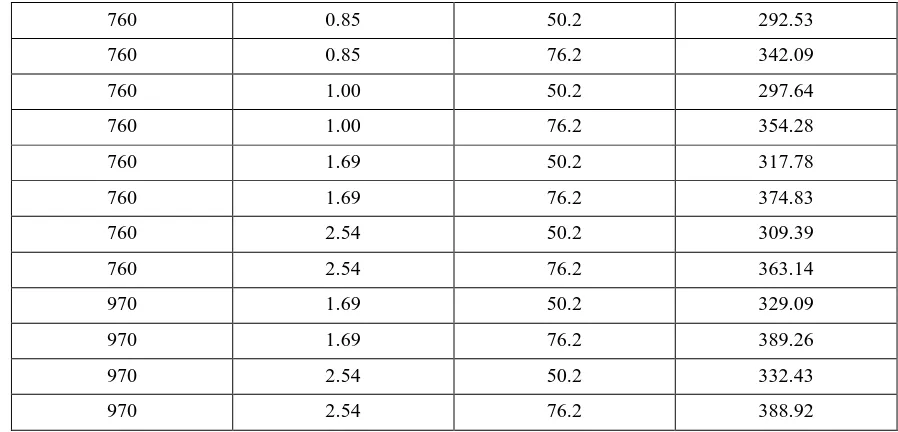
To set relationship between the selected input process parameters and the thermomechanical response variable R, multiple regression analysis was used. Input process parameters for the response residual stress (R) are welding speed (S), heat input (H) and clamping location (C). The simulated data summarized in Table V was used to set surrogate models for residual stress R. The regression constants for multi-linear regression model were calculated using Minitab 17. The fitted linear regression model for residual stress is given by equation (3).
R = 110.8 + 0.1182 × H + 4.97 × S + 1.956 × C ………. (3)
TABLE V
DESIGN MATRIX WITH FACTORS, SELECTED LEVELS AND RECORDED RESPONSE RESIDUAL STRESS (R) FOR PARAMETRIC STUDY
eat input (watt) H Weld speed (mm/s) S Clamping location (mm)
C Residual Stress (MPa) R
500 0.50 50.2 267.36
500 0.50 76.2 293.34
500 0.85 50.2 282.85
500 0.85 76.2 329.84
500 1.00 50.2 288.48
500 1.00 76.2 341.73
500 1.69 50.2 277.23
500 1.69 76.2 332.59
500 2.54 50.2 266.07
500 2.54 76.2 326.83
600 0.50 50.2 282.93
600 0.50 76.2 305.37
600 0.85 50.2 286.44
600 0.85 76.2 332.33
600 1.00 50.2 293.76
600 1.00 76.2 346.61
600 1.69 50.2 300.69
600 1.69 76.2 355.41
600 2.54 50.2 277.70
760 0.85 50.2 292.53
760 0.85 76.2 342.09
760 1.00 50.2 297.64
760 1.00 76.2 354.28
760 1.69 50.2 317.78
760 1.69 76.2 374.83
760 2.54 50.2 309.39
760 2.54 76.2 363.14
970 1.69 50.2 329.09
970 1.69 76.2 389.26
970 2.54 50.2 332.43
[image:5.612.79.528.76.292.2]970 2.54 76.2 388.92
Table VI includes the results of multiple linear regression.
TABLE VI
REGRESSION VARIABLE RESULTS
Predictor Coefficient Standard Error t-ratio Prob (t)
Constant 110.8 14.5 7.65 0.000
Heat Input 0.1182 0.0152 7.78 0.000
Weld Speed 4.97 3.21 1.55 0.132
Clamping Location 1.956 0.169 11.54 0.000
In addition to that table V’s simulated data was used to setup a, nonlinear regression. DataFit version 9.0 was used to carry out the nonlinear regression analysis. The fitted nonlinear regression model for residual stress obtained from DataFit is given by equation (4).R = exp (3.60 × H + 1.64 × S + 6.15 × C + 5.11) ………. (4)
TABLE VII
REGRESSION VARIABLE RESULTS
Variable Value Standard Error t-ratio Prob(t)
a 3.5942 E-4 4.4813 E-5 8.02064 0.0
b 1.6423 E-2 9.88634 E-3 1.66118
c -6.154407 E-3 5.25229 E-4 11.71756
d 5.111902 4.51192 E-2 113.29757
VI.ESTIMATINGTHEPERFORMANCEOFDEVELOPEDSURROGATEMODELS
To estimate the temperature of the workpiece at the selected location, linear and one nonlinear model were fitted and to estimate the residual stress at the selected location another linear and one nonlinear model were fitted additionally. The surrogate models were judged based on the following statistics:
1) The coefficient of determination R2
R2 is a statistical measure which indicates how well a regression model describes the given data set. A model with higher values of R2 is selected as it indicates a better fit using this criterion.
2) The residual sum of squares RSS
3) It is used to compare the relative goodness-of-fit of the predicted models. It is parameter independent AIC is estimated by the following equation (5):
AIC = 2k + n × ln 2π (RSS) / n + 1 ………. (5)
where n is the number of observations, and k is the number of parameters in the model.
The model with the highest AIC is selected as the best fit model from the models ranked based on their AIC. 4) The adjusted coefficient of determination R2adj
The adjusted coefficient of determination is used as a measure to find the optimal regression model. It is also a parameter independent and a higher value of R2ad indicates better fit.
The perfectness of the surrogate models was determined by the values of R2, RSS, AIC and R2adj. The regression statistics of linear and nonlinear surrogate models developed for estimating temperature and residual stress is shown in table 4.2. The values of R2 and R2ad are higher for surrogate models of temperature whereas the values of AIC and RSS are higher and lower respectively for nonlinear model which can be seen in table VIII. This indicates that the nonlinear model given by equation (2) fits the data better than the linear model given by equation (1).
TABLE VIII
REGRESSION STATISTICS OF LINEAR AND NONLINEAR SURROGATE MODELS
Response Variable
Regression Model
Equation
No. k R
2
RSS AIC R2adj
Temperature
Linear (1) 3 0.9423 77607 187.19 0.9355
Nonlinear (2) 3 0.9571 57611.69 222.07 0.9521
Residual Stress
Linear (3) 4 0.8837 4347.01 112.76 0.8713
Nonlinear (4) 4 0.8879 4188.05 254.78 0.8759
A similar trend was observed for the surrogate models of residual stress. The nonlinear regression model had higher R2 adj and R2 values and higher AIC and lower RSS values compared to the linear model, indicating nonlinear linear model given by equation (4) has better fit than linear model given by equation (3). Hence nonlinear regression models were the best models for estimating the responses, work piece temperature and residual stress.
VII. CONCLUSION
From above analysis we can conclude that the nonlinear regression models are the best for estimating and calculating the responses like temperature of work piece and residual stress developed.
In future Improved Harmony Search Algorithm can be used to optimize the friction stir welding of copper plates.
REFERENCES
[1] Vipul Pranami, Thermo-Mechanical Modeling of Friction Stir Welding of Copper Plate. International Journal for Research in Applied Science & Engineering Technology, 2017. Vol.5, Issue IX p. 753-758
[2] Mohamadreza Nourani, Abbas S. Milani, Spiro Yannacopoulos, Taguchi Optimization of Process Parameters in Friction Stir Welding of 6061 Aluminum Alloy: A Review and Case Study.Engineering, 2011. 3:p. 144-155.
[3] C.M. Chen, R. Kovacevic, Finite element modeling of friction stir welding—thermal and thermomechanical analysis. International Journal of Machine Tools & Manufacture, 2003. 43: p. 1319–1326.
[4] Soundararajan, V., Zekovic, S., and Kovacevic, R., Thermo-mechanical model with adaptive boundary conditions for friction stir welding of Al 6061. International Journal of Machine Tools & Manufacture, 2005. 45(14): p. 1577-1587.
[5] Y.M.Chwang, P.L.Fan, C.H.Lin, Experimental study on Friction Stir Welding of copper metals. Journals of Materials Processing Technology, 2010. 210:p.1667-1672.
[6] X.K.Zhu, Y.J.Chao, Numerical simulation of transient temperature and residual stresses in friction stir welding of 304L stainless steel. Journals of Materials Processing Technology, 2004. 146:p.263-272.
[8] Song, M. and Kovacevic, R., Thermal modeling of friction stir welding in a moving coordinate system and its validation. International Journal of Machine tools & Manufacture, 2002. 43: p. 605-615.
[9] Jawdat A. Al-Jarrah, Sallameh Swalha, Talal Abu Mansour, Masoud Ibrahim, Maen Al-Rashdan, Deya A. Al- Qahsi, Optimization of Friction Stir Welding Parameters for Joining Aluminum Alloys Using RSM.Adv. Theor. Appl. Mech., 2013. Vol. 6, no. 1:p. 13 -26