Cervical Cancer Prediction using Data Mining
Dipti N. Punjani1, Dr. Kishor H. Atkotiya2
1
Assistant Professor, National Computer College, Jamnagar, 2
Professor, Department of Statistics, Saurashtra University, Rajkot
Abstract: Data mining is a set of techniques which could be used to derive hidden patterns from the data. The purpose of data mining is to find some information which is not directly visible or retrievable by reading data or executing simple queries to the data. One of the key features of using data mining techniques is to predict future based on the data of past and present. Predictions are widely required to be done for betterment of future. An accurate and timely prediction could avoid any future issue at a certain level. Healthcare is a field where it is required to diagnosis various critical diseases like cancers before they become life threatening. This paper explains how data mining techniques could be useful for healthcare purpose specially to predict possibility of a patient suffering from cervical cancer. The main goal here is to design a database which can be used in future for data mining purpose.
Keywords: Data Mining, Predictions, Classification, Association Rule Mining, Cervical Cancer.
I. INTRODUCTION
Data mining is required everywhere. From a small scale firm to a large scale business, from a school to a university, form an office to a government sector. Data mining refers to a set of techniques which could be used to mine data. Here mining refers to dig out some hidden truths, rules, relationships, patterns from the data which are not directly visible. For example, for any relational database, we can retrieve data in specific way. Such retrieval is based on applying filtering of rows and columns. At another level, we can combine data from multiple tables or can execute scalar functions to calculate some values like sum, average, maximum, minimum etc. Applying a scalar function over a data gives us a little information but here in case of data mining the concept of information retrieval is in depth. Here the meaning of retrieving information refers to find some values which cannot be derived using traditional query languages of database systems [1,2,3].
A. Data Mining Steps
Data mining techniques can be broadly classified into classification, regression, association rule mining and clustering. Figure 1 shows the process of data mining. Initially actual data is selected on which we want to perform data mining process. Out of the actual data, we have to select a part of it for further processing. This selected data is the subset of data which is more suitable as per our interest. This selected data is called target data. Pre-processing step is required to make target data suitable for data mining purpose. In this process, any unsuitable, unrealistic and erroneous record is dropped so that data mining techniques can provide accurate result. Sometimes some part of target data needs to be converted from one form to another form for better representation, understanding and compatibility with a data mining technique. In another case, when data is collected from multiple sources, all such instances need to be converted into a single type of structure.
Data transformation refers to this process where some of the required portion of data is converted from one form to another form without losing base values. The transformed data can be directly input to the data mining technique for analysis purpose. Data mining technique analyze the target data and outputs a set of patterns.
Figure – 1 Data Mining
B. Purpose of Data Mining
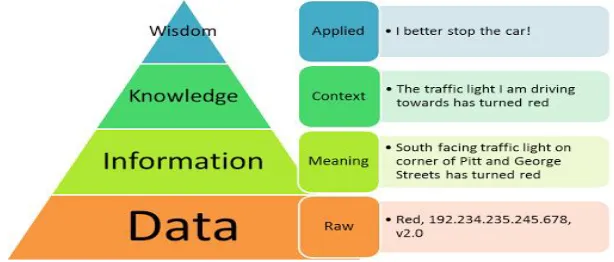
One obvious question comes in our mind when thinking about data mining usage. It is discussed that the purpose of applying these techniques is to derive hidden patterns from the data. In this sub section, the purpose is discussed in a systematic way with an example. The DIKW pyramid represents four levels which are shown in Figure 2. It is a process of three steps deriving information from data, knowledge from information and wisdom from knowledge. Data mining belongs to the 1st step which is transformation of data into information [1,2,3].
Figure – 2 DIKW Pyramid
II. DATA MINING TECHNIQUES
Data mining techniques have many applications for implementation with real life situations. The main four categories of data mining techniques are discussed here. Correspondingly examples are given in reference of their applicability with health science.
A. Classification
[image:3.612.149.456.364.495.2]1) Example: Hospitals often keep records of patients in the form of their personal information, medical tests, surgical history and detail of family. Data of patients suffering from a specific disease let’s say cervical cancer can be gathered and a classifier model can be build. This model can be design to classify patients at three levels based on risk. Low, Moderate, High. Later on detail of any patient (whose cervical cancer status is not known) can be fed to this classifier to predict her risk of having it. Any female (whether she has been a recent patient or not) can get to know her cervical cancer possibility by finding her risk level by providing her data [4,5].
B. Regression
Regression is similar to the classification but it predicts values in numerical form. They can be considered as more precise form of prediction but should be used careful. Most of the time regression is used to predict those values which are more likely to show a growth either in a positive way or in a negative way. Various regression algorithms are (linear, step wise etc.) working based on finding relationships between numerical and no numerical values. Both classification and regression have their own type of applications. Using them interchangeably should be avoided [1,2,3].
2) Example: Smoking is one of the reasons of cervical cancer growth. A researcher may try to plot relationship with the rate a patient smokes and the rate at which its cervical cancer is growing. Regression analysis may help in predicting amount of infection, values of haemoglobin, sugar, heart rate etc. As regression provides numerical predictions, these help in taking decisions more precisely [4,5].
C. Clustering
What if there is no concrete data is available to analyze? In this case, it is not possible to classify new data accurately as a classifier cannot be build without having accurate training data. Clustering is a process of exploring new data, finding similarity and differences among them and groups them into a set of zones called clusters. Every cluster has a set of objects whose properties are comparatively similar to those which are in rest of the clusters. Clustering algorithms are extremely useful especially when the training data is not available [1,2,3].
Example: A group of patients can be divided into set of clusters based on their test results, habits, life style etc. Further to this, every cluster can be treated differently. For example, a group of patients whose test results are not critical but they are more involved in smoking, drinking and other such habits can be motivated to avoid such things. A group of patients who are using contraceptives since many years can be motivated to use other birth control facilities [4,5].
D. Association Rule Mining
It is always desirable to get information in the form if i someone does so, he will get this. Such rules are association rules. To derive such rules, 1st step is to find out frequent item sets. A frequent item set refers to a set of items which are seen to be available always together. Later on association rule mining can be done to find out the relationships among a set of items belonging to a same set of frequent item set. The process of association rule mining is to find out presence of which object(s) in a frequent item set, leads to the presence of other object(s) belonging to the same frequent item set [1,2,3].
3) Example: Majority of the patients are not medically qualified to understand medico terms. They need to be explained if they will continue to do so, they will get such results. At the same time, doctors can use such rules to predict possibility of presence of some issues. For example, if a patient is affected (Based on test results) with viruses A and B and if C is also a part of the same frequent set (A,B,C) and if an association rule is (A,B) (C), a doctor can suggest to go for test of virus C also. In case of cervical cancer, association rules can be derived like if a patient smokes since years uses contraceptives since years then she might be at risk. For such cases, prior to any symptoms, a patient should be tested as a proactive effort [4,5].
III. CERVICALCANCER
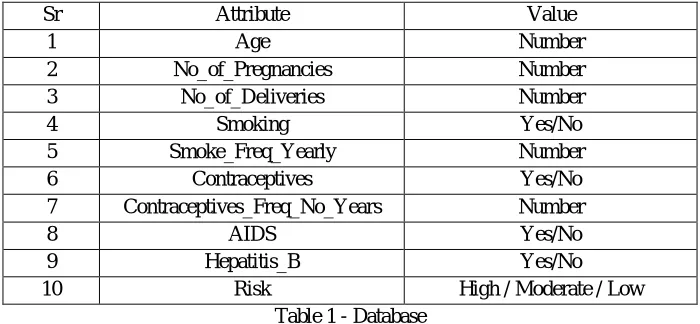
is to refer past samples of any reputed hospital [6]. This research work is based on finding a relationship among some symptoms, habits and previous medical history to identify a patient at low, moderate or high risk of cervical cancer. In this work, the data is not included to having any results specific to the tests of cervical cancer. The reason is that the simplified way of analysis help majority of females to take part in. At the same time, females with high risk are expected to visit a doctor and to do cervical cancer tests while females with low risks are expected to change their daily habits and life style to avoid cervical cancer. Here only those attributes are used whose answers are directly known to a female or could be get easily with her previous medical history (No special tests screening, samples are required to go check risk of cervical cancer). Various attributes which identified are listed in Table 1.
Sr Attribute Value
1 Age Number
2 No_of_Pregnancies Number
3 No_of_Deliveries Number
4 Smoking Yes/No
5 Smoke_Freq_Yearly Number
6 Contraceptives Yes/No
7 Contraceptives_Freq_No_Years Number
8 AIDS Yes/No
9 Hepatitis_B Yes/No
[image:5.612.131.481.182.344.2]10 Risk High / Moderate / Low
Table 1 - Database
Attributes 1 to 9 are the predictors – whose values need to be given by patients and attribute 10 is the class attribute which represents, whether a patient should visit a hospital to do cervical cancer checking or not. The purpose of using very simple attributes is to make it friendly (easy to use and easy to provide information by female). One another reason is that most of the female may feel shy in discussing or visiting doctors for the discussion related with cervical cancer. This simple test may help female to get idea about her risk status so that she can take necessary actions. The database provided by Hospital Universitario de Caracas is used for realistic classifier building. The database is further simplified to make it friendly as discussed earlier.
IV. CLASSIFICATION
Decision Tree method is used to do classification of patients. Data of 50 females is used for training and testing purpose.
A. Decision Tree
Decision tree is a classification method in which rules are generated in If...Then conditions. These rules are organized into a tree representation called a decision tree. A decision tree has a root node representing the most happening condition and which provides a direction to further checking. A decision tree has a set of nodes divided into two parts: Interior nodes and exterior nodes. Interior nodes are the nodes which represent conditions and exterior nodes are the nodes which represent classified labels. Interior nodes are non leaf nodes while exterior nodes are leaf nodes. One advantage of using decision tree method is its simplicity and easy to understand. The classifier build using this method can be implemented in any programming language by implementing conditional statements [7,8]. We have used R as an implementation environment. A set of data of 50 females is provided to R’s decision tree algorithm to build a classifier [9].
B. Results
Classification results are shown in Table 2. 50 records have 20 records with High risk, 20 records with Moderate risk while 10 records with Low risk.
Actual
High Moderate Low
Predictions
High 12 0 1
Moderate 8 20 9
Low 0 0 0
It can be seen from Table 2 that out of 20 High risk records, our classifier is able to classify 12 records correctly. Rest of the 8 records are classified to Moderate risk. Out of 20 Moderate risk records, all records are classified correctly. Out of 10 Low risk records, 1 record is classified as High risk and rest 9 as Moderate risk without any classification at Low risk level. The obvious reason is that we have not included any test history specific to cervical cancer (initial tests). The database is composed of only habits, life style and medical history.
V. CONCLUSION
This work shows importance of data mining techniques in real life applications. Data mining role in deriving wisdom is explained. Various categories of data mining techniques and how they can be used in health care are explained along with examples. As a critical issue of cervical cancer, a simple database made of females habits, life style and medical history is prepared. Later on a decision tree based classifier is designed and tested. It has been found that just like any major cancer inhibits unpredictability, cervical cancer is no exception too. Even then our classifier can predict with utmost accuracy with its simple database which could be used by any female without visiting a doctor even.
VI. FUTUREWORK
Further research work can be carried out towards including more attributes for betterment of results. More focus should be given towards simple yet effective attribute association based on simple medical tests. So that accuracy can be improved. Multiple classification algorithms can be used to find best classification method. As this problem is related with medical conditions and as cervical cancer is more towards a personal female problem, data authenticity is always an issue. Focus should be given to find out data which is accurate and reliable.
REFERENCES
[1] Han, Jiawei, Jian Pei, and Micheline Kamber. Data mining: concepts and techniques. Elsevier, 2011.
[2] Aggarwal, Charu C. Data mining: the textbook. Springer, 2016.
[3] Jiawei Han, Data Mining: Concepts and Techniques, Morgan Kaufmann Publishers, 2001
[4] Canlas Jr RD. Data Mining in Healthcare : Current Applications and Issues. Unpubl Master Thesis. 2009;(August):1-10.
[5] Kaur H, Wasan SK. Empirical Study on Applications of Data Mining Techniques in Healthcare. J Comput Sci. 2006;2(2):194-200. doi:10.3844/jcssp.2006.194.200.
[6] Ho SH, Jee SH, Lee JE, Park JS. Analysis on risk factors for cervical cancer using induction technique. Expert Syst Appl. 2004;27(1):97-105. doi:10.1016/j.eswa.2003.12.005.
[7] Venkatadri.M and Lokanatha C. Reddy ,“A comparative study on decision tree classification algorithm in data mining” , International Journal Of Computer Applications In Engineering ,Technology And Sciences (IJCAETS), Vol.- 2 ,no.- 2 , pp. 24- 29 , Sept 2010.
[8] Safavian, S. Rasoul, and David Landgrebe. "A survey of decision tree classifier methodology." IEEE transactions on systems, man, and cybernetics21.3 (1991): 660-674.