Effect of Multilayer Hardfacing on Metallurgical
and Wear Behaviour of Mild Steel using SMAW
Process
Ishu Kumar1, S. C. Verma2
1, 2
Department of Mechanical Engineering, SLIET, Longowal, Punjab, India
Abstract: Hardfacing is a part of surfacing technique that is a process of depositing a layer or layers of some special alloy material on the substrate that are subjected to wear severe loading conditions. A study was made to investigate the effect of multilayer hardfacing on metallurgical and wear behaviour of hardfacing alloys reinforced with complex carbides. The hardfacing alloys were deposited onto ASTM A36 carbon steel plates with three different layers and each layer contained different number of passes. The adhesive wear tests were carried out in a pin on disc wear machine according to the procedure of ASTM G99 standards. Microstructure and microhardness analysis were made using optical electron microscopy and spectral analysis were also made using optical emission spectrometer. The result showed that wear resistance and hardness is determined by the shape, size and chemical composition of the carbides as well as matrix microstructure of martensite and retained austenite. The wear resistance, hardness and composition of carbides were more in third layer but not significantly higher than second layer and second layer has significant increase than first layer of hardfacing.
Keywords: Multilayer hardfacing, SMAW, ASTM A36, pin on disc, metal to metal wear.
I. INTRODUCTION
II. EXPERIMENTAL PROCEDURE A. Materials and Welded Specimens
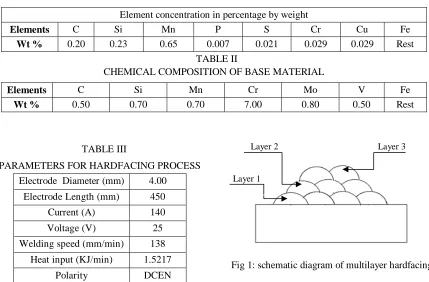
Three 200 × 100 × 30 mm ASTM A36 low carbon steel plates were used as base material or substrate. A commercial hardfacing electrode was applied onto these plates according to manufacturer’s directions. The nominal chemical composition of ASTM A36 can be seen in Table 1 and Table 2 shows the chemical composition of hardfacing electrode. On each plate, different number of layers with different number of passes was deposited and designated as different samples. Samples were designated as per number of layers. Sample A designated for 1 layer deposition having 4 passes, Sample B for 2 layers deposition having 3 passes in second layer, Sample C for 3 layers deposition having 2 passes and Sample BM for base metal having no layer of hardfacing. Adjacent passes were overlapped by 25-30% in each layer. A schematic diagram of multipass multilayer hardfacing has been shown in Fig. 1.
deposition was carried out in flat position, the current and travel speeds were fixed in all tests and no buffer layers were used. The hardfacing parameters for deposition are shown in Table 3. The interpass temperature was kept as room temperature which can be achieved by cooling the specimens after deposition of each layer for 4 hours at room temperature.
TABLE I
CHEMICAL COMPOSITION OF BASE MATERIAL
Element concentration in percentage by weight
Elements C Si Mn P S Cr Cu Fe
Wt % 0.20 0.23 0.65 0.007 0.021 0.029 0.029 Rest
TABLE II
CHEMICAL COMPOSITION OF BASE MATERIAL
Elements C Si Mn Cr Mo V Fe
Wt % 0.50 0.70 0.70 7.00 0.80 0.50 Rest
TABLE III
PARAMETERS FOR HARDFACING PROCESS
Electrode Diameter (mm) 4.00
Electrode Length (mm) 450
Current (A) 140
Voltage (V) 25
Welding speed (mm/min) 138
Heat input (KJ/min) 1.5217
[image:3.612.92.521.274.556.2]Polarity DCEN
Fig 1: schematic diagram of multilayer hardfacing
B. Microhardness Measurements
The microhardness of the hardfacing deposits were measured by a micro-hardness tester which allowed measuring the hardness of the phases in the microstructure by using a Vickers intender with a load capacity of 2kg. In order to analyze the above mentioned properties of the weld hardfacing deposits, microhardness testing was conducted along and across the weld hardfacing cross-sections. Hardness of substrate, heat affected zone, and hardfaced area with different layers were summarized. For the assessment of microhardness, the measurements were taken as five readings in different zones along and across the weld cross sections of each sample. A load of 500g and a dwell time of 20 seconds were used for testing and the results thus obtained have been discussed later. Hardness test was done at welding metallurgy lab, mechanical department, SLIET, Longowal.
C. Macrostructural and Dilution Analysis
For macrostructural studies, the specimens used for microhardness testing were used. The surfaces were lapped on a velvet cloth with the aluminium powder paste followed by grinding up to 2000 grit size emery paper, so as to remove any scratches from the surfaces
Layer 2 Layer 3
the specimens. The surfaces were then subjected to etching by Nital 5%. Macrostructure of weld bead viewed at 10X under the stereo-zoom microscope were captured using the CCD camera coupled with microscope. Weld beads were then examined for their bead geometry characteristics comprising namely weld width, depth of penetration, height of reinforcement, area of penetration, area of reinforcement and dilution percentage Dilution basically depends upon the amount of heat input and chemical composition of electrode and base material. The data observed from macrostructural analysis was further used to evaluate the dilution percentage. Arithmetical method to calculate dilution percentage has given below:
Dilution percentage = / ( + ) × 100
D. Microstructural Studies
The aim of this study was to investigate the metallurgical influence on the wear of hardfaced layers. Microstructural observations have been taken by optical electron microscope at welding metallurgy lab, mechanical department, SLIET, Longowal, Punjab. Prior to observations, the samples were polished with diamond paste followed by grinding with emery paper up to 3000 grit size and etched with 5% Nital for 10 seconds. Thereafter samples were observed under high magnification microscope to record images of microstructures. Photo-micrographs of different zones of hardfaced layers were viewed under an inverted type metallurgical microscope coupled with a CCD camera at 100X magnifications and were captured using image analysis software. Different types of carbides present in the microstructures were first identified on the basis of their morphologies and confirmed by microhardness measurements.
E. Wear Testing
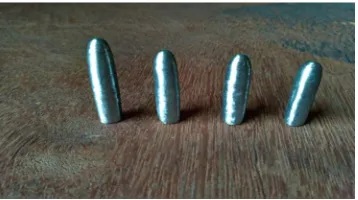
[image:4.612.333.512.459.559.2]The wear test for all samples was done on pin on disk apparatus. For calculating the wear rate, the samples were weighed before and after the wearing of a pin on the rotating disc and the difference between the initial and final weight were calculated. The weighing was done on a machine with a least count of 0.0001gm. The sample was mounted perpendicularly on a stationary vice such that its one of the face is forced to press against the revolving disc. The revolving disc must be harder than the pin samples which results to wear the surface of samples. A standard specimen of cylindrical shape having dimension (Length-30mm, Diameter-8mm) was extracted from hardfaced plates and base metal also for metal-metal wear test (pin on disc) as shown in Fig 2. The test was performed on wear and friction monitor TR-201 machine at welding metallurgy lab, mechanical department, SLIET, Longowal. Parameters for pin on disc wear test have been selected as per manual guide of the machine and literature survey. Parameters considered during the test have been given in Table 4.
TABLE IV
PARAMETERS FOR WEAR TEST
Applied load 30N
Speed 500 rpm
Disk diameter 100 mm
Track diameter 60 mm
Test time 10 minutes
Sliding velocity 1.57 m/s
Sliding distance 942 meters
Fig 2: wear test pins extracted from hardfaced plate
Hence wear loss, wear rate, and wear resistance have been calculated as Weight loss = Initial weight – final weight (gm)
Wear rate = weight loss/test time (gm/hr) Wear resistance = 1/wear rate.
F. Spectral Analysis
[image:4.612.89.312.466.601.2]measure the effect of dilution upon wear resistance and hardness. Each hardfaced sample was examined to its top layer and comparing with the base metal, helps to conclude the change the behaviour in wear, microstructure, microhardness and dilution.
III. RESULTS AND DISCUSSION
A. MicroHardness
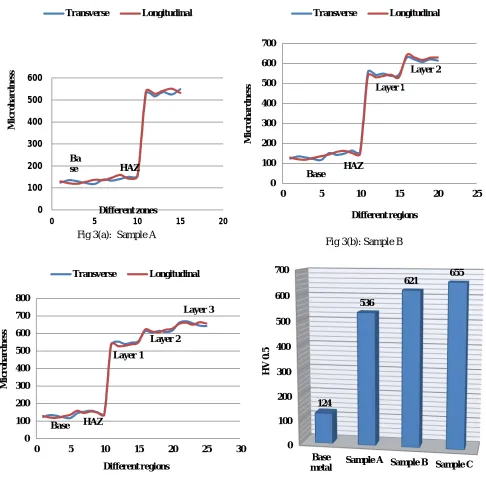
The course of the hardness of multilayer hardfacing by Iron based hardfacing electrode showed a strong effect of mixing the weld and base metal. The hardness of the cladding in its first layer in the area of melting rises sharply to an average value of 536 HV0.5. The second layer reaches an average value of 621 HV0.5, while in three layer hardfacing the hardness reaches around 655 HV0.5. . For all samples the course of hardness curves are formed by observations taken along and across the weld cross section has been shown in Fig 3(a, b, c, d).
Fig 3(a): Sample A
Fig 3(b): Sample B
Fig 3(c): Sample C Fig 3(d): Comparison of different samples
0 100 200 300 400 500 600
0 5 10 15 20
M ic ro h ar d n es s Different zones Transverse Longitudinal Ba se HAZ 0 100 200 300 400 500 600 700
0 5 10 15 20 25
M ic ro h ar d n es s Different regions Transverse Longitudinal HAZ
Layer 1
Layer 2 Base 0 100 200 300 400 500 600 700 800
0 5 10 15 20 25 30
M ic ro h ar d n es s Different regions Transverse Longitudinal HAZ Layer 2 Layer 3 Base 0 100 200 300 400 500 600 700 Base
metal Sample A Sample B Sample C
124
536
621 655
H
V
0.
5
[image:5.612.44.530.221.702.2]B. Microstructure
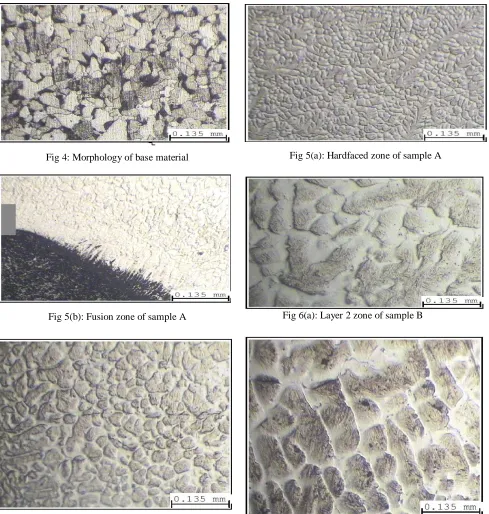
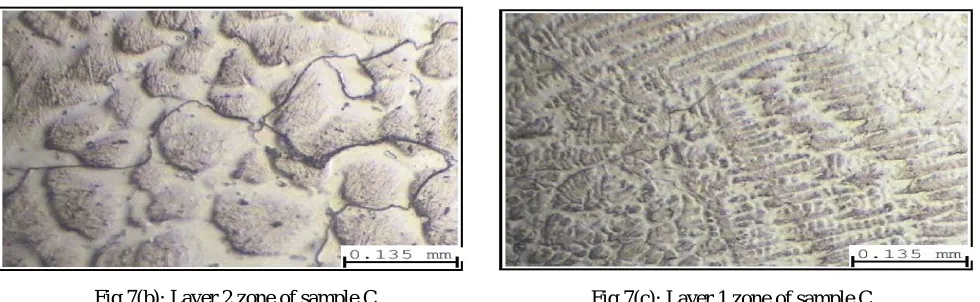
The microstructure of Fig 4 presented the morphology of base as pearlitic phase embedded in matrix of ferrite. The ferrite-pearlitic microstructure with elongated ferrite grains indicates that the base material steel is in hot worked conditions. The photomicrographs of sample A, single layer hardfacing deposit comprising of the weld metal alone is shown in Fig 5(a) and the fusion zone is shown in Fig 5(b). Observation shows epitaxial growth in the weldment. The formation of inter-metallic carbides dispersed in dendrite matrix is observed near to the fusion boundary as well as in the weldment. Although, carbon and chromium progress in hardfacing and may produce chromium carbide, however, hardness achieved may be attributed to the presence of chromium which probably leads to formation of chromium carbides which accounts for its high hardness.
Fig 4: Morphology of base material Fig 5(a): Hardfaced zone of sample A
Fig 5(b): Fusion zone of sample A Fig 6(a): Layer 2 zone of sample B
Fig 6(b): Layer 1 zone of sample B
[image:6.612.63.552.188.702.2]Fig 7(b): Layer 2 zone of sample C Fig 7(c): Layer 1 zone of sample C
All the hardfaced layer of sample B and sample C did not show significant variation in chemical composition that’s why there were not many variations in hardness. All these samples showed a microstructure composed of martensite and retained austenite, with a pattern of dendrites segregation which became more refined at low heat input. In addition, given the increased alloy content detected in the interdendritic area, there was a local decrease in the austenite to martensite transformation start temperature, so that retained austenite was present in that area. During the welding bead cooling process the precipitation of small carbides of alloying elements was produced. On other hand, as the deposits was multilayer the microstructure was tempered by subsequent passes, producing further precipitation of these carbides, which darken martensite.
C. Macrostructural and Dilution Analysis
The results obtained from this analysis were used for the calculation of the percentage of the base metal dilution. The macrostructural results and calculated dilution has been discussed in Table 5. Dilution% was less in three layer hardfacing but not too significant from others. The dilution basically depends upon heat input given. Also due to to multipass multilayer hardfacing carried out with 25-30% overlapping of subsequent pass, The effect of mixing of second and third layer with base metal is very low.
TABLE V
RESULT OF MACROSTRUCTURAL AND DILUTION TEST
Samples Width
of weld (w)
Reinforcement (r)
Penetration (p)
Area of reinforcement,
Area of penetration,
Dilution (%)
A 32.28 4.18 2.66 105.33 31.87 23.22
B 26.10 8.96 2.48 102.67 27.60 21.19
C 18.24 13.76 2.23 98.28 25.40 20.53
D. Wear Analysis
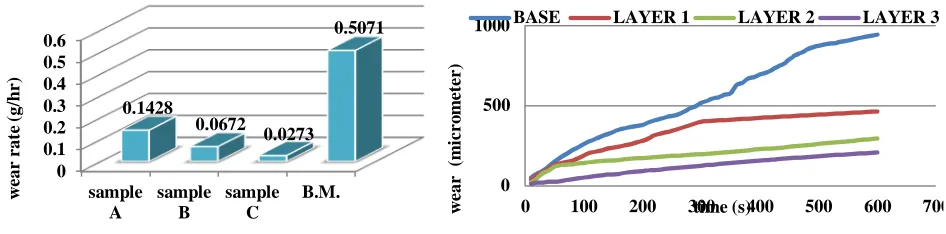
Wear rate was calculated by measuring initial and final weights of samples. Loss in weight was calculated for the running wear period of 10 minutes. Then the wear rate was calculated per hour i.e. for 60 minutes from the loss of weight for 10 minutes. Loss in weight and wear rate is shown in the table. Comparison of wear rate of different work samples as shown in the Fig 9.
1) Calculation of Wear Rate of Sample A:
[image:7.612.63.553.83.234.2]For 60 minutes sample will lose weight = 0.1428 (g/hr).
Similarly wear rate for all samples can be calculated by applying above defined formula. Wear rate for all samples has been illustrated in Table 6.
TABLE VI WEAR TEST RESULT
Samples Initial wt.
(g)
Final wt. (g) Weight loss (g) Wear rate (g/hr)
A 12.0461 12.0233 0.0238 0.1428
B 12.9698 12.9586 0.0112 0.0672
C 15.3892 15.3847 0.0045 0.0273
BM 11.1078 11.0233 0.0845 0.5071
[image:8.612.76.549.318.435.2]Table 6 represented the amount of mass loss and wear rate of all specimens for a sliding distance up to 942 meters. Mass loss is minimum in sample C followed by sample B, sample A and Base metal. The wear vs time graph has been shown in Fig 9. It presented the wear of all samples for duration of 10 minutes. The wear was minimum in sample C followed by sample B, sample A and Base metal.
Fig 8: wear rate of samples w.r.t. time Fig 9: wear of samples w.r.t. time
Wear rate was plotted on the graph against time in Fig 8 which shows amount of wear of a calculated interval of time of hardfaced deposits. Sample C has least wear compared to other. This shows the presence of higher amount of Cr results in increased carbide formation which acts as barrier to the removal of material in wear, hence lower wear rate. Except Cr, other key elements Mo and V, this tends to increase in hardness. As the hardness increases, there is decrease in wear rate. Wear rate decreases with time and tends to stable.
E. Spectral Analysis
Table 7 shows the results of the chemical composition measured on the surface of the last pass of each sample. The deposited material was a modified version with higher content of C and Cr and the addition of Si, Mo and V. these changes in chemical composition were designed to improve the wear behaviour of these deposits. As the number of layer increased, there were changes in chemical composition i.e. percentage of formation of carbides results in increase in hardness and improved wear. Sample C has been observed the highest weight percentage of C, Cr, and other alloying elements.
TABLE VII
CHEMICAL COMPOSITION OF HARDFACED SAMPLES
Description
Elements in percentage of weight
C Si Mn P S Cr Mo V Fe
Base metal 0.20 0.23 0.65 0.007 0.021 0.029 - - Rest
Hardfacing electrode
0.50 0.70 0.70 - - 7.00 0.80 0.50 Rest
Sample A 0.876 1.063 0.290 0.037 0.026 >5.000 0.728 0.508 Rest
0 0.1 0.2 0.3 0.4 0.5 0.6 sample A sample B sample C B.M. 0.1428 0.0672 0.0273 0.5071 w ear r at e (g/ h r) 0 500 1000
0 100 200 300 400 500 600 700
w ear (m ic ro m et er ) time (s)
Sample B 0.867 1.108 0.304 0.037 0.026 >5.000 0.741 0.513 Rest
Sample C 0.884 1.068 0.301 0.041 0.028 >5.000 0.796 0.535 Rest
IV. CONCLUSION
Based on the achieved results of the study of the structural compositions of multilayer hardfacing, the measurements of their adhesive wear resistance, the following can be concluded:
A. The hardness and wear values confirm the correctness of the principal that the maximal properties are not achieved by hardfaced materials until the third layer. For practical application it is necessary to execute the welding process with minimal melting of the base material and low heat input. All samples with low heat input exhibited high alloy content and high proportions of martensite and retained austenite results high hardness.
B. In set condition of wear, the hardfacing made up to three layers seem more favourable. The tough martensite and retained austenite dispersely reinforced by a carbidic phase provides good resistance to adhesive wear. In terms of chemical composition and manufacturing technology, these hardfacing appear economical despite of replacing worn out parts by new one.
C. Maximum hardness of 655 HV0.5 is achieved in three layer hardfacing while 621 HV0.5 in two layer hardfacing and 536 HV0.5 in single layer hardfacing. Single layer hardfacing deposit shows epitaxial growth in the deposits. Two and three layer hardfacing samples shows a microstructure composed of martensite and retained austenite, with a pattern of dendrites segregation which became more refined. These changes result to increase in hardness.
D. Minimum wear rate of 0.0270 gm/hr is observed in three layers hardfacing followed by wear rate of 0.0672, 0.1428 and 0.5070
gm/hr in two layer hardfacing, one layer hardfacing and base metal respectively. From these obtained result it is concluded that increase in number of layers results to decrease in wear rate due to increase in hardness.
E. Minimum dilution of 20.53% is noticed in three layers hardfacing while maximum dilution of 23.22% with single layer hardfacing is observed. The dilution percentage has not much variation in multipass multilayer hardfacing because the melting of layer 3 over layer 2 and layer 1 does not show significant effect to mixing of layer 3 with base metal.
F. Based on the obtained results, it can be concluded that maximum results are achieved in three layers hardfacing in terms of high hardness and increased wear rate although there was not too much increase in hardness w.r.t. two layers hardfacing. Therefore only to achieve the desired maximum hardness, three layer hardfacing is allowed otherwise two layer hardfacing is better as per economical point.
REFERENCES
[ 1 ] Crook, P. and Farmer, H.N., 1992. Friction and wear of hardfacing alloys. ASM International, ASM Handbook,, 18, pp.758-765.
[ 2 ] Hutchings, I.M., 1992. Tribology: friction and wear of engineering materials. Edward Arnold, London, 175
[ 3 ] Vazquez, C.R., Loureiro, A. and Cribeiro, J.P., 2000. Comportamiento frente al desgaste abrasivo de las aleaciones con tendencia a la formacion de carburos
aplicados por soldadura. Mantenimiento, 134, pp.78-89.
[ 4 ] Chatterjee, S. and Pal, T.K., 2003. Wear behaviour of hardfacing deposits on cast iron. Wear, 255(1), pp.417-425.
[ 5 ] Choo, S.H., Kim, C.K., Euh, K., Lee, S., Jung, J.Y. and Ahn, S., 2000. Correlation of microstructure with the wear resistance and fracture toughness of
hardfacing alloys reinforced with complex carbides. Metallurgical and Materials Transactions A, 31(12), pp.3041-3052.
[ 6 ] Kotecki, D.J. and Ogborn, J.S., 1995. Abrasion resistance of iron-based hardfacing alloys. Welding Journal-Including Welding Research Supplement, 74(8),
pp.269-278.
[ 7 ] Wu, W. and Wu, L.T., 1996. The wear behaviour between hardfacing materials. Metallurgical and Materials Transactions A, 27(11), pp.3639-3648.
[ 8 ] Vardavoulias, M., 1994. The roles of hard second phases in the mild oxidation wear mechanism of high-speed steel-based materials. Wear, 173(1-2),
pp.105-114.
[ 9 ] Beynon, J.H., 1998. Tribology of hot metal forming. Tribology International, 31(1), pp.73-77.
[ 1 0 ] Lim, S.C., 1998. Recent developments in wear-mechanism maps. Tribology International, 31(1), pp.87-97.
[ 1 1 ] Buchanan, V.E., Shipway, P.H. and McCartney, D.G., 2007. Microstructure and abrasive wear behaviour of shielded metal arc welding hardfacings used in the
sugarcane industry. Wear, 263(1), pp.99-110.
[ 1 2 ] Buchanan, V.E., McCartney, D.G. and Shipway, P.H., 2008. A comparison of the abrasive wear behaviour of iron-chromium based hardfaced coatings