M E T H O D
Open Access
VIPER: variability-preserving imputation for
accurate gene expression recovery in
single-cell RNA sequencing studies
Mengjie Chen
1,2*and Xiang Zhou
3,4*Abstract
We develop a method, VIPER, to impute the zero values in single-cell RNA sequencing studies to facilitate accurate transcriptome quantification at the single-cell level. VIPER is based on nonnegative sparse regression models and is capable of progressively inferring a sparse set of local neighborhood cells that are most predictive of the expression levels of the cell of interest for imputation. A key feature of our method is its ability to preserve gene expression variability across cells after imputation. We illustrate the advantages of our method through several well-designed real data-based analytical experiments.
Introduction
Single-cell RNA sequencing (scRNAseq) technique is becoming increasingly popular in transcriptome studies [1–5]. While previous bulk RNAseq measures average gene expression levels across cells by ignoring potential cell-to-cell heterogeneity, scRNAseq provides an unbiased characterization of gene expression at each single-cell level. The high resolution of scRNAseq has thus far transformed many areas of genomics. For example, scRNAseq has been applied to classify novel cell subtypes [6, 7] and cellular states [2, 4], quantify progressive gene expression [8–12], perform spatial mapping [13, 14], identify differentially expressed genes [15–17], and investigate the genetic basis of gene expression variation [18,19].
While scRNAseq holds great promise in studies with complex cellular compositions, it also suffers from several important technical disadvantages that limit its use in many settings. These disadvantages include low transcript capture efficiency, low sequencing depth per cell, and wide-spread dropout events, to name a few [20–23]. As a consequence, the gene expression measurements obtained in scRNAseq often contain a large amount of zero values, many of which are due to dropout events [20–23]. For example, a typical drop-seq scRNAseq data can contain
up to 90% zero values in the expression matrix [24, 25]. Excess of zero values hinders the application of scRNAseq in accurate quantitative analysis [24–27]. In addition, standard analytic methods developed under bulk RNAseq settings do not account for the excess of zero values observed in scRNAseq data; thus, direct application of these bulk RNAseq methods to scRNAseq often results in sub-optimal performance [20,28–30].
Several imputation methods have been recently pro-posed to address the challenges resulted from excess zero values in scRNAseq [24–27]. ScRNAseq imputation relies on the fact that similar cells or correlated genes often con-tain valuable information for predicting the missing value of a given gene in a given cell. By borrowing information across other cells or other genes, scRNAseq imputation methods construct predictive models to fill in the missing expression measurements. For example, the imputation method SAVER borrows information across genes that are correlated with the gene of interest and uses penalized re-gression models to impute its missing values [24]. MAGIC constructs a power transformed cell-to-cell similarity matrix and borrows information across cells that are simi-lar to the cell of interest for imputation [25]. scImpute first clusters cells into different subpopulation and then uses only cells within the same subpopulation to perform imputation [26]. Finally, DrImpute clusters cells into dif-ferent subpopulations, uses each subpopulation in turn to predict the expression level for the cell of interest, and * Correspondence:mengjiechen@uchicago.edu;xzhousph@umich.edu
1Department of Medicine, University of Chicago, Chicago, IL 60637, USA 3Department of Biostatistics, University of Michigan, Ann Arbor, MI 48109,
USA
Full list of author information is available at the end of the article
eventually averages these predicted values across all sub-populations as the final imputed value [27].
While existing imputation methods have yielded promis-ing results, they also have important drawbacks. For ex-ample, methods such as MAGIC perform imputation based on a low-dimensional space projected from the data, but imputation on a low-dimensional space will likely eliminate gene expression variability across cells and thus abolish a key feature of single-cell sequencing data [25,26]. As an-other example, some methods treat all zero expression values as missing data, but failing to distinguish a zero that is due to dropout event from low expression may lead to a loss in imputation accuracy [26, 27]. In addition, some existing imputation methods rely on algorithms that require input parameters that are difficult and even impos-sible to pre-specify in real data applications. For example, methods such as scImpute require knowing the true num-ber of cell subpopulations in the data a priori, and some-times also the number of low-dimensional factors that are used to classify these cell subpopulations [26, 27]. As we will show later, misspecification of the number of cell subpopulations in these methods can introduce artificial clusters to imputed data set. In contrast, some method such as SAVER relies on a Markov chain Monte Carlo algorithm to infer all tuning parameters in a sophisticated model, but by inferring all tuning parameters, it becomes extremely slow computationally and may not be applicable to large data sets [24].
Here, we describe a straightforward, accurate, free-of-tuning, and relatively computationally efficient scRNAseq imputation method, which we refer as the Variability-Pre-serving ImPutation for Expression Recovery (VIPER). VIPER borrows information across cells of similar expres-sion pattern to impute the expresexpres-sion measurements in the cell of interest. However, unlike some of the previous cell-based imputation methods, VIPER does not perform cell clustering before imputation nor uses only cells that be-long to the same cell subpopulation for imputation. Instead, VIPER applies a sparse nongenerative regression model to actively select a sparse set of local neighborhood cells that are most predictive of the cell of interest. The selection of this sparse set of cells is done in a progressive manner, and their associated imputation weights are estimated in the final estimation step to ensure both robustness and compu-tational scalability. In addition, VIPER explicitly accounts for expression measurement uncertainty of the zero values in scRNAseq by modeling the dropout probability in a cell-type-specific and gene-specific fashion. VIPER uses an efficient quadratic programing algorithm that infers all modeling parameters from the data at hand while keeping computational cost in check. A key feature of VIPER is its ability to preserve gene expression variability across cells after imputation. We apply our method and compare it with existing imputation methods in several real scRNAseq
data-based analytical experiments. We show that, com-pared to existing methods, VIPER achieves better imput-ation accuracy, preserves gene expression variability across cells, recovers gene expression measurements that better resemble the bulk RNAseq measurements in the same cell type, and facilitates more reproducible differential expres-sion analysis.
Materials and methods
Imputation model and parameter estimation
We aim to impute the zero values in the gene expression matrix of scRNAseq by borrowing information across cells. To do so, we denoteCi,jas the observed gene expression count forith cell andjth gene, withi∈{1,⋯,n} andj∈{1, ⋯,m}. We denote Ni¼Pmj¼1Ci;j as the total read depth forith cell and obtained normalized gene expression levels in terms of RPM (reads per million reads) defined as Ri;j
¼Ci;j Ni 10
6. While we use RPM in the present study, we
note that our method is not restricted to the units of meas-urement and is applicable to alternative normalized mea-surements such as TPM (transcripts per kilobase per millions reads) or RPKM (reads per kilobase per millions reads). We denoteXi,jas the normalized expression level obtained from RPM values by further performing a log transformation Xi, j= log(Ri, j+ 0.1). For imputation, we examine one cell at a time. Forith cell, we assume that its normalized expression level for thejth gene in expectation can be expressed as a summation of the expression levels of the same gene across all other cells
E Xi ;j¼
X
l∈f1;⋯;i−1;iþ1;⋯;ngXl;jbi;l;
where bi, lis the predictive effect of lth cell onith cell. Note that we only specify a mean model as we only intend to perform single imputation. Single imputation of the mean does not require a full modeling specifica-tion for the response variable Xi, j (more details in the “Discussion”section).
We assume that the predictive effectsbi,lare all non-negative with∑l∈{1,⋯,i−1,i+ 1,⋯,n}bi,l= 1, so that all bi, l are bounded between 0 and 1 and can be naturally preted as imputation weights. Besides the ease of inter-pretation, bounding all bi, l also ensures imputation stability. Under the above model, the expression levels of
weight constraint, our model becomes effectively a sparse nonnegative regression model [31]. Note that, be-cause we model each cell separately, the neighborhood cell list is not symmetric: the fact thatlth cell is a neigh-borhood of ith cell does not guarantee that ith cell is also a neighborhood oflth cell. This asymmetric pattern ensures that the identification of neighborhood cells is optimal for each cell. Once we obtain the parameter esti-mates ^bi;l, for each missing data Xi, j in turn, we then plug in these estimates to obtain a predicted value X^i;j
¼Pl∈f1;⋯;i−1;iþ1;⋯;ngXl;j^bi;l as the imputed value. To
re-duce the influence of missing values in the weight esti-mation, the model is fitted using genes that have a zero rate less than a threshold (set to be 10% in the analyses presented in this paper).
We estimate the predictive effect parametersbi,lfrom the above mean model using ordinary least squares with a quadratic programming algorithm. Specifically, we re-formulate parameter estimation problem in the above model to an optimization problem, where, for each celli in turn, we aim to obtain a set ofith cell-specific predic-tion weights (bi, 1,⋯,bi, i−1,bi, i+ 1,⋯,bi, n) from all other cells by minimizing the sum of square prediction errors for
min
bi;1;⋯;bi;i−1;bi;iþ1;⋯;bi;n
f g
Xm j¼1 Xi;j−
X
l∈f1;⋯;i−1;iþ1;⋯;ngXl;jbi;l
2
;
where the nonnegative effects bi, l satisfy the constraint that bi, 1+⋯+bi, i−1+bi, i+ 1+⋯+bi, n= 1, with the non-zero effects being above a certain threshold of t= 0.001. To optimize the above function, we denoteWi, j= Xi, j−Xn,j,Yl,j=Xl,j−Xn,j, andβ= (bi, 1,⋯,bi,i−1,bi,i+ 1,⋯,bi, n)T. The above constrained optimization problem can be re-expressed as a quadratic programming problem
min
β
1 2β
T Xm
j¼1Y:jY T
:j
β− Xmj¼1Wi;jYT:j
β;
subject to −IIðn−1Þðn−1Þ ðn−1Þðn−1Þ
β≤ 1ðn−1Þ 0ðn−1Þ
, whereI(n−1) × (n
−1) denotes a (n− 1) by (n− 1) identity matrix, 1(n−1)
denotes a (n−1)-vector of 1s, and 0(n−1)denotes a (n−
1)-vector of 0s. We solve the optimization problem using quadratic programming [32]. Once we obtain the prediction weight estimates, we further set those weights less than the threshold oft= 0.001 to be exactly zero to ensure sparsity. Finally, we re-normalize the non-zero weights to ensure a summation of one.
While the above quadratic programming algorithm is effective, we find that the algorithm is computationally inefficient and does not scale well to large-scale scRNA-seq data sets. To ensure algorithm scalability and avoid model overfitting, we perform a pre-selection procedure
to first select a small set of candidate cells that will be eventually selected as local neighbors. Specifically, for each cell i in turn, we apply standard penalized regres-sion model (lasso or elastic net, with the default tenfold cross validation to determine the penalty parameter) using a random sampled set of 5,000 genes to identify a set of candidate cells that are predictive of the expres-sion of the ith cell. Among these candidate cells, we apply the quadratic programming algorithm described previously to further identify a set of neighborhood cells for final imputation. Therefore, our imputation method eventually consists of two steps: a lasso/elastic net-based pre-selection step and a quadratic programming algorithm-based fine tuning and estimation step. With two separate steps, our method ensures computational scalability while avoiding model overfitting by sequen-tially reducing model complexity.
Finally, we note that a zero count can be generated by two possible mechanisms: it either comes from a drop-out event or represents a low or zero level of gene ex-pression. If the zero value of Cl, j is due to a dropout event, then it is not an accurate measurement of the true expression level ofjth gene in lth cell. Subsequently, we do not wish to use the normalized value Xl, j from a dropout event to imputeXi, j. However, if the zero value of Cl, j comes from low or zero expression level of jth gene in lth cell, then we would want to use the normal-ized value Xl, j to impute Xi, j. To distinguish between these two possibilities, we estimate an expected expres-sion level for any zero value of Cl, j and use these esti-mates to perform imputation. The modeling and estimation details for this dropout adjustment step are provided in detail in the Additional file1: Supplementary Text. Briefly, we assume that the gene expression levels of thejth gene for all selected neighborhood cells for the
ith cell of interest follow a zero-inflated Poisson mixed model, such thatCl,j~pi,jδ0+ (1−pi, j)PMM(Nlλl, j,ψi,j). In the model, pi, j represents the dropout probability of
jth gene that is specific for all neighborhood cells of the
ith cell of interest;δ0denotes a point mass at zero;Nlis the total read depth for the lth cell; λl, j is the Poisson rate parameter that represents the expression level ofjth gene in thelth cell; ψi, jis an over-dispersion parameter that is specific forjth gene and for all neighborhood cells of the ith cell of interest; and PMM denotes a Poisson mixed effects model. Under the zero-inflated Poisson mixed effects model,Cl, jis exactly zero with a dropout probability pi, j and follows an over-dispersed Poisson distribution with probability 1−pi,j. Our goal is to esti-mate λl, j, the underlying expression level of jth gene in
neighborhood cells for the ith cell of interest. After-wards, we obtain an estimate of^λl;j and use it to replace
Xl,jto serve as the final predictor variable. Certainly, we use the normalized expression measurementXl,jdirectly as the predictor variable ifCl,jis non-zero.
We refer to our method described above as the Variability-Preserving ImPutation for Expression Recovery (VIPER). We note that the non-statistical term“variability preserving”in the method name refers to the fact that our method is capable of preserving gene expression variance across cells after imputation, as we will show in the fol-lowing real data-based analytic experiments. The property of “variability preserving” in our method contrasts a few other imputation methods that aggressively reduce vari-ance across cells after imputation (e.g., MAGIC and scIm-pute). However, we also acknowledge that, just like any existing single-cell imputation method, our method is a single imputation method that suffers from the usual drawbacks when compared to other more advanced imputation methods such as multiple imputation [33].
Real data sets
We examine four scRNAseq data collected from three studies. These three studies include both unique mo-lecular identifier (UMI)-based techniques (CEL-seq; the first study) and non-UMI-based techniques (Fluidigm C1; the second two studies).
Specifically, the first data set is from Grun et al. [34]. It is a mouse study that examines a total of 251 cells that were cultured in two different media. These cells include 74 embryonic stem cells (ESCs) cultured in a two-inhibitor (2i) medium, 45 ESCs cultured in a serum medium, 56 samples with pooled RNA from ESCs cul-tured in a 2i medium, and 76 samples with pooled RNA from ESCs cultured in serum. The first two types of cells are single-cell measurements while the second two types of samples are measurements averaged across single cells. We obtained raw UMI count measurements for 23,459 genes from the authors. We selected genes that are expressed in at least 10% of the cells and analyzed a total of 12,184 genes in the final analyses.
The second and third data are both from Chu et al. [35]. The second data set contains gene expression mea-surements for 1,018 single cells from both human ESCs and the lineage-specific progenitor cells derived from these ESCs. We refer to the second data as the “Cell Type”data because the cells belong to seven known cell subpopulations that include neuronal progenitor cells (NPCs), definitive endoderm derivative cells (DEDs), endothelial cells (ECs), trophoblast-like cells (TBs), un-differentiated H1 and H9 ESCs, and foreskin fibroblasts (HFFs). Note that above we denoted the definitive endo-derm derivative cells as DEDs instead of the traditional
notation of DEs because we later used DE to represent differential expression. Besides the single-cell data, the second data also contains 19 corresponding samples from bulk RNAseq. The third data set contains gene expression measurements for 758 single cells. We refer to the third data set as the “Time Course” data as the cells are collected at six different time points (0, 12, 24, 36, 72, and 96 h) during the developmental trajectory of ESCs differentiating towards DEDs. In addition to the single-cell data, the third data also contains 15 samples from bulk RNAseq for all other time points except for 0 h. We downloaded both the second and third data in terms of four expected count matrices from the Gene Expression Omnibus (GEO) website with accession number GSE75748. We filtered out genes that are expressed in less than 10% of the cells and analyzed a total of 13,829 genes in the Cell Type data and 13,059 genes in the Time Course data.
The fourth data is from Shalek et al. [15]. It contains gene expression measurements for 1,700 primary mouse dendritic cells (DCs) stimulated with three pathogenic components for different amount of time (1 h, 2 h, 4 h, and 6 h). The three pathogenic components include lipopolysaccharide (LPS) which is a component of Gram-negative bacteria, PAM3CSK4 (PAM) which is a synthetic mimic of bacterial lipopeptides, and PIC which is a viral-like double-stranded RNA. For this data, we retained cells with library sizes greater than one million. After further filtering out genes that are expressed in less than 10% of the cells, we focus on a final set of 1,053 cells with 16,702 genes for the following analysis.
Real data-based experiments
We performed three different experiments using published scRNAseq data. Two experiments (masking and compari-son to bulk RNAseq) are described in detail in the “Results” section. We describe the details of the third down-sampling experiment in the following paragraphs. The down-sampling experiment is performed on one real data at a time and consists of two steps.
ensures that the expected gene expression proportion of each cell remains unchanged after down-sampling.
The down-sampled data from the first step contains both zero values and non-zero values. After the initial down-sampling step, we further introduce extra dropout events to the non-zero values as a second step of the down-sampling experiment, in order to mimic data gen-erating process of real scRNAseq data. These dropout events are introduced to each of the non-zero values by sampling from a Bernoulli distribution characterized by a dropout rate. The dropout rate is designed using two different strategies. In the first strategy, we set a fixed dropout rate of 0.8 that is independent of the non-zero value from the initial multinomial sampling step. In the second strategy, we model the dropout rate as a logistic function of the non-zero down-sampled value. This lo-gistic function is estimated in the original data for each cell subpopulation separately. Specifically, within each cell subpopulation, for each gene in turn, we obtained the percentage of zero values and the mean of non-zero values across all cells. Treating the zero percentage as outcome and the non-zero means as explanatory vari-able, we fitted a logistic regression model to establish their quantitative relationship in each cell subpopulation. Afterwards, we used the fitted logistic model to compute a dropout rate for each non-zero value in the data ob-tained from the initial down-sampling step. With either strategy, we set each non-zero value to be zero with a probability equal to the dropout rate. Therefore, the zero values in the final down-sampled data are either due to low expression values in the original data and the subse-quent multinomial down-sampling (i.e., first step) or due to the extra dropout events (i.e., second step).
We examined several down-sampling scenarios based on various down-sampling rates. In each scenario, we per-formed imputation on the zero values resulting from either multinomial down-sampling or from the additional drop-out events. We measured imputation accuracy by compar-ing the imputed data to the original data across all entries. Note that the zero values that were already present in the original data were not analyzed here because we do not know their“true”values in the original data.
Methods for comparison
We compared our method with four existing imputation methods. These imputation methods include DrImpute [27] (version 1.0), MAGIC [25] (version 0.1.0), SAVER [24] (version 0.3.1), and scImpute [26] (version 0.0.5). Note that we downloaded most of these software versions and compared them in 2017 when the original papers describing these methods were unpublished. We carried out analyses following the recommended procedure from each software. The software scImpute also requires a spe-cification of the number of cell subpopulations, which is
generally unknown in most real data. Here, we set the number of cell subpopulations required by scImpute to be the truth in all our experiments (except those described in the“Discussion” section). To assess imputation accuracy, in one experiment, we performed differential expression analysis between pairs of cell subpopulations following im-putation. For differential expression analysis, we used three different DE software that include DEseq2 [36] (ver-sion 1.16.1), edgeR [37–39] (version 3.20.7; with either the likelihood ratio test, LRT, or with the quasi-likelihood F test, QLF), and SCDE [20] (version 1.99.1). Note that SCDE was specifically designed for single-cell DE analysis. Both edgeR and DEseq2 were originally designed for bulk RNAseq studies and do not account for the excessive zero values encountered in the single-cell RNAseq data. How-ever, recent comparative studies have suggested that the QLF version of edgeR and DESeq2 enjoy superior per-formance for single-cell DE analysis than many single-cell data-specific DE methods [38]. We carried out differential expression analyses also following the recommended procedure from each software.
Results
Method and analysis overview
Finally, when imputing the zero values, VIPER also ex-plicitly models a gene-cell-specific dropout probability to distinguish between zero due to a dropout event and due to a low or zero level of gene expression, which fur-ther improves imputation accuracy.
We use four real data sets from three published studies to evaluate the performance of our method. The details of these data are described in the “Materials and methods” section. We refer to the first data as the Grun et al. data [34], the second data as the Cell Type data which is ob-tained from Chu et al. [35], the third data as the Time Course data which is also obtained from Chu et al. [35], and the fourth data as Shalek et al. data [15]. Both the Cell Type and Time Course data also contain a corresponding bulk RNAseq data. We used all data sets in most of our evaluation experiments described in the following sections. In addition, we used primarily the Cell Type and Time Course data from Chu et al. [35] for some simple illustra-tions described in the“Discussion” section and for an ex-periment that requires corresponding bulk RNAseq data.
We compare the performance of our method with existing approaches, including (1) DrImpute, which re-lies on pre-identified cell subpopulations for imputation [27]; (2) MAGIC, which uses a power-transformed cell similarity matrix constructed using a few number of principal components to perform imputation [25]; (3) SAVER, which uses genes that are correlated with the gene of interest to perform imputation [24]; and (4) scImpute, which also uses pre-identified cell subpopula-tions to perform imputation [26]. We access the
accuracy of different imputation methods by performing four real data-based experiments.
Assessing imputation accuracy through data masking
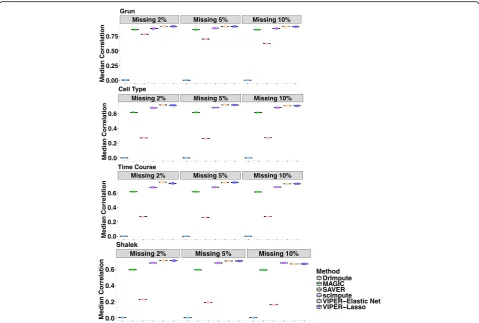
First, we assess imputation performance of different methods in recovering randomly masked non-zero gene ex-pression values. To do so, in each of the four scRNAseq data (Grun, Cell Type, Time Course, Shalek), we randomly selected a fixed percentage (2%, 5%, or 10%) of non-zero entries in the observed data matrix and masked these values to be zero to generate a new gene expression matrix. We then apply different methods to the newly generated gene expression matrix and compute the correlation be-tween the imputed values and the masked values across all entries as a measurement of imputation accuracy. For each data set, we perform 10 masking replicates and plot the re-sults across these replicates in Fig. 2. Overall, VIPER out-performs all other existing approaches in all data sets. The performance of our method is followed by scImpute and MAGIC, while SAVER and DrImpute do not perform well. For example, in Cell Type data, when masking percentage is 2%, the correlation between the imputed values by VIPER and masked truth is 0.71 (when lasso is used in the pre-selection step) or 0.72 (when elastic net is used in the pre-selection step), while the correlation by DrImpute is 0.0005, by MAGIC is 0.62, by SAVER is 0.27, and by scIm-pute is 0.68. In addition, as one might expect, the perform-ance of our method and the other methods decay slightly with the increasing of masking percentage, though the rankings of different methods remain the same. For
SC 2i RNA 2i SC serum RNA serum
Grun
(A)
(B)
Cell Type
H1 H9 DEC EC HFF NPC TB
(C)
(D)
12h 24h 36h 72h 96h
Time course
(E)
(F)
LPS_1h LPS_2h LPS_4h LPS_4h_Replicate LPS_6h PAM_1h PAM_2h PAM_4h PAM_6h PIC_1h PIC_2h PIC_4h PIC_6h Unstimulated Unstimulated_Replicate
Shalek
(G)
(H)
Fig. 1Estimated imputation weights inferred in the two steps of the VIPER method in four data sets. Results are shown for Grun data (a,b), Cell
[image:6.595.59.540.88.310.2]example, in Cell Type data, when masking percentage in-creases to 10%, the correlation between the imputed values by VIPER and the truth is 0.70 (for lasso) or 0.71 (for elastic net), while the correlation by DrImpute is 0.0007, by MAGIC is 0.61, by SAVER is 0.27, and by scImpute is 0.68. The rankings of different methods are similar when we use squared loss (a.k.a mean squared error) and L1 loss (a.k.a. mean absolute deviation) as alternative imputation accuracy measurements (Additional file 2: Figures S2–S4). For ex-ample, in Cell Type data, when masking percentage is 2%, the square loss for the imputed values when compared to the masked truth is 0.66 (for lasso) or 0.651 (for elastic net) by VIPER, while the square loss by DrImpute is 15.698, by MAGIC is 3.029, by SAVER is 13.696, and by scImpute is 0.98. The masking experiments suggest that our method is capable of accurately recovering the true expression levels in real data.
Assessing imputation accuracy through down-sampling
Second, we assess the performance of different imput-ation methods using two down-sampling experiments.
The procedure of the down-sampling experiments is de-scribed in detail in the “Materials and methods”section with an illustration in Additional file 2: Figure S5. Spe-cifically, we generated down-sampled version of each of the four scRNAseq data through multinomial down-sampling, created additional zero values by intro-ducing dropout events, applied different methods to im-pute the zero entries in the down-sampled data, and examined whether these imputed values recover the known truth compared to the original data. The dropout events are introduced using a rate that is either dependent or independent on the expression values (de-tails in the “Materials and methods” section). The zero values due to low expression level and the multinomial down-sampling or due to the additional dropout events vary across different data sets (Additional file 3: Table S1). For example, with a dropout rate dependent on the expression values and a down-sampling rate of 0.9, 8.52% of the zero values in the Grun down-sampled data are due to multinomial down-sampling (while 91.48% are due to dropout); 43.7% of zeros in the Cell Type
Missing 2% Missing 5% Missing 10%
0.00 0.25 0.50 0.75
Median Correlation
Grun
Missing 2% Missing 5% Missing 10%
0.0 0.2 0.4 0.6
Median Correlation
Cell Type
Missing 2% Missing 5% Missing 10%
0.0 0.2 0.4 0.6
Median Correlation
Time Course
Missing 2% Missing 5% Missing 10%
0.0 0.2 0.4 0.6
Median Correlation
Method DrImpute MAGIC SAVER scImpute VIPER Elastic Net VIPER Lasso Shalek
Fig. 2Correlation between the masked truth and imputed values by different methods in the data masking experiment. Rows represent the four different
[image:7.595.58.538.87.410.2]data, 35.59% in the Time Course data, and 29.38% in the Shalek data are due to multinomial down-sampling. The down-sampling experiment provides a unique opportunity for us to assess the performance of different imputation methods for imputing these two different types of zeros separately. To assess imputation accuracy, for zeros due to dropout, we computed the correlation between the im-puted data and the original data before down-sampling. For zeros due to low abundance and down-sampling, we calculated the L1 loss between the imputed data and the original data before down-sampling; we did not use correl-ation for down-sampling zeros here because correlcorrel-ation is no longer an effective measurement due to the excessively large number of zeros in the original data for these down-sampling zeros. The results are shown in Fig. 3. Corresponding results measured with L1 loss for both these two types of dropout rates are consistent with the main results and are shown in Additional file2: Figure S6.
For the zeros due to dropouts, VIPER outperforms most other imputation approaches across the four differ-ent data sets and the two differdiffer-ent dropout rate settings: it is ranked as the best method in six out of the eight scenarios examined. The only exceptions are Time Course data as well as the Grun et al. data with an expression-dependent sampling rate (i.e., one scenario out of eight), where, in the later case, while VIPER
outperforms SAVER when the down-sampling rate is high (0.6 to 0.95), it performs slightly worse than SAVER in the presence of a low down-sampling rate (0.5). The perform-ance of our method in other settings is generally followed by SAVER and then scImpute, while DrImpute and MAGIC do not work well. For example, in the Cell Type data, when the down-sampling rate is 0.5, the correlation between the imputed values in the down-sampled data and the truth in the original data is 0.830 using lasso and 0.832 using elastic net by VIPER, while the correlation by DrIm-pute is 0.572, by MAGIC is 0.266, by SAVER is 0.828, and by scImpute is 0.522. The rankings of different methods also remain largely the same when we use different down-sampling rates or alternative down-sampling strategies.
For the zeros due to low expression abundance and multinomial down-sampling, VIPER outperforms all other imputation approaches except for SAVER across the four different data sets and the two different dropout rate set-tings. VIPER and SAVER were each ranked as the best method in four out of the eight scenarios. In particular, VIPER produces better results than SAVER in three out of four data sets when we use expression-independent drop-out rates and produces better results in one drop-out of four data sets when we use expression-dependent dropout rate. The good performance of SAVER in half of the scenarios
Dependent Uniform
Shalek Time Course Cell Type Grun
0.2 0.4 0.6 0.8 0.2 0.4 0.6 0.8 0.3 0.5 0.7 0.50 0.55 0.60 0.65
0.3 0.6 0.9
1 2 3 1
2 3 4
1 2 3 4
Correlation (Drop out entries)
L1 Loss (Do
w
n
sampling entries)
Shalek Time Course Cell Type Grun
0.6 0.7 0.8 0.9 0.7 0.8 0.9 0.7 0.8 0.9 0.85 0.90
0.3 0.6 0.9
1 2 3 1
2 3 4
1 2 3 4
Correlation (Drop out entries)
L1 Loss (Do
wn
sampling entries)
Method DrImpute MAGIC SAVER scImpute VIPER Elastic Net VIPER Lasso
Downsampling 0.5 0.6 0.7 0.8 0.9 0.95
(A)
(B)
Fig. 3Imputation accuracy in the down-sampling experiment. Results are shown for down-sampling experiments using either
[image:8.595.57.539.409.644.2]for imputing zeros due to low expression abundance is presumably due to the fact that the imputed values from SAVER do not differ much from the unimputed data in general (which will become apparent in the next section); thus, the imputed values from SAVER for these zeros due to low expression abundance remain close to zero. The performance of our method and SAVER is followed by either DrImpute or scImpute, depending on the data set, while MAGIC does not work well here. For example, in the Cell Type data, when the down-sampling rate is 0.5, the L1 loss between the imputed values in the down-sampled data and the truth in the original data is 0.405 (for either lasso or elastic net) by VIPER, while the L1 loss by DrImpute is 0.686, by MAGIC is 4.182, by SAVER is 0.514, and by scImpute is 0.857. The rankings of different methods remain largely the same when we use different down-sampling rates.
Therefore, consistent with the masking experiments, the down-sampling experiments here also suggest that VIPER is capable of accurately recovering the true expression levels in real data.
Assessing imputation accuracy by comparing to bulk RNAseq
Third, we assess the performance of different methods by comparing the imputed gene expression values from scRNAseq to the expression values measured by bulk RNAseq in the same cell subpopulation. To do so, we rely on the Cell Type and Time Course data from Chu et al. [35] that also have bulk RNAseq data measured in the same cell subpopulations. We apply different methods to perform imputation in each data and display the imputed values from scRNAseq together with the bulk RNAseq data in Fig. 4 (for Cell Type data) and Additional file 2: Figure S7 (for Time Course data). The gene expression heatmaps show that there are almost no zero entries in the bulk RNAseq data, but there is a large proportion of zero entries in the raw scRNAseq data before imputation. In addition, scRNAseq data display a substantial gene expression variation across cells within each cell subpopulation. Intuitively, a good imputation method would generate an expression heatmap lying somewhere between the bulk RNAseq data and the raw
Before Imputation Bulk
VIPER-Elastic Net VIPER-Lasso
DrImpute
SAVER scImpute
MAGIC
H1 H9 DEC EC HFF NPC TB H1 H9 DEC EC HFF NPC TB Cell Type
Cell Type
Fig. 4Heatmaps show the unimputed or imputed gene expression measurements in the scRNAseq data together with the gene expression
[image:9.595.57.540.351.675.2]scRNAseq data: the imputed data should contain mean gene expression levels that are consistent with the bulk RNAseq data, but also maintain substantial gene expres-sion variation across cells within the subpopulation. After imputation, with the exception of SAVER (and to a less extent of DrImpute), we found that most imputation methods are able to replace a large proportion of zero en-tries with imputed values. In addition, the imputed data from VIPER (with lasso or elastic net) lies somewhere be-tween the bulk RNAseq data and the raw unimputed scRNAseq data, with reasonably accurate mean estimation and substantial variation across cells. In contrast, the im-puted data from SAVER looks very similar to the raw scRNAseq data before imputation, while the imputed data from scImpute and MAGIC only resemble the bulk RNA-seq data well. Careful examination of the imputed data heatmap also suggests that the imputed data from DrIm-pute appears to be deprived much of the gene expression variation across genes, while the imputed data from MAGIC (and to a less extent scImpute) appears to be de-prived much of the gene expression variation across cells—even though the mean imputed gene expression levels across cells within each cell subpopulation from MAGIC resemble quite closely to that of bulk RNAseq.
To quantify the performance of different imputation methods in terms of recovering the mean expression level of each cell type, we averaged the expression levels across all cells within a cell subpopulation to obtain an averaged gene expression measurement in the imputed scRNAseq data. For each cell subpopulation in turn, we then com-puted the correlation between bulk RNAseq and the im-puted mean scRNAseq measurements across all genes (Fig.5a, b). Among these methods, MAGIC produces the highest correlation, suggesting that MAGIC is capable of imputing the mean expression level across cells within each cell subpopulation relatively accurately, even though it eliminates the majority of the variability across cells (see also the next paragraph). In contrast, our method works well in recovering the mean expression level of a cell type while maintaining the expression variability across cells within the same cell type. The performance of our method is followed by scImpute. On the other hand, the imputed mean expression values by SAVER are correlated with bulk RNAseq in the same degree as unimputed data, while the imputed mean expression values by DrImpute are less correlated with bulk RNAseq compared to the unimputed data. The similar or reduced correlation between the im-puted data by SAVER/DrImpute and bulk RNAseq data suggests that both SAVER and DrImpute do not improve gene expression measurement accuracy in these data.
To quantify the cross-cell gene expression variability in the imputed data sets, for each gene in turn, we com-puted the coefficient of variation (CV) across cells after imputation and compared it to the CV of the non-zero
values before imputation. We contrasted these two CV values for DEC cells in Cell Type data set and stratified the contrast by showing different zero proportions (Fig.5c) or different non-zero mean expression levels (Add-itional file2: Figure S8) with colors in gradient. Intuitively, for a given gene, if the zero values across cells are all due to dropout events, then we would expect the CV after im-putation to be similar to the CV before imim-putation— be-cause the imputed data would follow the same distribution as the non-zero values before imputation. In contrast, if the zero values are all due to low gene expres-sion levels, then we would expect the CV after imputation to be higher than the CV before imputation—because the imputed data would generally have lower values than the non-zero values before imputation. Therefore, CV after imputation by a proper method would be either equal to or higher than the CV before imputation. Indeed, our method (lasso or elastic net) produces results that meet this expectation, with some genes having similar CV values after imputation while some genes having higher CV values after imputation. In contrast, almost all genes have smaller CV values after imputation by MAGIC (or, to a less extent, by scImpute), suggesting that MAGIC and scImpute reduce gene expression variability across cells after imputation. The reduced variability by MAGIC or scImpute is consistent with the heatmaps shown in Fig. 4. On the other hand, most genes have higher CV values after imputation by either DrImpute or SAVER, suggesting that DrImpute/SAVER effectively treats most zero values as non-dropout events.
Importantly, CV plots in the other three data sets (Time Course, Grun data, and Shalek data) display similar patterns (Additional file2: Figures S9–S11). We also examined CV plots in the down-sampled data, which allows us to visualize the imputed value variance for two different types of zeros separately: zeros that are due to true zero or low abundance in the original data, and zeros that are due to dropouts. To do so, in the down-sampling experiment, we computed CV for the imputed zeros originating from drop-out together with unimputed data and contrast it with the CV from the corresponding original truth (Additional file2: Figure S12). We also computed CV for the imputed zeros originating from true zero or low abundance together with unimputed data and contrast it again with the CV from the corresponding original truth (Additional file2: Figure S13). Both CV plots are consistent with our main results, sug-gesting that our method is capable of preserving variability regardless which type of zeros we focus on.
Accurate imputation facilitates reproducible differential expression analysis
Finally, we performed differential expression analysis on the imputed data to illustrate the benefits of imputation. Specifically, we focus on detecting differentially expressed genes between pairs of cell subpopulations from the Cell Type data, for all 21 pairs of 7 cell types. For each pair in turn, we randomly split cells into two subsets and applied different DE methods (DESeq2, two different versions of edgeR, and SCDE) to analyze each subset separately. We then computed the proportion of
overlap between the top 100, 200, 500, or 1000 DE genes detected from each subset—and we compute this pro-portion as Jaccard index, defined as the ratio of the intersection and the union between the top gene lists from the two subsets. We performed the random data split 10 times and show the mean overlap proportions of DE genes detected by SCDE from these replicates in Fig.6. The results based on the DE methods edgeR and DESeq2 are similar and are shown in Additional file 2: Figures S14–S16. We also display the overlap propor-tions among the top 100 DE genes across replicates for
0.60 0.65 0.70 0.75 0.80
Correlation
Before Imputation DrImpute MAGIC SAVER scImpute
VIPER Elastic Net VIPER Lasso Time course
0.6 0.7 0.8
Correlation
Cell Type
scImpute VIPER Elastic Net VIPER Lasso
drImpute MAGIC SAVER
0 1 2 3 4 5
0 1 2 3 4 5
CV (Before Imputation)
CV (After Imputation) 0
25 50 75 100 Percentage of
zeros
(A)
(B)
(C)
Fig. 5Quantifying imputed gene expression in scRNAseq.a,bCorrelation between imputed scRNAseq data and bulk RNAseq data across
[image:11.595.61.536.90.492.2]three exemplary pairs (H1 vs DEC, EC vs HFF, and NPC vs TB) in Additional file 2: Figure S17. Intuitively, if an imputation method works well, then DE analysis on the imputed data from the method would yield reproducible results, leading to a high overlap proportion among the top DE genes detected from the two split subsets. Con-sistent with the higher imputation accuracy of our method observed in the previous experiments, our method indeed achieves consistent DE results between the two data subsets, often a few times more so than the other imputation methods, for most cell type pairs. The performance of our method is often followed by MAGIC, and sometimes SAVER. In contrast, DrImpute (and occasionally scImpute) achieves a lower overlap proportion compared with the unimputed data, again consistent with its low performance in other experi-ments. As a concrete example, comparing H1 vs DEC, the mean Jaccard index between the top 100 DE genes detected by SCDE from the two data splits is 0.192 (for lasso) or 0.256 (for elastic net) by VIPER, while the over-lap proportion is 0.035 by DrImpute, 0.238 by MAGIC, 0.048 by SAVER, 0.047 by scImpute, and 0.05 without imputation. Similarly, the mean Jaccard index between the top 500 DE genes detected from the two data splits is 0.421 (for lasso) or 0.600 (for elastic net) by VIPER, while the Jaccard index is 0.044 by DrImpute, 0.238 by MAGIC, 0.099 by SAVER, 0.082 by scImpute, and 0.106 without imputation. Overall, our method produces
reproducible differential expression results between split data sets, suggesting that imputation can facilitate the detection of DE genes.
One thing we noticed in our analysis is that many genes are detected as DE in MAGIC imputed data (Add-itional file2: Figure S21), which likely originates from the diminished gene expression variation across cells within each cell subpopulation after imputation (Additional file2: Figures S18–S20); thus, even a small difference in the mean expression level between two cell subpopulations would lead to a detection of differential expression. As an-other example, besides MAGIC, we found that scImpute also detects a higher number of DE genes than our methods, which is consistent with the reduced gene ex-pression variation across cells in the imputed data from scImpute (Fig.5b). Therefore, we caution that the number of DE genes is likely highly influenced by gene expression variation across cells after imputation.
To further validate our results, we also performed ana-lyses by permuting data in both subsets and performing overlap analysis based on the permuted data. In particu-lar, we permuted cell type labels but preserved the ex-pression correlation structure across genes and then performed DE analysis. Intuitively, if an imputation method introduces artificial bias to the data in the sense of facilitating the identification of DE genes not based on their true differential expression evidence but based on other properties of the gene, then this method would
Fig. 6Overlap of top differentially expressed genes identified by SCDE between two data splits of the raw data or imputed data by different
[image:12.595.59.539.88.296.2]also lead to a high overlap proportion between the two permuted data subsets. The results (Additional file2: Fig-ures S22–S23) show that the overlap proportion detected by all methods, except for MAGIC, in the permuted data are very similar and small, suggesting that most imput-ation methods unlikely introduce artificial bias to the data and that our previous comparison results are valid. On the contrary, MAGIC introduces an excessive number of artificially overlapped DE genes in the permuted data, consistent with the diminished gene expression variation across cells observed in MAGIC imputed data.
Finally, we emphasize that our method is reasonably computationally efficient. We list the imputation time by all methods for the four data sets in Additional file 3: Table S2. The computation time of different methods depends on the number of cell, number of genes, and number of genes that have missing values. Among these methods, MAGIC is the fastest method among all while SAVER is the slowest, and our method is 5–50 times faster than SAVER. Overall, our method is reasonably computationally efficient while producing more accurate results than the other imputation methods.
Discussion
We have presented a new method for imputing gene ex-pression levels in scRNAseq data. We have compared its performance with other existing scRNAseq imputation methods in four experiments using published scRNAseq data sets. With these real data examples, we show that our method achieves higher imputation accuracy compared with existing methods, preserves expression variability across cells, and facilitates the robust identification of dif-ferentially expressed genes between cell subpopulations.
Besides differential expression analysis, several previ-ous studies have also performed clustering analysis on imputed data to identify cell subpopulations. Evaluating the performance of different imputation methods for clustering analysis in real data is challenging because the underlying subpopulation structures are largely un-known. Even for the data set that consists of several dis-tinct cell types, such as the Cell Type data used in this paper, it is unknown whether some cell types are hetero-geneous and consist of cell subpopulations within. Therefore, it is difficult to comprehensively evaluate the performance of different imputation methods for clus-tering in real data. Instead, we present a simple example here to illustrate the behavior of different imputation methods for clustering analysis, using two cell types (H1 and NPC) from the Cell Type data. Specifically, for each cell type, we display cells based on the top two principal components (PCs) extracted from either the raw data or the imputed data by different methods (Additional file2: Figures S24–S25). Overall, the clustering results from VIPER imputed data, as visualized in the PC plots, are
generally consistent with that from raw data, DrImpute imputed data or SAVER imputed data. However, the clustering results obtained from scImpute or MAGIC imputed data are generally different from the raw data and the rest of the methods. Specifically, scImpute re-quires the specification of the number of cell subpopula-tions before imputation, which is unknown in any real data, and which, as is shown below, fully determines the number of cell clusters identified in the imputed data. In particular, when we set the number of cell subpopula-tions to be either 2, 3, or 4 before imputation (2 is the minimum allowed in scImpute), we also detected 2, 3, or 4 cell subpopulations after imputation, respectively. In contrast, MAGIC produces a parabola-shaped curvature in the H1 cells and a circular-shaped curvature in the NPC cells. While not completely impossible, both curva-tures by MAGIC are rather unexpected. Therefore, for any imputation method, we would recommend practi-tioners to carefully examine clustering results both on the raw data and on the imputed data to arrive at a sensible interpretation.
added benefits for larger scRNAseq data where the num-ber of cells exceeds the numnum-ber of genes. Our method can be easily adapted to switch from cell-based imput-ation to gene-based imputimput-ation for large scRNAseq data. In addition, exploring the benefits of combining both imputation strategies will be an important avenue for future research.
Like all other existing imputation methods [24–27], we have been primarily focused on modeling and imputing log-transformed normalized gene expression data that are converted from the original count data. Modeling log-transformed normalized expression data assumes ap-plication of a normalization method as a pre-processing step. Though the performance of normalization methods varies in different settings, VIPER does not depend on choice of a particular normalization method. While in the present study we have only examined a relatively simple normalization method based on RPM, we note that using advanced normalization offsets [40] or including cellular detection rate [41] may further improve the performance of VIPER. Importantly, modeling log-transformed normal-ized gene expression data using Gaussian models is com-putationally more tractable than modeling count data using over-dispersed Poisson models (e.g., negative bino-mial or Poisson mixed models) [42–44]. Because of the computational tractability, modeling log-transformed nor-malized gene expression data are commonly applied in scRNAseq studies for clustering analysis, differential ex-pression analysis, and various other analytic tasks [20,22, 45]. However, scRNAseq data are of count nature. Because of the relatively low sequencing depth of scRNAseq, ac-counting for the mean and variance relationship by mod-eling the original count data directly often has added benefits [20,22,23]. Therefore, extending our method to model and impute the count data from scRNAseq directly while properly accounting for the over-dispersion or drop-out events will likely improve imputation accuracy further, especially for data with lower per-cell read depth such as those collected from the 10x genomics platform. In addition, for study designs, whether the bulk tissue se-quencing and scRNAseq are applied to same cell content, incorporating bulk data as prior information for imput-ation of scRNAseq data will likely further improve accur-acy. Exploring and benchmarking this strategy will also be a promising direction.
Additional files
Additional file 1:Details of modeling for the dropout event adjustment and method comparison to scImpute. (PDF 200 kb)
Additional file 2:Additional figures for performance evalution of VIPER. (PDF 13470 kb)
Additional file 3:Tables S1andS2. Percentage of zero values in the downsampling experiments and computating time comparisons. (PDF 150 kb)
Funding
This work was supported by the National Institutes of Health (NIH) grants R01GM126553 and R01HG009124 and the National Science Foundation (NSF) grant DMS1712933 and a funding from the Michigan Center for Single-Cell Gen-omic Data Analytics—a part of the Michigan Institute for Data Science (MIDAS).
Availability of data and materials
VIPER is an open-source C++/R package that is freely available on GitHub [46]https://github.com/ChenMengjie/VIPERunder the MIT license. Source code for the release used in the paper has been placed into a DOI-assigning repository [47] (https://doi.org/10.5281/zenodo.1403919). The detailed list of data sets used in the present study is described in the“Materials and methods”section. The code to reproduce all the analyses presented in the paper are available on GitHub [48] (https://github.com/ChenMengjie/Vpa-per2018) and deposited on Zenodo [49] (https://doi.org/10.5281/ zenodo.1403921).
Authors’contributions
MC and XZ conceived the idea, developed the method, and designed the experiments. MC implemented the software and performed the analyses. MC and XZ wrote the paper. Both authors read and approved the final manuscript.
Ethics approval and consent to participate
No ethnical approval was required for this study. All utilized public data sets were generated by other organizations that obtained ethical approval.
Consent for publication Not applicable.
Competing interests
The authors declare that they have no competing interests.
Publisher’s Note
Springer Nature remains neutral with regard to jurisdictional claims in published maps and institutional affiliations.
Author details 1
Department of Medicine, University of Chicago, Chicago, IL 60637, USA. 2Department of Human Genetics, University of Chicago, Chicago, IL 60637,
USA.3Department of Biostatistics, University of Michigan, Ann Arbor, MI 48109, USA.4Center for Statistical Genetics, University of Michigan, Ann Arbor, MI 48109, USA.
Received: 17 March 2018 Accepted: 30 October 2018
References
1. Gierahn TM, Wadsworth MH 2nd, Hughes TK, Bryson BD, Butler A, Satija R, Fortune S, Love JC, Shalek AK. Seq-Well: portable, low-cost RNA sequencing of single cells at high throughput. Nat Methods. 2017;14:395–8.
2. Jaitin DA, Kenigsberg E, Keren-Shaul H, Elefant N, Paul F, Zaretsky I, Mildner A, Cohen N, Jung S, Tanay A, Amit I. Massively parallel single-cell RNA-seq for marker-free decomposition of tissues into cell types. Science. 2014;343:776–9. 3. Klein AM, Mazutis L, Akartuna I, Tallapragada N, Veres A, Li V, Peshkin L,
Weitz DA, Kirschner MW. Droplet barcoding for single-cell transcriptomics applied to embryonic stem cells. Cell. 2015;161:1187–201.
4. Macosko EZ, Basu A, Satija R, Nemesh J, Shekhar K, Goldman M, Tirosh I, Bialas AR, Kamitaki N, Martersteck EM, et al. Highly parallel genome-wide expression profiling of individual cells using nanoliter droplets. Cell. 2015; 161:1202–14.
5. Zheng GX, Terry JM, Belgrader P, Ryvkin P, Bent ZW, Wilson R, Ziraldo SB, Wheeler TD, McDermott GP, Zhu J, et al. Massively parallel digital transcriptional profiling of single cells. Nat Commun. 2017;8:14049. 6. Usoskin D, Furlan A, Islam S, Abdo H, Lonnerberg P, Lou D, Hjerling-Leffler J,
Haeggstrom J, Kharchenko O, Kharchenko PV, et al. Unbiased classification of sensory neuron types by large-scale single-cell RNA sequencing. Nat Neurosci. 2015;18:145–53.
mouse cortex and hippocampus revealed by single-cell RNA-seq. Science. 2015;347:1138–42.
8. Treutlein B, Brownfield DG, Wu AR, Neff NF, Mantalas GL, Espinoza FH, Desai TJ, Krasnow MA, Quake SR. Reconstructing lineage hierarchies of the distal lung epithelium using single-cell RNA-seq. Nature. 2014;509:371–5. 9. Tang F, Barbacioru C, Bao S, Lee C, Nordman E, Wang X, Lao K, Surani MA.
Tracing the derivation of embryonic stem cells from the inner cell mass by single-cell RNA-Seq analysis. Cell Stem Cell. 2010;6:468–78.
10. Durruthy-Durruthy R, Gottlieb A, Hartman BH, Waldhaus J, Laske RD, Altman R, Heller S. Reconstruction of the mouse otocyst and early neuroblast lineage at single-cell resolution. Cell. 2014;157:964–78.
11. Xue Z, Huang K, Cai C, Cai L, Jiang CY, Feng Y, Liu Z, Zeng Q, Cheng L, Sun YE, et al. Genetic programs in human and mouse early embryos revealed by single-cell RNA sequencing. Nature. 2013;500:593–7.
12. Trapnell C, Cacchiarelli D, Grimsby J, Pokharel P, Li S, Morse M, Lennon NJ, Livak KJ, Mikkelsen TS, Rinn JL. The dynamics and regulators of cell fate decisions are revealed by pseudotemporal ordering of single cells. Nat Biotechnol. 2014;32:381–6.
13. Achim K, Pettit JB, Saraiva LR, Gavriouchkina D, Larsson T, Arendt D, Marioni JC. High-throughput spatial mapping of single-cell RNA-seq data to tissue of origin. Nat Biotechnol. 2015;33:503–9.
14. Satija R, Farrell JA, Gennert D, Schier AF, Regev A. Spatial reconstruction of single-cell gene expression data. Nat Biotechnol. 2015;33:495–502. 15. Shalek AK, Satija R, Shuga J, Trombetta JJ, Gennert D, Lu DN, Chen PL,
Gertner RS, Gaublomme JT, Yosef N, et al. Single-cell RNA-seq reveals dynamic paracrine control of cellular variation. Nature. 2014;510:363–9. 16. Kim KT, Lee HW, Lee HO, Kim SC, Seo YJ, Chung W, Eum HH, Nam DH, Kim
J, Joo KM, Park WY. Single-cell mRNA sequencing identifies subclonal heterogeneity in anti-cancer drug responses of lung adenocarcinoma cells. Genome Biol. 2015;16:127.
17. Lee MC, Lopez-Diaz FJ, Khan SY, Tariq MA, Dayn Y, Vaske CJ, Radenbaugh AJ, Kim HJ, Emerson BM, Pourmand N. Single-cell analyses of transcriptional heterogeneity during drug tolerance transition in cancer cells by RNA sequencing. Proc Natl Acad Sci U S A. 2014;111:E4726–35.
18. Borel C, Ferreira PG, Santoni F, Delaneau O, Fort A, Popadin KY, Garieri M, Falconnet E, Ribaux P, Guipponi M, et al. Biased allelic expression in human primary fibroblast single cells. Am J Hum Genet. 2015;96:70–80.
19. Deng Q, Ramskold D, Reinius B, Sandberg R. Single-cell RNA-seq reveals dynamic, random monoallelic gene expression in mammalian cells. Science. 2014;343:193–6.
20. Kharchenko PV, Silberstein L, Scadden DT. Bayesian approach to single-cell differential expression analysis. Nat Methods. 2014;11:740–U184.
21. Lun AT, Bach K, Marioni JC. Pooling across cells to normalize single-cell RNA sequencing data with many zero counts. Genome Biol. 2016;17:75. 22. Vallejos CA, Marioni JC, Richardson S. BASiCS: Bayesian analysis of single-cell
sequencing data. PLoS Comput Biol. 2015;11:e1004333.
23. Ziegenhain C, Vieth B, Parekh S, Reinius B, Guillaumet-Adkins A, Smets M, Leonhardt H, Heyn H, Hellmann I, Enard W. Comparative analysis of single-cell RNA sequencing methods. Mol Cell. 2017;65:631–43 e634.
24. Huang M, Wang J, Torre E, Dueck H, Shaffer S, Bonasio R, Murray JI, Raj A, Li M, Zhang NR. SAVER: gene expression recovery for single-cell RNA sequencing. Nat Methods. 2018;15:539–42.
25. van Dijk D, Sharma R, Nainys J, Yim K, Kathail P, Carr AJ, Burdziak C, Moon KR, Chaffer CL, Pattabiraman D, et al. Recovering gene interactions from single-cell data using data diffusion. Cell. 2018;174:716–29 e727. 26. Li WV, Li JJ. An accurate and robust imputation method scImpute for
single-cell RNA-seq data. Nat Commun. 2018;9:997.
27. Gong W, Kwak IY, Pota P, Koyano-Nakagawa N, Garry DJ. DrImpute: imputing dropout events in single cell RNA sequencing data. BMC Bioinformatics. 2018;19:220.
28. Pierson E, Yau C. ZIFA: dimensionality reduction for zero-inflated single-cell gene expression analysis. Genome Biol. 2015;16:241.
29. Fan J, Salathia N, Liu R, Kaeser GE, Yung YC, Herman JL, Kaper F, Fan JB, Zhang K, Chun J, Kharchenko PV. Characterizing transcriptional heterogeneity through pathway and gene set overdispersion analysis. Nat Methods. 2016;13:241–4. 30. Risso D, Perraudeau F, Gribkova S, Dudoit S, Vert JP. A general and flexible method
for signal extraction from single-cell RNA-seq data. Nat Commun. 2018;9:284. 31. Slawski M, Hein M. Sparse recovery by thresholded non-negative least
squares. In: Proceedings of NIPS; 2011.
32. Goldfarb D, Idnani A. A numerically stable dual method for solving strictly convex quadratic programs. Math Program. 1983;27:1–33.
33. Rubin DB. Multiple imputation after 18+ years. J Am Stat Assoc. 1996;91:473–89. 34. Grun D, Kester L, van Oudenaarden A. Validation of noise models for
single-cell transcriptomics. Nat Methods. 2014;11:637–40.
35. Chu LF, Leng N, Zhang J, Hou Z, Mamott D, Vereide DT, Choi J, Kendziorski C, Stewart R, Thomson JA. Single-cell RNA-seq reveals novel regulators of human embryonic stem cell differentiation to definitive endoderm. Genome Biol. 2016;17:173.
36. Love MI, Huber W, Anders S. Moderated estimation of fold change and dispersion for RNA-seq data with DESeq2. Genome Biol. 2014;15:550. 37. Robinson MD, McCarthy DJ, Smyth GK. edgeR: a Bioconductor package for
differential expression analysis of digital gene expression data. Bioinformatics. 2010;26:139–40.
38. Soneson C, Robinson MD. Bias, robustness and scalability in single-cell differential expression analysis. Nat Methods. 2018;15:255–61. 39. Lund SP, Nettleton D, McCarthy DJ, Smyth GK. Detecting differential
expression in RNA-sequence data using quasi-likelihood with shrunken dispersion estimates. Stat Appl Genet Mol Biol. 2012;11(5).
40. Robinson MD, Oshlack A. A scaling normalization method for differential expression analysis of RNA-seq data. Genome Biol. 2010;11:R25. 41. Finak G, McDavid A, Yajima M, Deng J, Gersuk V, Shalek AK, Slichter CK,
Miller HW, McElrath MJ, Prlic M, et al. MAST: a flexible statistical framework for assessing transcriptional changes and characterizing heterogeneity in single-cell RNA sequencing data. Genome Biol. 2015;16:278.
42. Lea AJ, Tung J, Zhou X. A flexible, efficient binomial mixed model for identifying differential DNA methylation in bisulfite sequencing data. PLoS Genet. 2015;11:e1005650.
43. Sun S, Hood M, Scott L, Peng Q, Mukherjee S, Tung J, Zhou X. Differential expression analysis for RNAseq using Poisson mixed models. Nucleic Acids Res. 2017;45:e106.
44. Sun S, Zhu J, Mozaffari S, Ober C, Chen M, Zhou X. Heritability estimation and differential analysis of count data with generalized linear mixed models in genomic sequencing studies. Bioinformatics. 2018; in press.
45. Chen M, Zhou X. Controlling for confounding effects in single cell RNA sequencing studies using both control and target genes. Sci Rep. 2017;7:13587. 46. Chen M, Zhou X: VIPER: variability-preserving imputation for accurate
gene expression recovery in single-cell RNA sequencing studies. Source Code Github Repository; 2018,https://github.com/ChenMengjie/VIPER. Accessed 30 Aug 2018.
47. Chen M, Zhou X: VIPER: variability-preserving imputation for accurate gene expression recovery in single-cell RNA sequencing studies. Source Code DOI; 2018,https://doi.org/10.5281/zenodo.1403919. Accessed 30 Aug 2018. 48. Chen M, Zhou X: VIPER: variability-preserving imputation for accurate
gene expression recovery in single-cell RNA sequencing studies. Code Github Repository; 2018,https://github.com/ChenMengjie/Vpaper2018. Accessed 30 Aug 2018.