R E S E A R C H
Open Access
Genomic analyses of an extensive
collection of wild and cultivated
accessions provide new insights into
peach breeding history
Yong Li
1,3, Ke Cao
1, Gengrui Zhu
1, Weichao Fang
1, Changwen Chen
1, Xinwei Wang
1, Pei Zhao
1, Jian Guo
1,
Tiyu Ding
1, Liping Guan
1, Qian Zhang
1, Wenwu Guo
3, Zhangjun Fei
2and Lirong Wang
1*Abstract
Background:Human selection has a long history of transforming crop genomes. Peach (Prunus persica) has undergone more than 5000 years of domestication that led to remarkable changes in a series of agronomically important traits, but genetic bases underlying these changes and the effects of artificial selection on genomic diversity are not well understood.
Results:Here, we report a comprehensive analysis of peach evolution based on genome sequences of 480 wild and cultivated accessions. By focusing on a set of quantitative trait loci (QTLs), we provide evidence supporting that distinct phases of domestication and improvement have led to an increase in fruit size and taste and extended its geographic distribution. Fruit size was predominantly selected during domestication, and selection for large fruits has led to the loss of genetic diversity in several fruit weight QTLs. In contrast, fruit taste-related QTLs were successively selected for by domestication and improvement, with more QTLs selected for during improvement. Genome-wide association studies of 11 agronomic traits suggest a set of candidate genes controlling these traits and potential markers for molecular breeding. Candidate loci for genes that contributed to the adaption to low-chill regions were identified. Furthermore, the genomic bases of divergent selection for fruit texture and local breeding for different flavors between Asian and European/North American cultivars were also determined.
Conclusions:Our results elucidate the genetic basis of peach evolution and provide new resources for future genomics-guided peach breeding.
Keywords:Genomics, Whole genome resequencing, Domestication, Improvement, Human selection, Breeding history
Background
Global food production and crop quality have been transformed over the last 10,000 years through domesti-cation and extensive selection [1]. However, crop breed-ing still relies heavily on experience and manual observation, which are both limiting in terms of effi-ciency and time-consuming, especially for perennial fruit crops with long juvenile phases. Recently developed
next-generation DNA sequencing technologies allow the tracking of genome-wide selection signatures and can be used to develop strategies for further crop improvement, as recently reported in rice (Oryza sativa) [2], maize (Zea mays) [3], cucumber (Cucumis sativus) [4], tomato (Solanum lycopersicum) [5], soybean (Glycine max) [6], peach (Prunus persica) [7], and apple (Malus domestica) [8]. Genome-wide association studies (GWAS) have been performed to identify loci or genes associated with important agronomic traits in a range of species [2,5–8] and to facilitate targeted and precise genetic selection, in-volving marker-assisted selection (MAS) and molecular * Correspondence:wanglirong@caas.cn
1Zhengzhou Fruit Research Institute, Chinese Academy of Agricultural
Sciences, Zhengzhou, China
Full list of author information is available at the end of the article
design breeding. MAS has been applied to woody perennial crops as well as annual crops, where it has accelerated breeding programs through early identification of fruit-re-lated traits at the seedling or juvenile phases [9,10].
Fruits represent an important component of the diet of humans and other animals. Peach (Prunus persica L.) is one of the most economically important fruit crops in temperate regions, with a global yield of 25.0 million tons in 2016 and a net value of over $12.4 billion in 2014 (FAOSTAT; http://faostat.fao.org). Peach is also considered to be a model system for molecular biology researches in the Rosaceae family and represents one of the fruit species most consumed worldwide. Following domestication in China, approximately 5000 years ago, peach has undergone a long period of selection by native farmers, and in recent decades, specific target-guided breeding has led to a remarkable increase in fruit quality. However, the selection signatures at the molecular level associated with domestication and improvement remain largely unclear. Understanding the genetic basis of selec-tion is important for precise molecular breeding and for eliminating undesired costs, such as linkage drag during wild introgressions [5]. Although previous studies have attempted to address this issue, small population sizes and underrepresentation of the accessions in the germ-plasm collection limited the findings [7,11].
To explore this question more comprehensively, we sequenced the genomes of a large peach collection, con-sisting of 480 diverse accessions from around the world, including 52 wild relatives, 213 landraces, and 215 im-proved cultivars (Fig. 1a, Additional file 1: Table S1). Among the improved cultivars, 126 were collected from eastern countries (Asia) and 89 were from western coun-tries (North America and Europe). Using these sequen-cing data, here we elucidate the breeding history of peach by identifying loci and genes associated with im-portant agronomic traits that have been under selection during domestication and improvement. Our data indi-cate that fruit size was mainly selected during domesti-cation, while fruit taste was successively selected during both domestication and improvement. Our results pro-vide a new resource for further molecular breeding and studies of peach biology.
Results and discussion
A high-density peach genomic variation map
Through sequencing of 480 peach accessions (Fig. 1a), we generated a total of 719 Gb base pairs of sequences, with an average depth of 6.4× and a coverage of 93.5% for each accession (Additional file 1: Table S1). Pair-end reads were mapped against the peach reference genome [12] (release version 2.0), and a final set of 4,980,259 high-quality single nucleotide polymorphisms (SNPs) were identified, resulting in an average of 21.9 SNPs per
kilobase (Additional file 2: Tables S2 and S3,
Additional file3: Figure S1). A total of 886,033 SNPs were located in coding regions, including 457,988 nonsynon-ymous and 430,034 synonnonsynon-ymous SNPs (Additional file2: Table S3). We also found 8812 SNPs in 5724 genes that were predicted to have significant effects on gene func-tions, including 5784 nonsense SNPs in 4480 genes that resulted in start codon changes, the introduction of premature stop codons, or the production of elongated transcripts. The accuracies of original SNPs and SNPs fol-lowing imputation were estimated to be 96.1% and 96.3%, respectively, based on genotyping using the Sequenom MassARRAY platform for 30 SNPs in 258 accessions (Additional file 1: Tables S1, Additional file2: Table S4). In addition, we identified 1,026,375 small insertions and deletions (INDELs) (< 5 bp) and 159,330 large structural variations (SVs) (Additional file3: Figure S1, Additional file2: Table S2).
The high-density SNP data enabled GWAS analysis of seven agronomic traits: flesh color (white/yellow), fruit hairiness (peach/nectarine), fruit shape (round/flat), fruit texture (melting/non-melting), flesh adhesion (adhesion/ freestone), pollen fertility (male sterility/fertility), and fruit skin color (red/non-red) (Additional file3: Figure S2), in addition to the four (fruit weight, total phenolic content, fruit soluble solid content, and chilling requirement) that were described separately in the following sections. For quantitative traits, we identified a total of 20 novel quantitative trait loci (QTLs) using GWAS. For qualitative traits, the association signals were close to, or included, known loci or genes that have been identified previ-ously using studies of recombinant populations [13–17] (Additional file 3: Figure S2, Additional file 2: Table S5). Specifically, these associations included a SNP (Pp01, 27,005,584 bp) located 392 kb from thePpCCD4gene for flesh color [13], a SNP (Pp06, 26,288,291 bp) within theS region for fruit shape [14], a SNP (Pp05, 16,633,286 bp) located 671 kb from PpMYB25 for fruit hairiness [15], a SNP (Pp04, 19,909,362) located 860 kb from PpendoPG for fruit texture [16], a SNP (Pp06, 2,014,933) within the Psregion for male sterility [14], a SNP (Pp06, 19,070,801) located 11 kb fromPpendoPGfor flesh adhesion [16], and a SNP (Pp03, 18,103,021) within the skc region for fruit skin color [17] (Additional file1: Table S5). We also car-ried out GWAS of these seven traits using genome-wide SVs and found that these results were highly consistent with those using the SNPs. Additionally, some candidate causative SVs were identified (Additional file2: Table S5, Additional file 3: Figure S2), such as a 70.5-kb deletion associated with a non-melting phenotype in a gene cluster
encoding endopolygalacturonase on chromosome 4
breeding for these seven commercially important fruit-related traits.
Peach population structure and domestication bottleneck To understand the genetic relationships among acces-sions, we constructed a neighbor-joining phylogenetic tree and performed a principal component analysis (PCA) using the 4,980,259 SNPs. The results of neighbor-joining tree and PCA largely supported the classification of the peach accessions into three major groups (Fig.1b–e; Additional file3: Figure S4). Group I included all wild relatives (wild group), while groups II and III were biased towards landraces (landrace group)
and improved cultivars (improved group), respectively (Fig. 1a, b; Additional file 3: Figure S4). The domesti-cated accessions, including landraces and improved cul-tivars, formed a monophyletic lineage, indicating that all currently grown cultivated peach accessions originated from a single domestication event (Fig. 1b). Group II was further classified into three subclades, which showed strong geographic distribution patterns (Fig. 1a, b; Additional file 1: Table S1). Group II-1 contained orna-mental accessions and landraces from northeastern and southern China. Group II-2 mainly consisted of land-races from the middle and lower reaches of the Yangtze river (Yangtze regions) and Yungui Plateau. Group II-3 Fig. 1Phylogeny and population genetics of domesticated and wild peaches.aGeographic distribution of the 480 peach accessions, each of which is represented by a dot on the world map.bThe neighbor-joining phylogenetic tree of 480 peach accessions constructed based on 4.98 million SNPs.c–ePCA plots of peach accessions. Six subgroups are indicated by different colors indicated at the bottom of each figure. The domesticated group includes the landraces and improved cultivars. The improved cultivars include the accessions from eastern and western countries.fSummary of nucleotide diversity (π) and population divergence (FST) across the four groups. Value in each circle represents nucleotide
diversity for the group, and values between pairs indicate population divergence (FST).“Western”and“Eastern”indicated improved cultivars from
[image:3.595.57.541.87.482.2]mainly included landraces from northwestern and north-ern China. Similarly, accessions from group III were fur-ther clustered into two subclades, designated as the eastern improved (group III-1) and the western im-proved subgroups (group III-2), with group III-1 biased towards improved cultivars from Asia and group III-2 biased towards improved cultivars from North America and Europe (Fig.1a, b; Additional file1: Table S1). We interpret this geographic clustering pattern to indicate the introduction and development history of peach do-mestication, spread, and subsequent improvement. We also found that some cultivated peach accessions har-bored admixed ancestry, suggesting that they might have experienced introgression or gene flow during breeding (Additional file3: Figure S5).
The overall nucleotide diversity measured by theπvalue of the 480 accessions was 1.1 × 10⁻³. The wild progenitors of cultivated peach showed a much higher nucleotide di-versity (3.5 × 10⁻³) than landraces (1.2 × 10⁻³), suggesting a narrow domestication bottleneck (πwild/πlandrace= 2.92)
(Fig.1f ), which was different from that reported in a pre-vious study [18]. Nearly two thirds of the genetic diversity have been lost during peach domestication, indicating a major effect of artificial selection on the peach genomes. This pattern of domestication is different from other per-ennial fruit crops, such as grape [19] (Vitis vinifera) and apple [8], which have been reported to lack narrow do-mestication bottlenecks (Additional file 2: Table S6). We further verified the domestication bottleneck (P< 0.001)
using the BOTTLENECK program which detects
reductions in recent effective population size [20] (Additional file 2: Table S7). Moreover, the high genetic differentiation (FST) between wild and domesticated
pea-ches (~ 0.76) (Fig. 1f ), positive mean Tajima’s D values, and slow linkage disequilibrium (LD) decay (half LD decay distance of ~ 35 kb) in domesticated peach are consistent with a narrow domestication bottleneck (Fig.1g). In con-trast, most of the genetic diversity was retained during peach improvement from landraces (1.2 × 10⁻³) to improved cultivars (1.0 × 10⁻³), suggesting a weaker improvement bottleneck (πlandrace/πimprovement= 1.20) in
peach (Fig.1f ).
To better understand the basis of the narrow bottle-neck during domestication, we examined factors that might affect bottleneck intensity, such as effective popu-lation size of founders, length of juvenile phase, mating system, or single versus multiple domestication origins. The effective population size of the founders estimated by the δaδi program [21] was ~ 200 for peach at domestication, which is markedly lower than the corre-sponding estimates in maize [22] (~ 150,000) and rice [23] (~ 1300). Peach typically is self-compatible with a relative short juvenile phase of ~ 3 years, which is shorter than apple (> 5 years) and pear (> 5 years), and
equal to that of grape. Multiple origins of cultivated crops may lead to a mild bottleneck, such as has been reported for grape [24], which contrasts with our previ-ous finding that peach had a single origin and a linear evolutionary route [11]. In addition, the use of grafting promoted the formation of a marked bottleneck as it re-sulted in the propagation of a limited number of highly interesting genotypes. We conclude that the combined effects of these factors resulted in the narrow domestica-tion bottleneck in peach.
We found that eastern (π= 1.1 × 10⁻³) and western improved cultivars (π= 0.9 × 10⁻³) harbored nearly the same low level of genetic diversity, with little genetic dif-ferentiation (FST= 0.08) (Fig. 1f ), suggesting a narrow
genetic background of current cultivated peach varieties. Therefore, trait improvement in peach may be con-strained by the limited genetic diversity in commonly used breeding materials, suggesting the potential benefit of introgressing material from wild relatives in future breeding programs.
Genome-wide selection signatures during domestication and improvement
To identify the potential selection signatures of peach do-mestication and improvement, we screened for genomic regions with a sharp reduction of nucleotide diversity (ROD) between wild and landrace groups (πwild/πlandrace;
domestication) as well as landrace and improved groups (πlandrace/πimprovement; improvement). Consistent with the
narrow domestication bottleneck and weak improvement bottleneck, we observed a significantly higher ROD value during domestication (average πwild/πlandrace= 3.33) than
improvement (average πwild/πlandrace= 1.76) (P< 0.01)
(Fig.2a, f ). The top 5% of the genomic windows or regions with unusually high ROD values in each comparison were defined as selective sweeps. Finally, a total of 142 domesti-cation sweeps and 104 improvement sweeps, covering 11.1% (25.2 Mb) and 9.4% (21.3 Mb) of the assembled gen-ome, harboring 3683 and 3039 genes, respectively, were identified (Fig. 2a, f; Additional file 1: Tables S8-S11). Taken together, we concluded that approximately 18.6% (42.4 Mb) of the peach genome has been shaped by these two selection steps involving domestication from wild rel-atives. Notably, we found that 15.9% (4.1 Mb; 1.8% of the genome) of domestication sweeps, harboring 768 genes, overlapped with improvement sweeps, indicating that a subset of domestication loci may have undergone a second round of artificial selection for continued improvement of important agronomic traits (Additional file2: Table S12).
Fruit size was a major target of selection during domestication
Fig. 2Genome-wide detection and functional annotations of selection sweeps during domestication and improvement.a,fThe genome-wide selective signals associated with domestication (a) and improvement (f). Putative domestication sweeps (a) and improvement sweeps (f) are shown as orange bars above the black dashed horizontal threshold line. Blue arrows in (a) and (f) indicate previously reported QTLs located within the domestication and improvement sweeps. QTL names are listed above the corresponding blue arrows, and QTLs are shown for fruit weight (red), fruit acid (blue), fruit sugar (black), fruit skin color (pink), and total phenolics (green).fw, fruit weight;SSC, soluble solid content;sor, sorbitol content;TS, total sugar content;suc, sucrose content;fru, fructose content;glu, glucose content;TA, titratable acid content;mal, malic acid content;cit, citric acid content;skc, fruit kin color;phe, total levels of phenolic compounds.b,d,eManhattan plots of GWAS association peaks related to fruit weight on chromosomes 2, 6, and 8 that overlapped with domestication sweeps. The gray horizontal dashed lines in each figure indicate the Bonferroni significance threshold of GWAS (P< 3.2 × 10⁻⁸).c,g–iManhattan plot of GWAS association peaks related to fruit SSC on
chromosomes 1, 4, 5, and 6 that overlapped with domestication and improvement sweeps. The black horizontal dashed lines in each figure indicate the Bonferroni significance threshold of GWAS (P< 2.6 × 10⁻⁸).jFruit taste-related QTL hotspots in domestication sweeps.kFruit
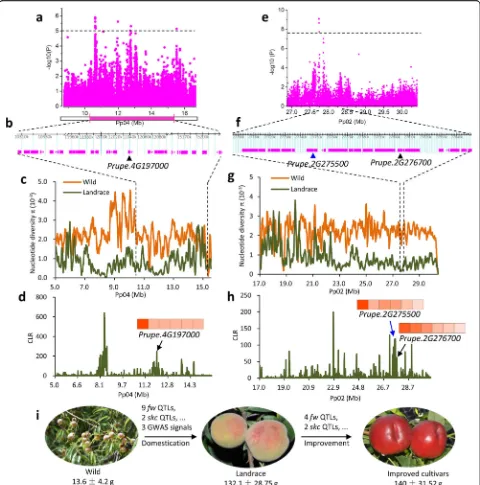
[image:5.595.57.540.86.560.2]increased more than 10 times and undergone two rounds of selection, from 13.6 ± 4.2 g in the wild group to 132.1 ± 28.75 g in landraces and 140 ± 31.52 g in im-proved cultivars (Fig. 3i, Additional file 3: Figure S6). We hypothesized that fruit size may have been the pre-dominant target of selection during domestication, with a mild selection during the subsequent phase of peach improvement. Previous studies have identified multiple quantitative trait loci (QTLs) associated with fruit size (fw) in peach [25–28], but the genetic basis of the in-crease of fruit size during domestication and improve-ment remains largely unknown.
We compared the selective sweeps with the locations of known QTLs. A total of nine knownfwQTLs on chromo-somes 1, 4, 6, and 8 fell within domestication sweeps, in-cluding a stable QTL on chromosome 4, identified in a multi-year mapping experiment [28] (Fig. 2a). Selections for these nine QTLs likely contributed to the enlargement of peach fruit size during the evolutionary transition from wild to landrace accessions (Fig. 3i). For instance, the stablefwQTL on chromosome 4 (10.3–15.2 Mb) showed sharp ROD and high composite likelihood ratio (CLR) values corresponding to a strong domestication sweep (Fig. 3a, c, d). Moreover, a SNP associated with fruit weight (P= 7.5 × 10⁻⁷) within this QTL was also identified in the GWAS analysis (see below; Fig. 3a). Within this QTL, we found one gene (Prupe.4G197000) encoding a putative auxin-responsive GH3-like protein (Fig. 3b), which showed high expression at the early stage of fruit development (Fig. 3d). Notably, a homolog of this gene has been proposed as a candidate for the increase in fruit mass during tomato domestication [5]. Compared with domestication sweeps, only four fw QTLs, located on chromosomes 4, 5, and 6, overlapped with improvement sweeps (Fig. 2f ), which may explain the relatively small increase in fruit size during improvement (Fig. 3i, Additional file3: Figure S6). Collectively, the difference in the number of fw QTLs associated with the domesti-cation and improvement sweeps (Fig. 2a, f ) suggests a stronger selection for fruit size during domestication than improvement.
To further track the selection for fruit size during the two selection steps, we performed GWAS analysis of fruit weight (Additional file3: Figure S7). A total of eight association peaks, on chromosomes 1, 2, 3, 4, 6, 7, and 8 (P< 3.2 × 10⁻⁸
), were identified, of which three overlapped with known QTLs and five were new (Additional file 2: Table S13, Additional file3: Figure S7). Among the associ-ation peaks, three (chromosomes 2, 6, and 8) overlapped with domestication sweeps, while no peak was found in the improvement sweeps (Fig. 2a, b, d, e). Specifically, we detected 52 SNPs significantly associated with fruit weight, of which 26 underwent selection during domestication, while only two showed selection signals
during improvement (Additional file 2: Table S13). This finding is congruent with stronger selection for fruit size during domestication than improvement. Notably, we found a strong association on chromosome 2 overlapping with a domestication sweep, supported by high ROD and CLR values (Fig.3e, g, h). Two candidate genes within this region, Prupe.2G275500and Prupe.2G276700, are related to cell division, with high expression at the cell division stage of fruit development (20 days after full bloom) (Fig. 3f, h). The latter encodes a PLAC 8 family protein and is homologous tofw2.2from tomato, which controls fruit size through regulating the cell number [29] (Fig.3f ). Selection on this QTL may contribute to the increase in fruit size during domestication and have resulted in ex-tremely low genetic diversity of a nearly 10-Mb region on the bottom of chromosome 2 (Fig.3g, h) (π= 0.573 × 10⁻³ in the region versus 1.2 × 10⁻³ in the whole genome), reflecting hitchhiking effects (LD decay was ~ 90 kb in this region versus ~ 35 kb in the whole genome) (Additional file 3: Figure S8).
Loss of bitterness and improvement in fruit taste during domestication and improvement
Fruit taste is another important target for artificial selec-tion in fruit crops. Wild peaches taste bitter, landraces less so, while improved cultivars have no bitterness and a high sugar content, suggesting that fruit taste was suc-cessively selected for during both domestication and im-provement. Fruit taste is mainly related to sugar content, acid content, and the balance between them. Significant changes in the content of these carbohydrates during peach evolution have been observed [30] (Additional file3: Figures S6 and S9) and, accordingly, a series of fruit sugar-and acid-related QTLs [25–28, 31, 32] were found to be
co-located with domestication and/or improvement
sweeps (Fig. 2a, f ). Moreover, some of these QTLs were situated in genomic regions that have undergone two rounds of selection (Additional file2: Table S12), further suggesting successive selection for fruit taste during domestication and subsequent improvement.
Fig. 3Evolution of fruit size during domestication and improvement in peach.a–dSelection on thefwQTL on chromosome 4 during peach domestication.aRegional Manhattan plot of GWAS for fruit size and the corresponding co-located QTL related to fruit size on chromosome 4. Although no signal exceeded the Bonferroni significance threshold of GWAS (P< 3.2 × 10⁻⁸), a secondary GWAS signal was identified (P< 1× 10⁻⁵).
bGene models in the fruit size related QTL on chromosome 4. The candidate gene,Prupe.4G197000, is labeled with a black triangle.cNucleotide diversity (π) of the interval of the fruit size related QTL.dCLR value of the interval of the fruit size related QTL. A heat map of the expression level of Prupe.4G197000during different stages of fruit development (20, 40, 60, 80, 100, and 120 days after bloom from left to right) is shown.e–hSelection on the fruit weight GWAS signal on chromosome 2 during domestication.eRegional Manhattan plot of GWAS for fruit size on bottom of chromosome 2. The gray horizontal dashed line indicates the Bonferroni significance threshold of GWAS (P< 3.2 × 10⁻⁸).fGene models in the fruit
[image:7.595.58.538.88.573.2]thepheQTL on chromosome 2 (Fig.4a; Additional file3: Figure S10). Moreover, the most significant signal (P= 4.31 × 10⁻¹⁰) in this association peak showed consid-erable differentiation between wild and landrace acces-sions (FST= 0.98) and was almost fixed in landraces
(98.5%), suggesting that the genotype conferring bitter fruit was swept during domestication, consistent with the phenotype.
We also identified 31 QTLs within the improvement sweeps that may have contributed to the second-round improvement of fruit taste (Fig. 2f ). One of these, Prupe.4G037800, encoding a sugar transporter within a suc QTL [26], overlapped with the GWAS signal of fruit soluble solid content (SSC) on chromosome 4 (Fig.2c, f ). This gene was differentially expressed during fruit development with high expression at the mature stage Fig. 4Selective sweeps underlying the changes in fruit taste during domestication and improvement.a–dSelection on thepheQTL during peach domestication.aRegional Manhattan plot of an association peak for levels of total phenolic compounds on chromosome 2. The gray horizontal dashed line indicates the Bonferroni significance threshold of GWAS (P< 6.5 × 10⁻⁸). Previous reportedpheQTL is highlighted under the Manhattan plot. The selective signals on the genomic regions harboring thepheQTL are supported by sharp ROD (b), high CLR (c), and high FST(d).e–hSelection on aSSCQTL on chromosome 4 during domestication.eRegional Manhattan plot of an association peak for SSC. The gray
horizontal dashed line indicates the Bonferroni significance threshold of GWAS (P< 2.6 × 10⁻⁸). Previous reportedSSCQTL is highlighted. The selective signals on the genomic regions harboringSSCQTL are supported by sharp ROD (f), high CLR (g), and highFST(h). A heat map of the
[image:8.595.58.540.86.500.2](Additional file3: Figure S11), suggesting its contributions to the increase of fruit taste during improvement. Notably, we found that the improvement sweeps were associated with a greater number of sugar-related QTLs (22 QTLs) than the domestication sweeps (18 QTLs) (Fig.2a, f ), sug-gesting more specific breeding for better taste and high sweetness in improvement than in domestication. In con-trast, more fruit acid-related QTLs (8) were found in the domestication sweeps than in the improvement sweeps (4) (Fig.2a, f ), indicating a selection for reduced fruit acid-ity during domestication, which is typical of domesticated peach (Additional file3: Figure S9).
To further characterize the selection for fruit taste, we performed GWAS analysis of SSC (Additional file 3: Figure S7). A total of 35 association SNPs and 10 associ-ation peaks were identified (P< 2.6 × 10⁻⁸), of which three overlapped with known QTLs and seven were novel (Additional file 2: Table S13, Additional file 3: Figure S7). Among the association peaks, one on chromosome 4 fell within the domestication sweeps and four (chromosomes 1, 4, 5, and 6) were located within the improvement sweeps (Fig. 2a, c, f–i). Moreover, many more SSC associations were identified in the im-provement sweeps than in the domestication sweeps, consistent with stronger selection for fruit taste during improvement than domestication.
The GWAS signal on chromosome 4 co-located with a previously reported SSC QTL [28] (Fig.4e) and the gen-omic region harboring this QTL showed a strong do-mestication signal, supported by a sharp ROD value, a high CLR value, and a high FST between wild and
land-race accessions (Fig.4f–h). Through combining the tran-scriptome and biochemical analyses, we identified a candidate gene, Prupe.4G150100, for SSC within this QTL (Fig. 4g, Additional file 3: Figure S12). This gene, encoding a putative nine-cis-epoxycarotenoid dioxygen-ase 3 protein (NCED3) and involved in the abscisic acid (ABA) signaling pathway that play essential roles in fruit ripening [34], showed a large increase in expression at the ripening stage (~ 200 times), and its expression profiles during fruit development were strongly
corre-lated with both SSC and ABA contents (Fig. 4g,
Additional file 3: Figure S12). We found that the gen-omic region of the NCED3 gene showed very low nu-cleotide diversity in the landrace group (π= 0.688 × 10⁻³ in this region versus 1.2 × 10⁻³in the whole genome), and that the selection for high SSC was likely resulted from the hitchhiking of an approximately 5-Mb genomic region (LD decay was ~ 150 kb in this region versus ~ 35 kb in the whole genome) (Fig.4f ) (Additional file3: Figure S12). Another strong SSC association was identified on the top of chromosome 5, located within the overlap betweenSSC and suc QTLs [28] (Fig. 4i). The high ROD and CLR values from the comparison of landraces and improved
cultivars suggested a strong improvement signal in this QTL (Fig. 4j, k). Moreover, an extremely high FSTvalue of the
9-Mb region at the top of chromosome 5 further supported a strong selection for this QTL during improvement (Fig.4l). We found that QTL hotspots [35] related to fruit taste differed in the domestication and improvement phases and were located on chromosome 4 (7.5–13.0 Mb) (Fig. 2j) and 5 (1.5–4.5 Mb) (Fig. 2k), respectively. We also observed that 11 scattered QTLs were shared by domestication and improvement sweeps (Fig. 2a, f ). In addition, two QTLs [17, 32] and one GWAS signal re-lated to fruit skin color (skc) fell within both the domestication and improvement sweeps, suggesting a successive selection for fruit appearance during the two selection steps (Fig.2a, f and Fig.3i).
Selected regions relevant to low chilling requirement breeding
In addition to fruit size and taste, selection for low chill-ing requirement (CR) is a unique breedchill-ing objective for peach, and contributes to extension of the harvest sea-son and adaptation to low-chill zones. Moreover, global warming has already led to a significant decrease in win-ter chill, encouraging breeders to select low CR cultivars that are likely to perform well in future climates [36]. The continuing efforts by breeders to select for lower CR have changed the pattern of CR distribution, as evi-denced by the fact that 90% of peach cultivars required more than 800 chilling hours to break dormancy 60 years ago, whereas now only 20% of cultivars require this much chilling [37]. Although a few previous studies have identified multiple QTLs associated with peach CR [38, 39], the genome-wide genetic basis underlying low CR breeding has not yet been determined. To address this, we performed GWAS for CR (Additional file3: Figure S13) and identified seven association peaks, located on chromo-somes 1, 3, 7, and 8 (−log(P) > 7.59) (Fig.5a, Additional file2: Table S14). Of these, three were within or close to previ-ously reported CR QTLs [38, 39], while the other four were new (Fig. 5a, b, f ). Notably, the strong association peak (P= 3.14 × 10⁻¹⁴) on chromosome 1 overlapped with a known major CR QTL (qCR1a) that explained up to 44.8% of the phenotypic variance [38] (Fig. 5a, b). More-over, this strong association co-localized with the EVG locus underlying theevergrowingpeach dormancy mutation (evg) [40, 41] (Fig. 5b). Six tandemly arranged Dormancy
Associated MADS-box transcription factors (DAM1-6;
Prupe.1G531100,Prupe.1G531300,Prupe.1G531400,Prupe.
1G531500, Prupe.1G531600, Prupe.1G531700) have been
identified inqCR1a, with a 41.7-kb deletion spanning all or part of DAM1-4, conferring a non-dormancy (or CR = 0) phenotype inevgpeach [41].
high ROD and CLR values, using a 5% cutoff (Additional file 1: Table S15). Two association peaks from the CR GWAS that overlapped with previously re-ported QTLs [40, 41] on chromosomes 1 and 8 fell within the selection targets (Fig. 5c, d, g, h), suggesting that these two QTLs may underlie the signatures of breeding for low CR cultivars. High FST values further
supported the selection for these QTLs (Fig. 5e, i). Fur-thermore, we also obtained strong association signals within these two QTLs on chromosomes 1 and 8 by
performing another GWAS through classification of ac-cessions into low CR and non-low CR (Additional file3: Figure S14, Additional file 1: Table S16). Selection for these two QTLs could have contributed to the extension of a suitable planting area for peach to low-altitude
zones. A total of seven SHORT VEGETATIVE PHASE
(SVP) subfamily genes related to flowering time was identified within these two QTLs, including the six DAMgenes in theEVGlocus and one (Prupe.8G069300) in qCR8 on chromosome 8. Interestingly, the CR QTL Fig. 5Selection targets for low CR breeding.aManhattan plot of GWAS for CR. The gray horizontal dashed line indicates the Bonferroni
significance threshold of GWAS (P< 4.1 × 10⁻⁸).bPhysical location of CR QTL and the
EVGlocus on chromosome 1. The green and orange rectangles represent CR QTL and theEVGlocus, respectively.c–dDistribution of ROD (c) and CLR (d) values across chromosome 1 using 100-kb non-overlapping sliding windows. The CR QTLs are pointed by black arrows.eDistribution ofFSTvalues between landrace and low CR improved
cultivars in theqCR1genomic region. The black horizontal dashed line indicates the top 5% of genomic regions with highestFST.fPhysical
location of the CR QTL on chromosome 8. The green rectangle represents previous CR QTL.g–hDistribution of ROD (g) and CLR (h) values across chromosome 8 using 100-kb non-overlapping sliding windows. The CR QTLs are pointed by black arrows.iDistribution ofFSTvalues
[image:10.595.61.538.86.479.2]on chromosome 1 also harbored the loci associated with bloom date and heat requirement [38]. Moreover, over-expression of peach SVP gene (Prupe.8G069300) within the interval of the GWAS signal on chromosome 8 in a model plant,Arabidopsis thaliana, led to the strong vege-tative growth and delayed flowering time (Additional file3: Figure S15), providing strong evidence for candidate genes for CR in peach. These results will be valuable for the de-velopment of markers for low CR breeding and the identi-fication of genes responsible for the CR. A PCR-based marker with an accuracy of 92.2% has been developed for low CR peach identification (Additional file3: Figure S16).
Divergent selection and local breeding
Fruit texture is an important agronomic trait for peach that is directly related to mouth-feel, transportation tol-erance, and processing quality. We found that fruit tex-ture showed geographic distribution patterns, with all wild accessions showing a melting fruit texture, while landraces and improved cultivars have both melting and non-melting phenotypes. Most of the landraces from northeastern and southern China, as well as the middle and lower reaches of the Yangtse river, showed a melting fruit texture, while most of the landraces harboring a non-melting phenotype were from northwestern China, the Yungui Plateau, and the northern Plain of China. Western and eastern improved cultivars showed both melting and non-melting fruit textures. We therefore concluded that genes underlying fruit texture underwent divergent selection during geographic differentiation or local breeding. Using GWAS, we identified a 70.5-kb SV (Pp04: 19,026,186) associated with fruit texture within the previously mapped FT locus [14, 16] (Fig. 6a, Additional file 3: Figure S2 and S3). Although a non-melting fruit texture may have arisen during domesti-cation or post-domestidomesti-cation, we only identified weak do-mestication and improvement signals at the association region (Fig. 6b). However, using FSTanalysis of pairwise
population differentiation, we detected a strong signal at theFTlocus in accessions from northwestern China ver-sus the northeastern, southern, and Yangtze regions (Fig. 6c). Further investigation of allele frequencies sug-gested that the mutant allele was mainly distributed in northwestern China, the Yungui Plateau, the North Plain, and in western improved cultivars, which is consistent with the fruit texture distribution (Fig. 6d). These data, combined with the phylogenetic analysis, suggest that the non-melting alleles in western improved cultivars may be derived from northwestern China through the ancient Silk road and subsequently spread to other western countries (Fig.1b and Fig.6d).
In addition to breeding for fresh consumption, breed-ing for processbreed-ing into peach can or juice is an import-ant objective during improvement, and the non-melting
fruit texture is an essential selection target for breeding of processing peach [42]. A total of 15 processing peach cultivars were sequenced in this study (Additional file1: Table S1). Through scanning for genomic regions with high ROD in comparison of landraces and these 15 processing peach cultivars, we found a nearly 4-Mb se-lective sweep around the fruit texture GWAS signal on chromosome 4 (Fig. 6e). Intriguingly, this selection sig-nal also harbored QTLs related to SSC, fruit firmness, stone adhesion, total sugar, maturity date [32], and fruit weight (Fig. 6e). Some of these traits (non-melting, high fruit firmness, and clingstone) are fundamental selection goals for processing peaches [42], and this 4-Mb seg-ment may therefore represent a major genomic signature for selection of processing peaches.
Peach fruits with both high sugar and titratable acidity (TA) are widely consumed in western countries, while those with only high sugar are popular in eastern coun-tries, suggesting that breeding targets between eastern and western countries may differ. To test this hypothesis, we determined improvement sweeps for eastern and western improved groups, respectively, and identified a total of 102 and 87 selective sweeps (Additional file1: Tables S17 and S18, Additional file 3: Figure S17). Only approxi-mately half of the improvement sweeps in the eastern group fell within the top 5% of the ROD regions in the western group (Fig. 6f ), suggesting a limited number of shared breeding targets between eastern and western ac-cessions, which may underlie the difference in fruit taste between different areas (Additional file1: Tables S17 and S18, Additional file2: Table S19-S21). One example is the SSC:TA ratio, which is essential for fruit taste, for which we found a major 820-kb QTL [26] overlapping with a western-specific sweep on chromosome 5 (Fig.6g), which could have contributed to the selection for high SSC and TA in western cultivars. The local selection for this QTL was also supported by a highFSTvalue, when western and
eastern accessions were compared (Fig.6h). We conclude that differential selection for these regions conferred the richer flavor in western cultivars than eastern cultivars. Flavor selection involves multiple factors and it is notable that the increase of sugar content is not always accompan-ied by a parallel increase in consumer preference and flavor [10, 43]. An alternative explanation for different selection targets is that the western and eastern peach accessions have undergone different selection pressures resulting from the distinct environment.
Conclusions
providing insights into the history of peach evolution. We found that fruit size was predominantly selected during domestication and that selection for large fruits has led to the loss of genetic diversity infwQTLs. Fruit taste-related QTLs were successively selected for by two
successive selection steps, and many more fruit
taste-related QTLs were found to be associated with im-provement than with domestication, suggesting a sharp decline of genetic diversity at loci related to fruit taste. Although peach fruit taste has improved in modern
cultivars compared with their wild progenitors, succes-sive selection for sugar and acid may lead to a homogenization and deterioration in flavor quality, simi-lar to the case of commercial tomato varieties [43]. In this regard, the use of landrace accessions as parents, es-pecially heirloom varieties, has considerable potential in introgressing valuable genetic diversity.
Our variation dataset provides a valuable resource for future peach improvement using novel breeding tech-nologies and strategies, such as genomic selection, Fig. 6Divergent selection on flesh texture and local breeding.aRegional Manhattan plots of GWAS for flesh texture on chromosome 4. The top signal of GWAS was highlighted using a black arrow.bDistribution of ROD values during domestication and improvement in the association region. The green and orange horizontal dashed lines indicate 5% cut off of ROD value during domestication and improvement, respectively. cDistribution ofFSTvalues between different groups in the association region. TheFTQTL was highlighted using a black arrow.dGeographical
pattern of the allele frequencies at the causal polymorphisms (top signal of GWAS). The orange dashed line with arrow represents the putative spread route of peaches with non-melting fruit flesh. MF and NMF represent melting and non-melting flesh texture, respectively.eComparison of nucleotide diversity of between landraces and processing peach cultivars. A nearly 4-Mb strong selective sweep (between two dashed vertical bars) was highlighted and annotated. The QTLs and GWAS signals in this region are indicated.Fr, fruit firmness;FT, flesh texture;F, flesh adhesion; MD, maturity date.fVenn diagram showing sizes of shared and unique genome regions under selection in eastern and western improved cultivars.gDistribution of ROD values of eastern and western improved cultivars at the top of chromosome 5. Three QTLs, includingSSC/TA,TA, andsuc, in western-specific selective sweeps are labeled.hDistribution ofFSTbetween eastern and western improved cultivars at the top of
[image:12.595.57.541.86.455.2]molecular design breeding, and introgression of novel al-leles from landraces and wild relatives [44]. Associations for 11 agronomic traits also provide valuable informa-tion to accelerate genetic gains for key traits to improve yield and edible quality in peach.
Methods
Plant material and sequencing
We sampled a total of 480 peach accessions from the National Peach Germplasm Repository of China (NPGRC) (Zhengzhou) (N 34.71°, E 113.70°, A.S.L. 74 m), including 52 wild relatives (45 of Prunus mira Koehne, four of
P. davidiana (Carr.) Franch., two ofP. kansuensisRehd.,
a single sample of P. potaninii Batal), 213 landrace accessions (P. persica L.), and 215 improvement acces-sions (P. persicaL.) (Additional file1: Table S1). Genomic DNA was extracted from young leaves using the cetyltri-methylammonium bromide (CTAB) method [45] and at least 4μg of genomic DNA from each accession was used to construct a sequencing library, following the manufac-turer’s instructions (Illumina Inc.). Paired-end sequencing libraries with an insert size of approximately 300 bp or 500 bp were sequenced using an Illumina GAII or Hiseq 2500 sequencer, with read lengths of 49 bp, 90 bp, or 125 bp. In total, more than 1 Gb of sequence data was generated for each accession (Additional file1: Table S1).
Alignment and variation calling
Mapping of short reads
Paired-end sequencing reads from each accession were mapped to the peach“Lovell”genome [12] (release ver-sion 2.0_a2.1) using BWA [46] (version 0.7.12), with the following parameters: bwa mem -t 4 -M -R. Mapped reads in SAM format were converted into BAM format, sorted according to mapping coordinates, and processed for PCR duplicate removal using the Picard package (http://broadinstitute.github.io/picard/, version 1.136) with default parameters. The coverage and depth of sequence alignments were computed using the DepthOfCoverage program in the Genome Analysis Toolkit [47] (GATK, version 3.4-46) and the genomencov program in BED-tools [48] (version 2.24.0), respectively. The coverage and depth of each accession are provided in Additional file1: Table S1.
SNP calling
SNP calling followed GATK Best-Practices ( https://soft-ware.broadinstitute.org/gatk/best-practices/bp_3step.php?
case=GermShortWGS). To obtain accurate SNPs, we
fil-tered low-quality alignments with a mapping quality < 20 using SAMtools [49] (V1.3.1). SNP detection was per-formed using the GATK HaplotypeCaller [50], which calls SNPs via local de novo assembly of haplotypes in an active region. The detailed processes were as follows: (1) after
filtering out the low-quality alignments, the reads around the INDELs were realigned in two steps, including identify-ing regions where realignment was needed usidentify-ing the GATK RealignerTargetCreator package and realigning the regions found in the first step using the GATK IndelRealigner pack-age. Next, a realigned BAM file for each accession, which was used for SNP detection, was generated using the GATK PrintReads packages. (2) SNPs were detected at a population level using the realigned BAM file with GATK HaplotypeCaller. To reduce false positives, we set a high SNP confidence score with the following param-eters: -stand_call_conf 30 -stand_emit_conf 40. (3) To ensure the quality of variant calling, we supplied a hard filter for the raw SNPs with SNP quality > 40 and more than two supporting reads using GTAK VariantFiltration with the following parameters: QUAL < 40, QD < 2.0, FS > 60.0, MQ < 40.0, MQRankSum <−12.5, ReadPosRankSum <−8.0. To further reduce false positives, the SNP number per 10 bp was limited to three using the following settings: --clusterWindowSize 10, --clusterSize 3.
INDEL calling
INDEL calling was performed using the same pipeline as SNP calling since GATK is capable of calling SNPs and INDELs simultaneously. To reduce false positives, we also supplied a harder filter for raw INDELs using GTAK VariantFiltration with the following parameters: QD < 2.0, FS > 200.0, ReadPosRankSum <−20.0. Insertions and deletions≤5 bp were defined as small INDELs.
SV calling
[54] (Additional file 3: Figure S18). Finally, SVs identi-fied by at least two callers were kept and used for downstream analyses.
SNP annotation
SNP annotation was performed based on genomic loca-tions and predicted coding effects according to the peach genome annotation [12] (release annotation version a2.1) using snpEff (version 4.1g) [55]. The final SNPs were cate-gorized in exonic regions, intronic regions, splicing sites, 5′ and 3′ untranslated regions (UTRs), upstream and downstream regions, and intergenic regions. SNPs in the coding sequence were further grouped into synonymous SNPs (which did not cause amino acid changes) and non-synonymous SNPs (which caused amino acid changes) (Additional file2: Tables S2 and S3).
SNP genotype imputation
We noted that 13 accessions exhibited a genotyping miss rate > 30% (Additional file3: Figure S19). In these cases, we inferred missing genotype data using the hidden
Markov model (HMM) in the Beagle software [56]
(version 4.0) with the following default parameter settings: unphased and non-reference; iterations = 10 window = 50,000 nthreads = 10.
Population genetics analysis
Phylogeny
A neighbor-joining tree was constructed with all 4,980,259 SNPs using the PHYLIP software (version 3.696) with 100 bootstrap replicates [57], and visualized using the FigTree software (http://tree.bio.ed.ac.uk/software/figtree/, version 1.4.2) and evolview (v2) [58].
PCA
We performed the PCA using the GCTA software (ver-sion 1.26.0) with default settings [59]. The first three ei-genvectors were retained to create a plot in two or three dimensions.
Population structure
The population structure was also investigated with the STRUCTURE software [60] (version 1.3.0), which is based on a likelihood model. We ran 10,000 iterations, and the number of clusters (K) was set from 2 to 7, repre-senting the assumed groups of the simulated ancestry population. The bestKwas inferred based on the delta K method using the Structure Harvester program [61].
LD analysis
LD was calculated on the basis of SNPs with MAF greater than 0.05 using PLINK software (Version 1.07) [62] with following: --file --r2 --ld-window 99999 --ld-window-kb 200 --out. Then, values for the r2
statistics were obtained. LD decay was calculated based
on r2 between two SNPs and the distance between the
two SNPs.
Population size estimation
The effective population size at domestication was esti-mated using the δaδi program (Version 1.7.0) [21]. We fitted a two-population model with landrace and im-proved groups mixed together and compared to the wild group (Additional file3: Figure S20 and Additional file2: Table S22). The simulation was carried out 10 times, and each time we randomly selected 500,000 SNPs and estimated 95% confidence intervals on the basis of the best fitting parameters. The parameters inferred byδaδi were scaled by 2Ne, with Nebeing the ancestral
popula-tion size. The ancestral populapopula-tion size was estimated using the formula 4Ne×μ×L=θ, whereμ is the
muta-tion rate, L is the generation time, andθ is the genetic diversity. We used θwild to estimate θ (∼3.5 × 10⁻³). A
mutation rate of 7.77 × 10⁻⁹ (the mutation rate per generation) [63] and a generation time of 3 were used for
μ and L. Therefore, 2Ne was estimated to be 7.50 × 10⁴.
All the parameters were then scaled by 2Ne to
esti-mate time in years and the population size in number of individuals.
Domestication bottleneck was further verified using the BOTTLENECK program (version 1.2.02) which tests historical bottleneck by detecting the reductions of re-cent effective population size based on the comparison of heterozygosity [64]. A total of 1000 randomly selected SNPs were used in BOTTLENECK analysis. The tests were performed under the stepwise-mutation model (SMM), infinite allele model (IAM), and the two-phase model (TPM) allowing for 30% multistep changes. The iteration was set to 1000. We used the Wilcoxon signed rank tests to determine whether a population had a sig-nificant number of loci with excess genetic diversity.
Genetic diversity and population differentiation
The nucleotide diversity (π) was calculated for each group with VCFtools [65] (version 0.1.12) using a 100-kb window and a step size of 10 kb. Genetic differentiation (FST) was determined among different groups with
VCFtools using a 100-kb window with a step size of 10 kb. Tajima’s D value was calculated with VariScan [66] (version 2.0.3) using a 100-kb window and a step size of 10 kb.
Detection of selective sweeps
calculated, and the top 5% of windows or regions with highest ROD values were defined as domestication sweeps (πwild/πlandrace > 8.21). For improvement,
πlandrace/πimproved cultivarswas calculated, and the top 5% of
windows or regions with highest ROD values were defined as improvement sweeps (πlandrace/πimproved cultivars> 4.28).
To confirm the selection sweeps identified by ROD,
we also detected the selection signals using a
likelihood-based method in the SweeD program
(Version 3.1) [67]. The composite likelihood ratio (CLR) was calculated in domestication and improvement candidate regions using a grid of 2000. We found that more than 83% of the selective sweeps identified by ROD also showed selection signals by the CLR test (Additional file 3: Figure S21), indicating that most of the selection regions can be identified by both methods, which are thus reliable.
Phenotyping
Seven qualitative traits, including flesh color (white/yellow), fruit hairiness (peach/nectarine), fruit shape (round/flat), fruit texture (melting/non-melting), flesh adhesion (adhesion/freestone), pollen fertility (male sterility/fertility), and fruit skin color (red/non-red skin) were measured based on previously published plant genetic resources evaluation criteria [68] in two successive years, from 2011 and 2012. The SSC was determined with a hand refractom-eter in 2007, 2010, and 2014 following the same protocol described in Frett et al. [69]. Ten peach fruits were sampled and homogenized to form a juice for each accession to de-termine the SSC. The fruit weight was dede-termined as the average value of 10 fruits for each accession in 2007 and in 2010. The phenotypic value used for GWAS of these two quantitative traits was the mean of different measurements from different years. The frequency distribution of these two quantitative traits (SSC and fruit weight) is shown in Additional file3: Figure S7. Total phenolics were extracted from 5 g fresh flesh combining five peach fruits using an extraction solution of 0.5 mol/L HCL in 800 mL/L metha-nol. The total phenolics were further evaluated with colori-metric methods and measured using a spectrophotometer (TU-1901, PERSEE, Beijing, China) as previously described [70]. Total phenolics was evaluated in 2015 and 2016, and the mean values used in GWAS.
For CR, two different kinds of phenotyping analyses were performed in 2011 and 2012. First, CR was consid-ered a quantitative trait and determined following a protocol as previously described [38]. Average tempera-tures in 30-min intervals were continuously recorded using a temperature automatic recorder (LOGGER 95-4, http://www.hzjly.com) placed in the canopies of the ex-perimental trees, starting in the middle of October. A 0– 7.2 °C model was chosen to evaluate CR that was dem-onstrated to be suitable at Zhengzhou [38, 71]. The
number of hours in 0–7.2 °C (chilling hours, CHs) was counted, starting when the daily average air temperature dropped to below 7.2 °C. Starting at 50 CHs, the branches of each accession were cut every 50 CHs until 1300 CHs. For each accession, two clones were sampled, and three branches longer than 40 cm with floral buds were taken from each clone. Branch cuttings were placed in water in a greenhouse at 25 °C and a 16 h/8 h photo-period to force floral bud break. The frequency of floral bud break was evaluated after 2 weeks. The CR of an ac-cession was defined as being sufficient at a specific sam-pling time if 50% of floral buds on the branch cuttings opened (Additional file3: Figure S13). Secondly, CR was defined as a qualitative trait and evaluated using a simi-lar method. Branches of each accession were cut only at 400 CHs. The frequency of floral bud break was evalu-ated after 2 weeks at forcing temperature. An accession was considered to have “low CR” if 50% of floral buds on the branch cuttings opened; otherwise, the accession was defined as a“non-low CR”accession. The results of the second measurement are shown in Additional file1: Table S16.
Genome-wide association studies
We used 374, 207, 415, 343, 343, 343, 165, 271, 361, 355, and 362 peach accessions to perform GWAS for flesh color, fruit hairiness, fruit shape, fruit texture, flesh adhesion, pollen fertility, total levels of phenolic compounds, skin color, fruit weight, fruit SSC, and CR, respectively. To im-prove the statistical power of the analysis, we filtered SNPs with minor allele frequency (MAF) < 0.05 or MAF < 0.01 after genotype imputation for each GWAS. A mixed linear model (MLM) program, Efficient Mixed-Model Association eXpedited (EMMAX) [72] (version beta), was used to carry out the GWAS analyses. To minimize false pos-itives, population structure was taken into account using a kinship matrix that was estimated with the
EMMAX emmax-kin program [72]. We defined the
whole-genome significance cutoff as the Bonferroni test threshold, which was set as 0.05/total SNPs (−log10(P) =
7.19, −log10(P) = 7.62, −log10(P) = 7.19, −log10(P) = 7.62, −log10(P) = 7.62, −log10(P) = 7.62, −log10(P) = 7.18, −log10(P) = 7.12, −log10(P) = 7.49, −log10(P) = 7.59, −log10(P) = 7.38 for flesh color, fruit hairiness, fruit
shape, fruit texture, flesh adhesion, pollen fertility, total levels of phenolic compounds, skin color, fruit weight, fruit SSC, and CR, respectively). Genome-wide SVs were also used to perform GWAS with the same accessions. The GWAS using SVs followed the same protocols of GWAS using SNPs.
RNA-Seq analysis
biological replicates were collected for each stage. Fruit flesh was immediately frozen in liquid nitrogen and then ground to fine powder. Total RNA was extracted using a quick extraction kit (Aidlab, Beijing, China). First- and second-strand complementary DNA (cDNA) was synthe-sized using a cDNA Synthesis System kit (TOYOBO, Osaka, Japan), following the manufacturer’s protocol. Then double-strand cDNAs were purified and adapters were ligated to the short fragments. The constructed RNA-Seq libraries were sequenced using the Illumina HiSeq 2000 platform in paired-end 150-bp mode. Low-quality reads were filtered from the raw reads using Trimmomatic [73]. Data analysis followed the protocol proposed by Pertea et al. [74]. Cleaned reads were mapped to the peach reference genome using HISAT2 (Version 2.0.5) [75] using default parameters. Transcript abundances were estimated, and transcript assembly was performed using the Stringtie pro-gram [76]. DEG analysis was carried out using the R pack-age ballgown [77].
Overexpression ofSVPgene inArabidopsis
The full-length open reading frames of peach SVPgene (Prupe.8G069300) were amplified through PCR using cDNAs synthesized from RNA that were isolated from young leaves of a low CR landrace, “Nanshan Tian Tao” (CR = 200 h). The PCR products were further cloned into the pBI121 vector driven by the cauliflower mosaic virus (CaMV) 35S promoter at Sangon Biotech (Sangon, Shanghai, China). The resulting constructs were further transformed into Arabidopsis thaliana Columbia type by
Agrobacterium tumefaciens GV3101 and selected with
kanamycin. The rosetteleaf numbers of 10 transgenic lines were used to evaluate the flowering time. The primers used for gene cloning are listed in Additional file2: Table S23.
Expression analysis using qRT-PCR
Total RNA were extracted from the fruit flesh of 10 acces-sions at maturity, including“Kashi 2,” “Kashi 3,” “Kashi 4,” “Xinjiang Huang Rou,” “Zao Shu Huang Gan,” “Lin Huang 1,” “Reddomun,” “Gua Tao,” “Shaji 2,” “Hang Zhou Zao Shui Mi,” using an extraction kit (Aidlab, Beijing, China). First-strand cDNA synthesis was carried out using 1 mg RNA and the Transcriptor First Strand cDNA synthesis kit (Takara, Dalian, China), according to the manufacturer’s protocol. Sequence of candidate gene for SSC, Pru-pe.4G150100, was downloaded from the Genome Database for Rosaceae (GDR; www.rosaceae.org). Gene-specific primers were designed using the Primer-BLAST software (National Center for Biotechnology Information, Maryland, USA). We performed qRT-PCR using the LightCycler System (Roche LightCycler 480; Roche Diagnostics), follow-ing the manufacturer’s protocol. Relative expression levels were estimated by the 2−ΔΔCT method. The primers were listed in Additional file2: Table S23.
Additional files
Additional file 1:Table S1.Sequencing summary of 480 peach accessions.Table S8.Putative domestication sweeps.Table S9.Putative improvement sweeps.Table S10.Genes in putative domestication sweeps.Table S11.Genes in putative improvement sweeps.Table S15. Putative selective sweeps for low CR breeding.Table S16.Chilling requirement test by classifying accessions into low (1) and non-low CR (0).Table S17.Putative improvement sweeps in western improved group.Table S18.Putative improvement sweeps in eastern improved group. (XLSX 576 kb)
Additional file 2:Table S2.Distribution and summary of genome-wide variants.Table S3.Summary of SNP annotations.Table S4.SNP loci (30) selected for validation by Sequenom MassARRAY.Table S5.GWAS results for six traits using SNPs and SVs.Table S6.Estimation of domestication bottlenecks in peach and other crop and fruit species.Table S7. Domestication bottleneck verified using BOTTLENECK.Table S12. Genomic regions continuously selected by both domestication and improvement.Table S13.Summary of SNPs associated with SSC and fruit weight.Table S14.SNPs associated with chilling requirement.Table S19. Shared selective sweeps between western and eastern improved groups. Table S20.Eastern specific improvement sweeps.Table S21.Western group specific improvement sweeps.Table S22.Best fitting parameters for the two-population model for cultivated and wild peach groups in the demographic analysis.Table S23.Primers used in this study. (DOC 486 kb)
Additional file 3:Figure S1.Genetic diversity of the 480 peach accessions.Figure S2.Manhattan plot and QQ plot of genome-wide association studies on seven important agronomic traits.Figure S3.A candidate 70.5-kb deletion underlying fruit texture.Figure S4.Phenetic neighbor-joining tree of 480 peach accessions constructed using PHYLIP with 100 bootstrap replicates.Figure S5.Population structure of the 480 peach accessions.Figure S6.Phenotypes and nucleotide diversity changes during peach improvement and domestication.Figure S7. Genome-wide association studies (GWAS) of SSC and fruit weight. Figure S8.Regional LD decay measured byR2at the 20.0–30.0-Mb
region of chromosome 2.Figure S9.Total organic acids in domesticated peaches and wild relatives.Figure S10.Genome-wide association study of total phenolic content for peach.Figure S11.Expression profile of a sugar transport gene,Prupe.4G037800, during fruit development in peach. Figure S12.A candidate gene for SSC associated with increase of fruit taste during domestication.Figure S13.Distribution of chilling requirement in 371 peach accessions.Figure S14.Manhattan plot (left) and QQ plot (right) of GWAS for chilling requirement (CR) by classifying accessions into low CR and non-low CR.Figure S15.Comparison of flowering times betweenArabidopsisoverexpressing of peachSVPgene (OE) and the wild type (WT)Arabidopsis.Figure S16.A PCR-based marker for low CR peach identification based on the results of CR GWAS.Figure S17.Comparison of improvement sweeps between eastern and western improved groups. Figure S18.Shared and private SVs among three callers.Figure S19. Distribution of genotype missing rate for 480 peach accessions.Figure S20. Demographic model for peach domestication and spread.Figure S21. Shared domestication and improvement sweeps identified by ROD and XP-CLR methods. (PDF 2514 kb)
Additional file 4:Review history. (DOCX 197 kb)
Acknowledgements
We thank Xiuli Zeng and Shanshan Zhang from the Tibet Academy of Agricultural and Animal Husbandry Sciences for helping to collect and investigate theP. miraaccessions from the Tibet Plateau, Prof. Dacheng Tian and Prof. Sihai Yang from Nanjing University for suggestions on data analyses and paper writing, and Dr. Amandine Cornille from Université Paris-Sud for helpful suggestions in paper writing.
Funding
Availability of data and materials
The sequence data have been deposited in the NCBI Sequence Read Archive (SRA) under accession PRJNA388029 [78]. The peach reference genome (v2.0) used in this study is available from Genome Database for Rosaceae [12]. SNPs and SVs in Variant Call Format (VCF) have been deposited into the Figshare database [79,80]. All other relevant data are contained within the paper and its Additional files.
Authors’contributions
LW, ZF, and WG designed and managed the project; YL, GZ, WF, XW, and CC collected the materials; YL, PZ, JG, LG, and QZ prepared and purified DNA samples; YL and KC performed the data analyses; Y L, TD, and WF performed the phenotyping. YL wrote the paper; LW, ZF, and KC revised the paper. All authors read and approved the final manuscript.
Review history
The review history is available as Additional file4.
Ethics approval and consent to participate Not applicable.
Consent for publication Not applicable.
Competing interests
The authors declare that they have no competing interests.
Publisher’s Note
Springer Nature remains neutral with regard to jurisdictional claims in published maps and institutional affiliations.
Author details
1Zhengzhou Fruit Research Institute, Chinese Academy of Agricultural
Sciences, Zhengzhou, China.2Boyce Thompson Institute for Plant Research, US Department of Agriculture (USDA) Robert W. Holley Center for
Agriculture and Health, Cornell University, Ithaca, NY, USA.3Key Laboratory of Horticultural Plant Biology (Ministry of Education), College of Horticulture and Forestry Sciences, Huazhong Agricultural University, Wuhan, China.
Received: 25 May 2018 Accepted: 5 February 2019
References
1. Borlaug NE. Contributions of conventional plant breeding to food production. Science. 1983;219:689–93.
2. Huang X, Wei X, Sang T, Zhao Q, Feng Q, Zhao Y, et al. Genome-wide association studies of 14 agronomic traits in rice landraces. Nat Genet. 2010;42:961–7. 3. Jiao Y, Zhao H, Ren L, Song W, Zeng B, Guo J, et al. Genome-wide genetic
changes during modern breeding of maize. Nat Genet. 2012;44:812–5. 4. Qi J, Liu X, Shen D, Miao H, Xie B, Li X, et al. A genomic variation map provides insights into the genetic basis of cucumber domestication and diversity. Nat Genet. 2013;45:1510–5.
5. Lin T, Zhu G, Zhang J, Xu X, Yu Q, Zheng Z, et al. Genomic analyses provide insights into the history of tomato breeding. Nat Genet. 2014;46:1220–6. 6. Zhou Z, Jiang Y, Wang Z, Gou Z, Lyu J, Li W, et al. Resequencing 302 wild
and cultivated accessions identifies genes related to domestication and improvement in soybean. Nat Biotechnol. 2015;33:408–14.
7. Cao K, Zhou Z, Wang Q, Guo J, Zhao P, Zhu G, et al. Genome-wide association study of 12 agronomic traits in peach. Nat Commun. 2016;7:13246. 8. Duan N, Bai Y, Sun H, Wang N, Ma Y, Li M, et al. Genome re-sequencing
reveals the history of apple and supports a two-stage model for fruit enlargement. Nat Commun. 2017;8:249.
9. Dirlewanger E, Graziano E, Joobeur T, Garriga-Calderé F, Cosson P, Howad W, et al. Comparative mapping and marker-assisted selection in Rosaceae fruit crops. Proc Natl Acad Sci U S A. 2004;101:9891.
10. Cirilli M, Bassi D, Ciacciulli A. Sugars in peach fruit: a breeding perspective. Hortic Res. 2016;3:15067.
11. Cao K, Zheng Z, Wang L, Liu X, Zhu G, Fang W, et al. Comparative population genomics reveals the domestication history of the peach, Prunus persica, and human influences on perennial fruit crops. Genome Biol. 2014;15:415.
12. Verde I, Abbott AG, Scalabrin S, Jung S, Shu S, Marroni F, et al. The high-quality draft genome of peach (Prunus persica) identifies unique patterns of genetic diversity, domestication and genome evolution. Nat Genet. 2013;45:487–94.
13. Falchi R, Vendramin E, Zanon L, Scalabrin S, Cipriani G, Verde I, et al. Three distinct mutational mechanisms acting on a single gene underpin the origin of yellow flesh in peach. Plant J. 2013;76:175–87.
14. Dirlewanger E, Cosson P, Boudehri K, Renaud C, Capdeville G, Tauzin Y, et al. Development of a second-generation genetic linkage map for peach [Prunus persica(L.) Batsch] and characterization of morphological traits affecting flower and fruit. Tree Genet Genomes. 2006;3:1–13. 15. Vendramin E, Pea G, Dondini L, Pacheco I, Dettori MT, Gazza L, et al. A
unique mutation in aMYBgene cosegregates with the nectarine phenotype in peach. PLoS One. 2014;9:e90574.
16. Gu C, Wang L, Wang W, Zhou H, Ma B, Zheng H, et al. Copy number variation of a gene cluster encoding endopolygalacturonase mediates flesh texture and stone adhesion in peach. J Exp Bot. 2016;67:1.
17. Yamamoto T, Shimada T, Imai T, Yaegaki H, Haji T, Matsuta N, et al. Characterization of morphological traits based on a genetic linkage map in peach. Breeding Sci. 2001;51(4):271–8.
18. Velasco D, Hough J, Aradhya M, Ross-Ibarra J. Evolutionary genomics of peach and almond domestication. G3-Genes Genom Genet. 2016;6(12):3985–93.
19. Zhou Y, Massonnet M, Sanjak JS, Cantu D, Guat B. Evolutionary genomics of grape (Vitis viniferassp. Vinifera) domestication. Proc Natl Acad Sci U S A. 2017;114(44):11715–20.
20. Cornuet JM, Luikart G. Description and power analysis of two tests for detecting recent population bottlenecks from allele frequency data. Genetics. 1996;144:2001–14.
21. Gutenkunst RN, Hernandez RD, Williamson SH, Bustamante CD. Inferring the joint demographic history of multiple populations from multidimensional SNP frequency data. PLoS Genet. 2009;5:e1000695.
22. Ross-Ibarra J, Tenaillon M, Gaut BS. Historical divergence and gene flow in the genusZea. Genetics. 2009;181:1399–413.
23. Caicedo AL, Williamson SH, Hernandez RD, Boyko A, Fledel-Alon A, York TL, et al. Genome-wide patterns of nucleotide polymorphism in domesticated rice. PLoS Genet. 2007;3:1745–56.
24. Arroyo-García R, Ruizgarcía L, Bolling L, Ocete R, López MA, Arnold C, et al. Multiple origins of cultivated grapevine (Vitis viniferaL. ssp. sativa) based on chloroplast DNA polymorphisms. Mol Ecol. 2006;15(12):3707–14.
25. Dirlewanger E, Moing A, Rothan C, Svanella L, Pronier V, Guye A, et al. Mapping QTLs controlling fruit quality in peach (Prunus persica(L.) Batsch). Theor Appl Genet. 1999;98:18–31.
26. Quilot B, Wu B, Kervella J, Génard M, Foulongne M, Moreau K. QTL analysis of quality traits in an advanced backcross betweenPrunus persica, cultivars and the wild relative speciesP. davidiana. Theor Appl Genet. 2004;109:884–97.
27. Martínez-García PJ, Parfitt DE, Ogundiwin EA, Fass J, Chan HM, Ahmad R, et al. High density SNP mapping and QTL analysis for fruit quality characteristics in peach (Prunus persicaL.). Tree Genet & Genomes. 2013;9:19–36.
28. Zeballos JL, Abidi W, Giménez R, Monforte AJ, Moreno MA, Gogorcena Y. Mapping QTLs associated with fruit quality traits in peach [Prunus persica(L.) Batsch] using SNP maps. Tree Genet & Genomes. 2016;12:37.
29. Frary A, Nesbitt TC, Grandillo S, Knaap E, Cong B, Liu J, et al.fw2.2: a quantitative trait locus key to the evolution of tomato fruit size. Science. 2000;289:85–8.
30. Wang LR, Zhu GR, Fang WC. Peach genetics resources in China. Beijing: China Agriculture Press; 2012.
31. Etienne C, Rothan C, Moing A, Plomion C, Bodénès C, Svanella-Dumas L, et al. Candidate genes and QTLs for sugar and organic acid content in peach [Prunus persica(L.) Batsch]. Theor Appl Genet. 2002;105:145–59. 32. Eduardo I, Pacheco I, Chietera G, Bassi D, Pozzi C, Vecchietti A, et al. QTL
analysis of fruit quality traits in two peach intraspecific populations and importance of maturity date pleiotropic effect. Tree Genet Genomes. 2011;7(2):323–35.
33. Predieri S, Ragazzini P, Rondelli R. Sensory evaluation and peach fruit quality. Acta Hort. 2006;713:429–34.