A Framework for Assessing High School
Students’ Statistical Reasoning
Shiau Wei Chan1*, Zaleha Ismail2☯, Bambang Sumintono3☯
1 Department of Production and Operation Management, Faculty of Technology Management and
Business, Universiti Tun Hussein Onn Malaysia, Batu Pahat, Johor, Malaysia, 2 Department of Educational Sciences, Mathematics and Creative Multimedia, Faculty of Education, Universiti Teknologi Malaysia, Skudai, Johor, Malaysia, 3 Institute of Educational Leadership, University of Malaya, Kuala Lumpur, Malaysia
☯These authors contributed equally to this work. *[email protected]
Abstract
Based on a synthesis of literature, earlier studies, analyses and observations on high school students, this study developed an initial framework for assessing students’ statistical reasoning about descriptive statistics. Framework descriptors were established across five levels of statistical reasoning and four key constructs. The former consisted of idiosyncratic reasoning, verbal reasoning, transitional reasoning, procedural reasoning, and integrated process reasoning. The latter include describing data, organizing and reducing data, repre-senting data, and analyzing and interpreting data. In contrast to earlier studies, this initial framework formulated a complete and coherent statistical reasoning framework. A statisti-cal reasoning assessment tool was then constructed from this initial framework. The tool was administered to 10 tenth-grade students in a task-based interview. The initial frame-work was refined, and the statistical reasoning assessment tool was revised. The ten stu-dents then participated in the second task-based interview, and the data obtained were used to validate the framework. The findings showed that the students’ statistical reasoning levels were consistent across the four constructs, and this result confirmed the framework’s cohesion. Developed to contribute to statistics education, this newly developed statistical reasoning framework provides a guide for planning learning goals and designing instruction and assessments.
Introduction
Today, statistical reasoning has become a ubiquitous part of many disciplines, such as business [1], education, and engineering. Nevertheless, high school students appear to have poor statisti-cal reasoning ability [2], and they often harbor numerous misconceptions about statistical rea-soning, as found in our preliminary and earlier studies. For instance, in descriptive statistics, students frequently make mistakes in answering questions regarding measures of central ten-dency [3,4] and variability [5–7]. Statistical reasoning is a neglected area, particularly compared a11111
OPEN ACCESS
Citation: Chan SW, Ismail Z, Sumintono B (2016) A Framework for Assessing High School Students’ Statistical Reasoning. PLoS ONE 11(11): e0163846. doi:10.1371/journal.pone.0163846
Editor: Michael A Motes, Center for BrainHealth, University of Texas at Dallas, UNITED STATES
Received: April 17, 2015
Accepted: September 15, 2016
Published: November 3, 2016
Copyright:©2016 Chan et al. This is an open
access article distributed under the terms of the
Creative Commons Attribution License, which permits unrestricted use, distribution, and reproduction in any medium, provided the original author and source are credited.
Data Availability Statement: The data are ethically restricted due to participant privacy. Email contact where requests for the data may be sent:
Funding: This work was supported by Universiti Tun Hussein Onn Malaysia (UTHM) under grant no. U431.
to the areas of statistical literacy and statistical thinking [8]. In addition, statistical reasoning is not adequately covered in Malaysian mathematics textbooks. Statistical reasoning must be incorporated into the Malaysian curriculum to foster students’ conceptual understanding of sta-tistical concepts. Hence, this study aims to bridge these gaps by focusing on stasta-tistical reasoning about descriptive statistics. In this context, statistical reasoning is defined as ‘the way people rea-son with statistical ideas and make sense of statistical information. It involves making interpre-tations based on sets of data or statistical summaries of data, where students need to combine ideas about data and chance to make inferences and interpret statistical results’ [9] (p.101).
The initial statistical reasoning framework in the present study was developed from the five levels of statistical reasoning of Garfield’s [10] model and the four key constructs of Jones et al.’s [11] framework [12]. The development and initial validation of the statistical reasoning assessment tool based on the aforementioned initial statistical reasoning framework were con-ducted by Chan and Ismail [12,13]. The initial framework and assessment tool from Chan and Ismail [12] were employed in the current study. Few studies to date have focused on the five levels of statistical reasoning, especially in secondary students. More studies have focused on the four constructs, but research on the integration of information technology with the four processes remains scarce. Furthermore, although some studies have investigated reasoning related to measures of central tendency, variability and distribution, this domain is far from a complete and coherent statistical reasoning framework. This area is thus addressed in the pres-ent study, and in contrast to preceding frameworks, this newly developed framework is more unique and distinctive in combining Garfield’s [10] model with Jones et al.’s [11] framework. As such, the purposes of this study are as follows:
1. To develop an initial framework for assessing students’ statistical reasoning;
2. To construct a tool for assessing students’ statistical reasoning; and
3. To refine and validate the initial framework for assessing students’ statistical reasoning.
Theoretical Considerations
Five levels of Statistical Reasoning
The model introduced by Biggs and Collis [14,15], known as the Structure of Observed Learning Outcomes (SOLO) taxonomy, was established on a theoretical basis [16] that has been widely discussed in cognitive models of statistical reasoning development. Jones et al. [11] and Mooney [16] found that many students’ statistical thinking levels lie within the four cogni-tive thinking levels of the SOLO model. Thus, to formulate our new framework of statistical reasoning, we assumed that the statistical reasoning levels of students across the four constructs can also be described using the SOLO model. This model has five modes of functioning [15]: sensorimotor (from birth), ikonic (from approximately 18 months), concrete-symbolic (from approximately 6 years), formal (from approximately 14 years), and post-formal (from approxi-mately 20 years). As noted by Panizzon, Pegg and McGee [17], students who act in response to their physical environment are at the sensorimotor stage, while students who can internalize action in terms of figures are at the ikonic stage. Students who are at the concrete symbolic stage prefer to use symbolic systems such as number schemes, maps, and written words. Stu-dents who can also apply abstract ideas are in the formal mode, and stuStu-dents who are skilled in analyzing the essential structure of theories and disciplines are said to be in the post-formal mode.
The SOLO model also has five levels of understanding, which are prestructural, unistruc-tural, multistrucunistruc-tural, relational, and extended abstract [14]. At the prestructural level, students are perplexed and thus can give only irrelevant responses when solving a task. In short, these students can show only small pieces of evidence related to their learning [18]. At the unistruc-tural level, students can emphasize one related feature of the task and can use some terms cor-rectly as well [18]. As they improve, these students can bring in several task-related features without integrating them, which means that they have reached the multistructural level. Biggs and Tang [18] used the following analogy to describe students at this level: they can see the tree but not the wood because they do not yet fully comprehend the situation. At the relational level, students can combine different features of the task into a coherent whole, and at the extended abstract level, students are capable of generalizing and conceptualizing the incorpo-rated whole to a higher level of abstraction.
In this study, we hypothesized that students at Level 1 (idiosyncratic reasoning) would exhibit elements of the prestructural level in the ikonic mode. Meanwhile, students at Level 2 (verbal reasoning) would display elements of the unistructural level in the concrete symbolic mode. Similarly, elements of the multistructural level in the concrete symbolic mode would be demonstrated by students at Level 3 (transitional reasoning). We also postulated that students at Level 4 (procedural reasoning) would show elements of the relational level in the concrete symbolic mode. Finally, students who reveal elements of the extended abstract level in the for-mal mode are regarded as having reached Level 5 (integrated process reasoning).
The Four Constructs
With regard to describing data, many students have found it difficult to read different types of graphs, such as bar graphs and histograms, rendering them incapable of performing various forms of data analysis [20]. Students also tend to see the data as individual entities rather than as a cluster of data [21,22]. Hence, to overcome this tendency, we recommended three sub-pro-cesses for describing data in this study: (i) extracting and generating information from the data or graph, (ii) showing awareness of the display attributes of the graphical representation, and (iii) recognizing the general features of the graphical representation. The first sub-process is important in enabling students to obtain explicit information from the data or graphs. The sec-ond sub-process is identical to the first sub-process of describing data in Mooney’s [16] study, where students should have an awareness of the display attributes of the graphical representa-tion. In addition, the third sub-process is added to the framework because it is imperative to guide students to see the three ideas (shape, measures of central tendency, and variability) as a whole unit [23] when they recognize the common characteristics of the graphical
representations.
For organizing and reducing data, earlier studies revealed that many students have miscon-ceptions about measures of central tendency, including the mean [24–27], median [27], mode [28], and measures of variability [29–31]. Sharma [32] claimed that students may be bewil-dered when both measures are combined in one task. Therefore, three sub-processes of orga-nizing and reducing data were proposed in this study to address this issue: (i) orgaorga-nizing data into a computer system; (ii) reducing data using measures of central tendency, either by lation or aided by technology; and (iii) reducing data using measures of spread, either by calcu-lation or aided by technology. These three sub-processes are different from those used in earlier studies because they involve the utilization of information technology, an element that was not previously emphasized. For the first sub-process, students were required to organize the data in the computer system rather than manually. Furthermore, the students were asked to use measures of central tendency and variability to reduce their data manually and to use computerized computation in the second and third sub-processes. After they had performed these calculations manually, the students were required to check their answers using computers.
Representing data using different mathematical graphics, such as histograms [27,33,34], box plots [35], and bar graphs [36], can be a daunting task for many students. Consequently, we suggest three sub-processes of representing data in this study: (i) demonstrating data sets graphically using a computer, (ii) identifying different representations for the same data set, and (iii) judging the effectiveness of two different representations for the same data. Admit-tedly, these three sub-processes also involve the utilization of information technology. In the first sub-process, students were to present their data by dragging the figure dynamically and drawing different graphical representations using GeoGebra software. The second sub-process is similar to the second sub-process of describing data in Mooney’s [16] study, in which stu-dents were required to identify different graphical representations for the same set of data. Moreover, the third sub-process is similar to the third sub-process of describing data in Moon-ey’s [16] study, as it asks students to assess the efficacy of two different representations for the same data. In contrast to those in previous studies, these three sub-processes involve not only evaluating the process of creating graphs but also making sense of the graphs in order to develop more sophisticated reasoning in representing data [37].
prediction, inference or conclusion among the data or graphs. The first sub-process requires students to make comparisons within the same set of data, while the second requires them to make comparisons between two different sets of data. The first and second sub-processes cor-respond to the first and second sub-processes in Mooney’s [16] study. For the third sub-pro-cess, students were asked to make a prediction, inference or conclusion from data or graphs. The process of making a prediction is equivalent to the second sub-process in Jones et al.’s [11] study. Meanwhile, the process of making an inference is comparable to the third sub-process in Mooney’s [16] study. Although the process of drawing a conclusion was not included in earlier studies, it is crucial for students to know how to draw conclusions from the data or graphs at the end of a task.
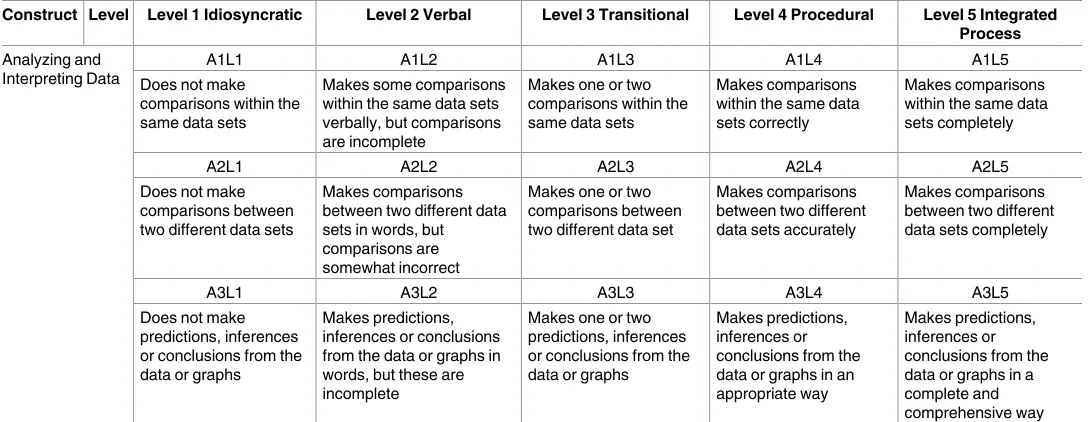
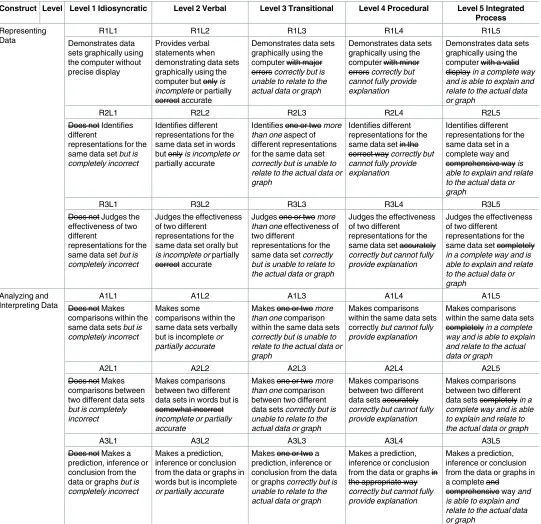
These four constructs, together with the aforementioned five levels of statistical reasoning, constitute the initial statistical reasoning framework of this study, as displayed inTable 1.
Methodology
Validation Process
As noted above, an initial statistical reasoning framework was formulated from the five statisti-cal reasoning levels and four constructs. A statististatisti-cal reasoning assessment tool was then cre-ated based upon this initial framework, which was employed during the task-based interview [12]. Subsequently, the responses given by the students were analyzed, and the initial frame-work was refined accordingly. However, the characteristics of statistical reasoning cannot be determined from the responses, given the inappropriate statistical reasoning assessment tool items. For instance, in response to one of the initial items for describing data, ‘What are the highest and lowest amounts of proteins (in grams) for various fast food sandwiches?’, the stu-dents simply stated the highest and lowest values; therefore, their actual statistical reasoning could not be assessed. Therefore, the phrase ‘explain your answer’ was added to that question to elicit more information regarding their statistical reasoning. In addition, the earlier refine-ment of the framework was inadequate because the descriptors for Levels 2 and 3 were similar, making it difficult to clearly determine the students’ statistical reasoning levels. Some of the descriptors also did not closely reflect the definitions of the five levels of statistical reasoning. For example, the initial descriptors of Level 2 and 3 for organizing and reducing data were ‘pro-vides oral statements when organizing the data into a computer system but is only partly cor-rect’ and ‘organizes the data into a computer system with major mistakes’, respectively. Determining the students’ responses under these two descriptors was difficult because partially correct answers were somewhat similar to major mistakes. To match the definition of verbal reasoning, the descriptor of Level 3 was changed to ‘unable to relate to the actual data or graph’. Hence, both the framework and the statistical reasoning assessment tool were revised. The task-based interview was performed a second time using the revised assessment tool, and the statistical reasoning levels of the students were re-examined based on the refined frame-work. The appropriateness of the descriptors in assessing the statistical reasoning levels vali-dated the statistical reasoning framework. The process of validating the framework was modified from earlier studies [11,16,40–43] and can be described as follows:
1. Construct the statistical reasoning assessment tool based on the initial framework;
2. Interview the students using the statistical reasoning assessment tool;
3. Analyze the students’ responses to the statistical reasoning assessment tool;
4. Refine the initial framework descriptors and revise the statistical reasoning assessment tool;
Table 1. Initial Statistical Reasoning Framework.
Construct Level Level 1 Idiosyncratic Level 2 Verbal Level 3 Transitional Level 4 Procedural Level 5 Integrated Process
Describing Data D1L1 D1L2 D1L3 D1L4 D1L5
Does not extract and generate idiosyncratic or relevant information from the data or graph
Extracts and generates some information from the data or graph verbally, but interpretation is ambiguous or unclear
Extracts and generates one or two dimensions of information from the data or graph
Extracts and generates information from the data or graph correctly
Extracts and generates information from the data or graph completely
D2L1 D2L2 D2L3 D2L4 D2L5
Does not show awareness of the displayed attributes of graphical representation
Shows awareness of the displayed attributes of graphical representation orally but is only partly correct
Shows little awareness of the displayed attributes of graphical representation
Shows some awareness of the displayed attributes of graphical representation
Shows complete awareness of the displayed attributes of graphical representation
D3L1 D3L2 D3L3 D3L4 D3L5
Does not recognize general features of the graphical representation
Recognizes general features of the graphical representation in words but is only partly accurate
Recognizes one or two general features of the graphical representation
Recognizes general features of the graphical representation accurately
Recognizes general features of the graphical representation completely Organizing and
Reducing Data
O1L1 O1L2 O1L3 O1L4 O1L5
Unable to organize the data into a computer system
Provides oral statements when organizing the data into a computer system but is only partly correct
Organizes the data into a computer system with major mistakes
Organizes the data into a computer system with minor mistakes
Organizes the data into a computer system correctly
O2L1 O2L2 O2L3 O2L4 O2L5
Unable to reduce the data using measures of central tendency, either by calculation or aided by technology
Reduces the data using measures of central tendency in words, either by calculation or aided by technology, but is accurate only to some extent
Reduces the data using measures of central tendency with major errors, either by calculation or aided by technology
Reduces the data using measures of central tendency with minor errors, either by calculation or aided by technology
Reduces the data using measures of central tendency completely, either by calculation or aided by technology
O3L1 O3L2 O3L3 O3L4 O3L5
Unable to reduce the data using measures of spread, either by calculation or aided by technology
Reduces the data using measures of spread orally, either by calculation or aided by technology, but is accurate only to some extent
Reduces the data using measures of spread with major faults, either by calculation or aided by technology
Reduces the data using measures of spread with minor faults, either by calculation or aided by technology
Reduces the data using measures of spread completely, either by calculation or aided by technology
Representing Data
R1L1 R1L2 R1L3 R1L4 R1L5
Demonstrates data sets graphically using the computer without precise display
Provides verbal statements when demonstrating data sets graphically using the computer but is only partially correct
Demonstrates data sets graphically using the computer with major errors
Demonstrates data sets graphically using the computer with minor errors
Demonstrates data sets graphically using the computer with a valid display
R2L1 R2L2 R2L3 R2L4 R2L5
Does not identify different
representations for the same data set
Identifies different representations for the same data set in words but is only partially accurate
Identifies one or two aspects of different representations for the same data set
Identifies different representations for the same data set correctly
Identifies different representations for the same data set in a complete and comprehensive way
R3L1 R3L2 R3L3 R3L4 R3L5
Does not judge the effectiveness of two different
representations for the same data set
Judges the effectiveness of two different
representations for the same data set orally but is only partially correct
Judges one or two elements of the effectiveness of two different representations for the same data set
Judges the effectiveness of two different
representations for the same data set accurately
Judges the effectiveness of two different representations for the same data set completely
6. Scrutinize the statistical reasoning levels of the students for each construct in the refined framework;
7. Inspect the consistency of the students’ statistical reasoning levels across the four constructs; and
8. Distinguish the attributes of each statistical reasoning level.
Participants
In the present study, ten tenth-grade students participated in task-based interviews. The num-ber of participants used for framework validation in earlier studies [11,16,40–43] was between six and ten students. Among the participants, five were Chinese, three were Malay, and two were Indian. The students came from a secondary school in Johor, Malaysia, and all of them were sixteen years old.
Initially, the researcher sought consent from the Malaysian Ministry of Education and the Johor Education Department to conduct the research at the selected school. The researcher then obtained permission from the school headmaster and teachers for their students to participate in this study by showing them the approval letters from the Malaysian Ministry of Education and the Johor Education Department. The researcher asked the students to obtain written consent from their parents or guardians to participate in this study. Ten students were able to participate in this study; their approval letters and written informed consent letters were documented.
The participants were selected purposely to participate in this study because they already had prior knowledge about basic statistics. The topics that they had learned included the concept of class interval, the mode and mean of grouped data, cumulative frequency and measures of dis-persion. The students had also been taught to present and interpret data in frequency polygons to solve problems and to use measures of central tendency and dispersion. However, these topics are to be covered within a month and are taught using conventional instructions based on the same textbooks in the school. Because of ethical issues, the privacy and anonymity of the partici-pants are maintained in this study by assigning pseudonyms (S1 to S10) to each participant. Table 1. (Continued)
Construct Level Level 1 Idiosyncratic Level 2 Verbal Level 3 Transitional Level 4 Procedural Level 5 Integrated Process
Analyzing and Interpreting Data
A1L1 A1L2 A1L3 A1L4 A1L5
Does not make comparisons within the same data sets
Makes some comparisons within the same data sets verbally, but comparisons are incomplete
Makes one or two comparisons within the same data sets
Makes comparisons within the same data sets correctly
Makes comparisons within the same data sets completely
A2L1 A2L2 A2L3 A2L4 A2L5
Does not make comparisons between two different data sets
Makes comparisons between two different data sets in words, but comparisons are somewhat incorrect
Makes one or two comparisons between two different data set
Makes comparisons between two different data sets accurately
Makes comparisons between two different data sets completely
A3L1 A3L2 A3L3 A3L4 A3L5
Does not make predictions, inferences or conclusions from the data or graphs
Makes predictions, inferences or conclusions from the data or graphs in words, but these are incomplete
Makes one or two predictions, inferences or conclusions from the data or graphs
Makes predictions, inferences or conclusions from the data or graphs in an appropriate way
Makes predictions, inferences or conclusions from the data or graphs in a complete and comprehensive way
[image:7.612.35.580.91.302.2]Instrumentation
After the initial statistical reasoning framework was developed, the statistical reasoning assess-ment tool was constructed to refine and validate the framework. This assessassess-ment tool was designed based on the initial statistical reasoning framework to evaluate students’ statistical reasoning levels across the four constructs. The topics of descriptive statistics covered in this assessment tool were measures of central tendency and measures of variability. This assessment tool contained five tasks, with 56 items in total. Each item was associated with the sub-pro-cesses of four main constructs. The initial validation of this assessment tool, including content validity and inter-coder reliability, was performed in a previously published study [12]. The assessment tool was thus employed in the first task-based interview.
After the first task-based interview, the statistical reasoning assessment tool was revised because many items were found to be incapable of assessing the students’ statistical reasoning levels. The number of items was also reduced to 51 after the revision. The revised statistical rea-soning assessment tool was employed in the second task-based interview. The amendment of this assessment tool is discussed in the findings section.
Data Collection
In this study, data were collected via individual task-based interviews. As asserted by Goldin [44], task-based interviews play a crucial role as a research-based tool for assessing the subject matter. During the task-based interview, a statistical reasoning assessment tool was given to the students, who were then asked to work through the tasks using the computer when needed and to write down their answers on the answer sheets. The interviews were conducted either at school or at students’ homes, and the duration of the interview was two to three hours. The ses-sions were video-taped using a video camcorder, and the recordings were then transcribed, tab-ulated, and coded using NVivo 10 software.
Data Analysis
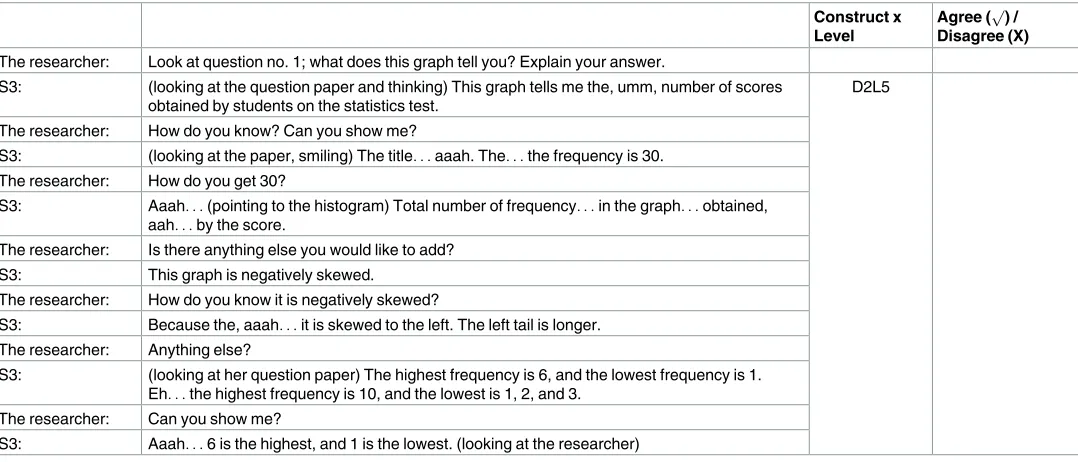
The interview protocol was coded based on the descriptors of the refined statistical reasoning framework. Two raters evaluated the coding of the interview protocol for all students in five tasks. An example of coding for D2L5 (construct X Level) for the interview protocol is shown inTable 2. The raters had to select (p) if they agreed and (X) if they disagreed with this cod-ing. The intercoder reliability was then computed according to their agreement. Cohen’s kappa was also calculated. Discussion continued until consensus was attained on dissimilar judgements on the coded responses. The same steps were replicated after the second task-based interview was conducted. The percentage of agreement was marked at 95.1%, which meant that the interview protocol was rationally reliable because it had passed the designated 70% threshold [45]. The value of Cohen’s kappa was 0.79, which was deemed good because it exceeded 0.7 [46].
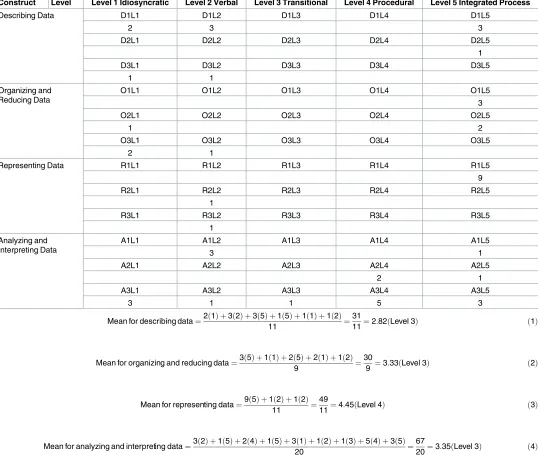
Statistical reasoning levels among the students were determined by calculating mean values for the codes. InTable 3, for describing data, Level 1 of D1 was multiplied by 2, Level 2 of D1 was multiplied by 3, Level 5 of D1 was multiplied by 3, Level 5 of D2 was multiplied by 1, Level 1 of D3 was multiplied by 1, and Level 2 of D3 was multiplied by 1. Subsequently, the
researcher summed all the products and obtained a total sum of 31. This sum was then divided by the total number of items for describing data (11) to obtain the mean of 2.82, as shown in
to obtain a mean of 3.33, as displayed inTable 3(2). For representing data, Level 5 of R1 was multiplied by 9, Level 2 of R2 was multiplied by 1, and Level 2 of R3 was multiplied by 1. Next, each product was summed to obtain 49, which was divided by 11 (the total number of items for representing data) to yield a mean of 4.45, as demonstrated inTable 3(3). For analyzing and interpreting data, Level 2 of A1 was multiplied by 3, Level 5 of A1 was multiplied by 1, Level 4 of A2 was multiplied by 2, Level 5 of A2 was multiplied by 1, Level 1 of A3 was multiplied by 3, Level 2 of A3 was multiplied by 1, Level 3 of A3 was multiplied by 1, Level 4 of A3 was multi-plied by 5, and Level 5 of A3 was multimulti-plied by 3. The total sum of the products (67) was divided by 20 (the total number of items for analyzing and interpreting data) to achieve a mean of 3.35, as indicated inTable 3(4).
A student was considered to have achieved Level 2 statistical reasoning if the mean was larger than 1.5 but less than or equal to 2.5. If the mean was larger than 2.5 but less than or equal to 3.5, a student was regarded as having Level 3 statistical reasoning, and so forth. For example, inTable 3, student S8 achieved a mean of 2.82 for describing data, which means that S8 was classified under Level 3. The mean value obtained by S8 for organizing and reduc-ing data was 3.33: hence, she was at Level 3. Meanwhile, for representreduc-ing data, her response was categorized as Level 4, with a mean of 4.45. Her response for analyzing and interpreting data was categorized as Level 3, with a mean of 3.35. After the statistical reasoning level of each student across the four constructs had been determined, the steadiness of their statistical reasoning levels was examined to ensure the consistency of the framework. Examples of each construct for the five levels are provided. All these data supported the validity of the refined statistical reasoning framework.
Findings
Refinements of the Framework
[image:9.612.37.576.87.318.2]The students’ responses from the first and second task-based interviews were used to refine the descriptors of the initial statistical reasoning framework. Two major refinements were made. Table 2. Table for interview protocol.
Construct x Level
Agree (p) / Disagree (X)
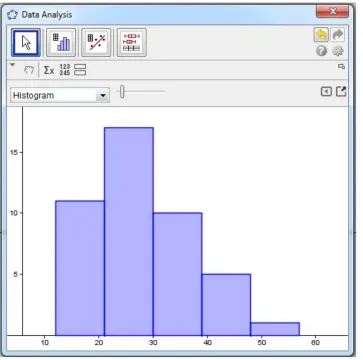
The researcher: Look at question no. 1; what does this graph tell you? Explain your answer.
S3: (looking at the question paper and thinking) This graph tells me the, umm, number of scores obtained by students on the statistics test.
D2L5 The researcher: How do you know? Can you show me?
S3: (looking at the paper, smiling) The title. . .aaah. The. . .the frequency is 30. The researcher: How do you get 30?
S3: Aaah. . .(pointing to the histogram) Total number of frequency. . .in the graph. . .obtained, aah. . .by the score.
The researcher: Is there anything else you would like to add? S3: This graph is negatively skewed.
The researcher: How do you know it is negatively skewed?
S3: Because the, aaah. . .it is skewed to the left. The left tail is longer. The researcher: Anything else?
S3: (looking at her question paper) The highest frequency is 6, and the lowest frequency is 1. Eh. . .the highest frequency is 10, and the lowest is 1, 2, and 3.
The researcher: Can you show me?
S3: Aaah. . .6 is the highest, and 1 is the lowest. (looking at the researcher)
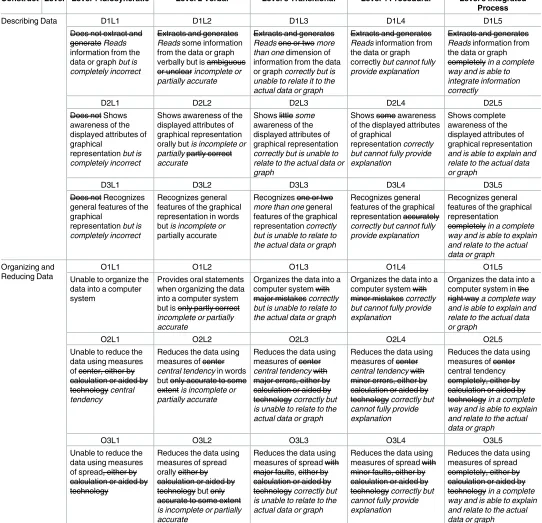
The first involved altering the existing descriptors to be equivalent to the student responses in the interviews. The second refinement involved inserting new phrases into the initial frame-work to reduce distinctions and discrepancies between the student responses and the initial framework. The refined statistical reasoning framework is shown inTable 4, which presents the modified descriptors in italic font and the removed descriptors in strikethrough.
[image:10.612.38.577.93.548.2]The sub-processes of the framework were also revised. The sub-process of describing data was changed from ‘extracting and generating information from the data or graph’ to ‘reading information from the data or graph’. This change was made because the word ‘reading’ was Table 3. Frequency of codes assigned to S8’s responses.
Construct Level Level 1 Idiosyncratic Level 2 Verbal Level 3 Transitional Level 4 Procedural Level 5 Integrated Process
Describing Data D1L1 D1L2 D1L3 D1L4 D1L5
2 3 3
D2L1 D2L2 D2L3 D2L4 D2L5
1
D3L1 D3L2 D3L3 D3L4 D3L5
1 1
Organizing and Reducing Data
O1L1 O1L2 O1L3 O1L4 O1L5
3
O2L1 O2L2 O2L3 O2L4 O2L5
1 2
O3L1 O3L2 O3L3 O3L4 O3L5
2 1
Representing Data R1L1 R1L2 R1L3 R1L4 R1L5
9
R2L1 R2L2 R2L3 R2L4 R2L5
1
R3L1 R3L2 R3L3 R3L4 R3L5
1 Analyzing and
Interpreting Data
A1L1 A1L2 A1L3 A1L4 A1L5
3 1
A2L1 A2L2 A2L3 A2L4 A2L5
2 1
A3L1 A3L2 A3L3 A3L4 A3L5
3 1 1 5 3
Mean for describing data¼2ð1Þ þ3ð2Þ þ3ð5Þ þ1ð5Þ þ1ð1Þ þ1ð2Þ
11 ¼
31
11¼2:82ðLevel 3Þ ð1Þ
Mean for organizing and reducing data¼3ð5Þ þ1ð1Þ þ2ð5Þ þ2ð1Þ þ1ð2Þ
9 ¼
30
9 ¼3:33ðLevel 3Þ ð2Þ
Mean for representing data¼9ð5Þ þ1ð2Þ þ1ð2Þ
11 ¼
49
11¼4:45ðLevel 4Þ ð3Þ
Mean for analyzing and interpreting data¼3ð2Þ þ1ð5Þ þ2ð4Þ þ1ð5Þ þ3ð1Þ þ1ð2Þ þ1ð3Þ þ5ð4Þ þ3ð5Þ
20 ¼
67
20¼3:35ðLevel 3Þ ð4Þ
Table 4. Refinements of the Statistical Reasoning Framework.
Construct Level Level 1 Idiosyncratic Level 2 Verbal Level 3 Transitional Level 4 Procedural Level 5 Integrated Process
Describing Data D1L1 D1L2 D1L3 D1L4 D1L5
Does not extract and generate Reads information from the data or graph but is
completely incorrect
Extracts and generates
Reads some information
from the data or graph verbally but is ambiguous or unclear incomplete or
partially accurate
Extracts and generates
Reads one or two more than one dimension of
information from the data or graph correctly but is
unable to relate it to the actual data or graph
Extracts and generates
Reads information from
the data or graph correctly but cannot fully
provide explanation
Extracts and generates
Reads information from
the data or graph completely in a complete
way and is able to integrate information correctly
D2L1 D2L2 D2L3 D2L4 D2L5
Does not Shows awareness of the displayed attributes of graphical
representation but is
completely incorrect
Shows awareness of the displayed attributes of graphical representation orally but is incomplete or
partially partly correct accurate
Shows little some awareness of the displayed attributes of graphical representation
correctly but is unable to relate to the actual data or graph
Shows some awareness of the displayed attributes of graphical
representation correctly
but cannot fully provide explanation
Shows complete awareness of the displayed attributes of graphical representation
and is able to explain and relate to the actual data or graph
D3L1 D3L2 D3L3 D3L4 D3L5
Does not Recognizes general features of the graphical
representation but is
completely incorrect
Recognizes general features of the graphical representation in words but is incomplete or partially accurate
Recognizes one or two
more than one general
features of the graphical representation correctly
but is unable to relate to the actual data or graph
Recognizes general features of the graphical representation accurately
correctly but cannot fully provide explanation
Recognizes general features of the graphical representation
completely in a complete
way and is able to explain and relate to the actual data or graph
Organizing and Reducing Data
O1L1 O1L2 O1L3 O1L4 O1L5
Unable to organize the data into a computer system
Provides oral statements when organizing the data into a computer system but is only partly correct
incomplete or partially accurate
Organizes the data into a computer system with major mistakes correctly
but is unable to relate to the actual data or graph
Organizes the data into a computer system with minor mistakes correctly
but cannot fully provide explanation
Organizes the data into a computer system in the right way a complete way
and is able to explain and relate to the actual data or graph
O2L1 O2L2 O2L3 O2L4 O2L5
Unable to reduce the data using measures of center, either by calculation or aided by technology central
tendency
Reduces the data using measures of center
central tendency in words
but only accurate to some extent is incomplete or
partially accurate
Reduces the data using measures of center
central tendency with
major errors, either by calculation or aided by technology correctly but
is unable to relate to the actual data or graph
Reduces the data using measures of center
central tendency with
minor errors, either by calculation or aided by technology correctly but
cannot fully provide explanation
Reduces the data using measures of center central tendency completely, either by calculation or aided by technology in a complete
way and is able to explain and relate to the actual data or graph
O3L1 O3L2 O3L3 O3L4 O3L5
Unable to reduce the data using measures of spread, either by calculation or aided by technology
Reduces the data using measures of spread orally either by calculation or aided by technology but only accurate to some extent
is incomplete or partially accurate
Reduces the data using measures of spread with major faults, either by calculation or aided by technology correctly but
is unable to relate to the actual data or graph
Reduces the data using measures of spread with minor faults, either by calculation or aided by technology correctly but
cannot fully provide explanation
Reduces the data using measures of spread completely, either by calculation or aided by technology in a complete
way and is able to explain and relate to the actual data or graph
deemed more suitable for direct problems, such as finding the highest and lowest values from the data or graph. With respect to the sub-process of organizing and reducing data, the phrase ‘either by calculation or aided by technology’ was eliminated because some questions were no longer part of the sub-processes of the constructs, as they were not useful for assessing students’ statistical reasoning. An example is the question that required students to record values from Table 4. (Continued)
Construct Level Level 1 Idiosyncratic Level 2 Verbal Level 3 Transitional Level 4 Procedural Level 5 Integrated Process
Representing Data
R1L1 R1L2 R1L3 R1L4 R1L5
Demonstrates data sets graphically using the computer without precise display
Provides verbal statements when demonstrating data sets graphically using the computer but only is
incomplete or partially
correct accurate
Demonstrates data sets graphically using the computer with major errors correctly but is
unable to relate to the actual data or graph
Demonstrates data sets graphically using the computer with minor errors correctly but
cannot fully provide explanation
Demonstrates data sets graphically using the computer with a valid display in a complete way
and is able to explain and relate to the actual data or graph
R2L1 R2L2 R2L3 R2L4 R2L5
Does not Identifies different
representations for the same data set but is
completely incorrect
Identifies different representations for the same data set in words but only is incomplete or partially accurate
Identifies one or two more
than one aspect of
different representations for the same data set
correctly but is unable to relate to the actual data or graph
Identifies different representations for the same data set in the correct way correctly but
cannot fully provide explanation
Identifies different representations for the same data set in a complete way and comprehensive way is
able to explain and relate to the actual data or graph
R3L1 R3L2 R3L3 R3L4 R3L5
Does not Judges the effectiveness of two different
representations for the same data set but is
completely incorrect
Judges the effectiveness of two different
representations for the same data set orally but
is incomplete or partially
correct accurate
Judges one or two more
than one effectiveness of
two different
representations for the same data set correctly
but is unable to relate to the actual data or graph
Judges the effectiveness of two different
representations for the same data set accurately
correctly but cannot fully provide explanation
Judges the effectiveness of two different
representations for the same data set completely
in a complete way and is able to explain and relate to the actual data or graph
Analyzing and Interpreting Data
A1L1 A1L2 A1L3 A1L4 A1L5
Does not Makes comparisons within the same data sets but is
completely incorrect
Makes some
comparisons within the same data sets verbally but is incomplete or
partially accurate
Makes one or two more
than one comparison
within the same data sets
correctly but is unable to relate to the actual data or graph
Makes comparisons within the same data sets correctly but cannot fully
provide explanation
Makes comparisons within the same data sets completely in a complete
way and is able to explain and relate to the actual data or graph
A2L1 A2L2 A2L3 A2L4 A2L5
Does not Makes comparisons between two different data sets
but is completely incorrect
Makes comparisons between two different data sets in words but is somewhat incorrect
incomplete or partially accurate
Makes one or two more
than one comparison
between two different data sets correctly but is
unable to relate to the actual data or graph
Makes comparisons between two different data sets accurately
correctly but cannot fully provide explanation
Makes comparisons between two different data sets completely in a
complete way and is able to explain and relate to the actual data or graph
A3L1 A3L2 A3L3 A3L4 A3L5
Does not Makes a prediction, inference or conclusion from the data or graphs but is
completely incorrect
Makes a prediction, inference or conclusion from the data or graphs in words but is incomplete
or partially accurate
Makes one or two a prediction, inference or conclusion from the data or graphs correctly but is
unable to relate to the actual data or graph
Makes a prediction, inference or conclusion from the data or graphs in the appropriate way
correctly but cannot fully provide explanation
Makes a prediction, inference or conclusion from the data or graphs in a complete and
comprehensive way and
is able to explain and relate to the actual data or graph
[image:12.612.37.578.90.614.2]the computer. Moreover, the word ‘center’ confused the students while they were solving the tasks; thus, it was altered to ‘measures of central tendency’.
Refinements of describing data. The phrase ‘but completely inaccurate’ was added to the descriptors of D1, D2 and D3 to be consistent with the definition of idiosyncratic reasoning. This adjustment was made because the students had solved the tasks incorrectly. In addition, the phrase ‘ambiguous or unclear’ was changed to ‘incomplete or partially accurate’ at Level 2 of D1 because student responses were at times incomplete or only partially correct although they were able to attain precise information from the data or graph. Furthermore, some stu-dents were capable of gleaning more than a single piece of information from the data or graph. Thus, the descriptor of D1L3 was changed from ‘one or two dimensions’ to ‘more than one dimension’. Moreover, the phrase ‘are incomplete’ was added to D2L2 and D3L2. This change was made because students could not provide sufficient responses concerning the graph, even when they were probed by the researcher. Additionally, ‘some’ was used to replace ‘little’ in D2L3, and ‘some’ was erased in D2L4 to correspond to the definition of transitional and proce-dural reasoning.
The descriptor of D3L3, ‘one or two general features’, was modified to ‘more than one gen-eral feature’ because it was inappropriate for an item that asked students to portray the distri-bution of the graph with regard to its shape, as well as measures of central tendency and variability. To match with the definition of transitional reasoning, the phrase ‘correctly but is unable to relate to the actual data or graph’ was added at Level 3. In addition, to match the defi-nition of procedural reasoning, the phrase ‘correctly but cannot fully provide an explanation’ was inserted into Level 4. At Level 5 of D1, the phrase ‘in a complete way and is able to inte-grate information correctly’ was added because the students were required to read the informa-tion completely and incorporate it accurately. Addiinforma-tionally, the phrase ‘and is able to explain and relate to the actual data or graph’ was included because the students had to achieve Levels 3 and 4 before reaching Level 5, which was related to interpreting the data or graph and giving justification.
Refinements of organizing and reducing data. Some items were no longer linked to any sub-processes of O2 or O3, but they were retained in the statistical reasoning assessment tool because those items (for example, the item that required students to mark the check box and record values from the computer) involved only procedural steps and could not elicit students’ statistical reasoning. Therefore, in each descriptor of O2 and O3, the phrase ‘either by calcula-tion or aided by technology’ was removed. To match the definicalcula-tion of statistical reasoning lev-els, new phrases were inserted into other descriptors of organizing and reducing data.
Refinements of representing data. The descriptor of R2L3 was modified from ‘one or two aspects’ to ‘more than one aspect’ because some students were able to provide more than two aspects when solving the item asking them to explain how the box plot was associated with its corresponding histogram. Moreover, the phrase ‘judges one or two elements of effectiveness’ was changed to ‘judges more than one effectiveness’, as students were expected to give their opinions and reasoning comprehensively. In addition, other descriptors were edited to reflect the definition of statistical reasoning levels more closely.
Amendment of Statistical Reasoning Assessment Tool
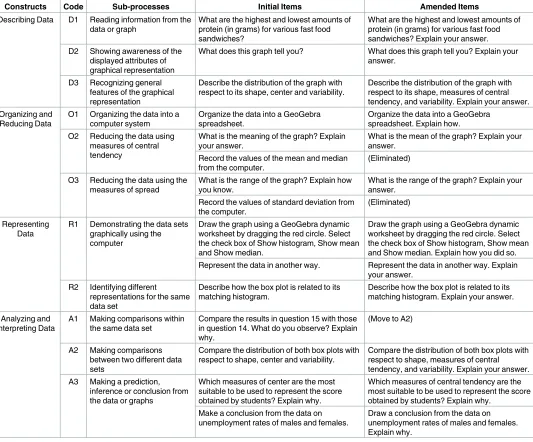
[image:14.612.42.575.248.690.2]In the first interview, the researcher found that many items in the technology-based statistical reasoning assessment tool failed to assess students’ statistical reasoning ability. As a result, those items were again amended for use in the second interview. For describing data, the phrase ‘Explain your answer’ was added to each item, as displayed inTable 5. For instance, for the initial item ‘What are the highest and lowest amounts of protein (in grams) for various fast food sandwiches?’, the students were only able to mention the highest and lowest values; thus, their reasoning could not be traced. By adding the phrase ‘Explain your answer’, the students were given the opportunity to elaborate on how they had obtained the answer and more clearly demonstrate how they made sense of the statistical ideas.
Table 5. Examples of amended items for four constructs.
Constructs Code Sub-processes Initial Items Amended Items
Describing Data D1 Reading information from the data or graph
What are the highest and lowest amounts of protein (in grams) for various fast food sandwiches?
What are the highest and lowest amounts of protein (in grams) for various fast food sandwiches? Explain your answer. D2 Showing awareness of the
displayed attributes of graphical representation
What does this graph tell you? What does this graph tell you? Explain your answer.
D3 Recognizing general features of the graphical representation
Describe the distribution of the graph with respect to its shape, center and variability.
Describe the distribution of the graph with respect to its shape, measures of central tendency, and variability. Explain your answer. Organizing and
Reducing Data
O1 Organizing the data into a computer system
Organize the data into a GeoGebra spreadsheet.
Organize the data into a GeoGebra spreadsheet. Explain how. O2 Reducing the data using
measures of central tendency
What is the meaning of the graph? Explain your answer.
What is the mean of the graph? Explain your answer.
Record the values of the mean and median from the computer.
(Eliminated) O3 Reducing the data using the
measures of spread
What is the range of the graph? Explain how you know.
What is the range of the graph? Explain your answer.
Record the values of standard deviation from the computer.
(Eliminated) Representing
Data
R1 Demonstrating the data sets graphically using the computer
Draw the graph using a GeoGebra dynamic worksheet by dragging the red circle. Select the check box of Show histogram, Show mean and Show median.
Draw the graph using a GeoGebra dynamic worksheet by dragging the red circle. Select the check box of Show histogram, Show mean and Show median. Explain how you did so. Represent the data in another way. Represent the data in another way. Explain
your answer. R2 Identifying different
representations for the same data set
Describe how the box plot is related to its matching histogram.
Describe how the box plot is related to its matching histogram. Explain your answer. Analyzing and
Interpreting Data
A1 Making comparisons within the same data set
Compare the results in question 15 with those in question 14. What do you observe? Explain why.
(Move to A2)
A2 Making comparisons between two different data sets
Compare the distribution of both box plots with respect to shape, center and variability.
Compare the distribution of both box plots with respect to shape, measures of central tendency, and variability. Explain your answer. A3 Making a prediction,
inference or conclusion from the data or graphs
Which measures of center are the most suitable to be used to represent the score obtained by students? Explain why.
Which measures of central tendency are the most suitable to be used to represent the score obtained by students? Explain why.
Make a conclusion from the data on unemployment rates of males and females.
Draw a conclusion from the data on unemployment rates of males and females. Explain why.
For organizing and reducing data, variations of the phrase ‘Explain how you did so’ were also added to the item that asked the students to organize the data into the GeoGebra spread-sheet. The students were required to explain how they entered data into the computer step by step. The phrase ‘Explain your answer’ was also added to other items. For instance, in the ques-tion that involved finding the standard deviaques-tion, the students were required to perform some calculations to obtain the answer. They then had to explain how they had obtained the answer and what they understood about standard deviation. Furthermore, the items in O2 and O3 that asked the students to record values from the computer were eliminated because these items involved only stating practical steps that did not require statistical reasoning.
InTable 5, most items for representing data were altered by adding variations of the phrase ‘Explain how’. This change was made because the students were expected to clarify how they had created the graphical representations step by step. For example, when the students were asked to draw the frequency polygon, they had to construct it using a GeoGebra spreadsheet and then elucidate the steps to construct it. Some items for analyzing and interpreting data were amended as well, as displayed inTable 5. Initially, the item ‘Compare the results in ques-tion 15 with those in quesques-tion 14. What do you observe? Explain why’ was wrongly included under A1 because the researcher thought that the results in questions 15 and 14 were the same data set. However, because they were actually two different data sets, the item was then moved to A2 after two students each obtaining a score of 1 were added to the graph. The phrase ‘Explain why’ was also added to several items because the students were expected to explicate their reasoning. For example, in the item ‘Draw a conclusion from the data on unemployment rates of males and females’, the students were expected to not only draw the conclusion but also explain their conclusion.
Analysis of Statistical Reasoning Levels for Students across Four
Constructs
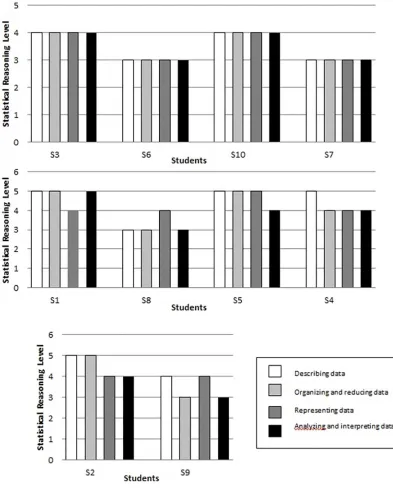
Fig 1demonstrates the statistical reasoning levels among the students across the four con-structs. The figure shows that four students (S3, S6, S7, and S10) had stable statistical reasoning levels for the four constructs. These students had the same capability in describing data, orga-nizing and reducing data, representing data, and analyzing and interpreting data. Furthermore, we found that four students (i.e., S1, S8, S5, and S4) had the same statistical reasoning levels for three constructs. One of the constructs was lower or higher than the other three. For instance, student S1 appeared to be at Level 5 in describing data, organizing and reducing data, and ana-lyzing and interpreting data but was at Level 4 in representing data. Moreover, two students possessed the same statistical reasoning levels for two constructs, namely, S2 and S9. These stu-dents achieved Level 4 in describing data and representing data and Level 3 in organizing and reducing data as well as in analyzing and interpreting data. This result indicates that these two students had inconsistent statistical reasoning levels across the four constructs.
In general, the students’ statistical reasoning levels indicated strong internal consistency across the four constructs, as eight of the ten students achieved consistency in the four structs. Thus, 80% of the students had reached the same levels for at least three of the four con-structs. As claimed by Jones et al. [11], improving the cohesion of the framework crucially involves ensuring stable and consistent statistical reasoning levels of the students.
Analysis of Statistical Reasoning at Each Level
Level 1 summary. As illustrated inFig 1, no student was categorized as Level 1, idiosyn-cratic reasoning, but some responses from the students were at this level. As previously hypoth-esized, the characteristics of students at Level 1 are similar to the elements of the prestructural level of the SOLO model in the ikonic mode.
[image:16.612.170.563.78.566.2]With respect to describing data, the evidence showed that the students could read the infor-mation from the data or graph, but their solution was wrong. They also displayed awareness of the graphical characteristics presented and were able to recognize the common features in the graphs, although they did so incorrectly. For instance, when student S8 was attempting to solve Fig 1. Students’ statistical reasoning levels across four constructs.
a question in Task 5 that involved finding the highest and lowest number of weeks needed to finish reading a storybook, she was not aware that the x-axis signified the number of weeks; she referred to the y-axis instead, as revealed in the following excerpt from her interview protocol. This error was also found in the study by Cooper and Shore [27].
The researcher: Look at the question: The following graphs illustrate the number of weeks used by the students from class 4A and 4B to finish reading a storybook. Question no. 1. What are the highest and lowest number of weeks used by the students from class 4A to fin-ish reading a storybook? Explain your answer.
S8: (Looking at her paper) The highest number of week is 6, and the lowest number is 2. The researcher: Can you show me how you got the answer?
S8: (Pointing to the histogram on the paper) it. . .this is the highest number, and this is the lowest number.
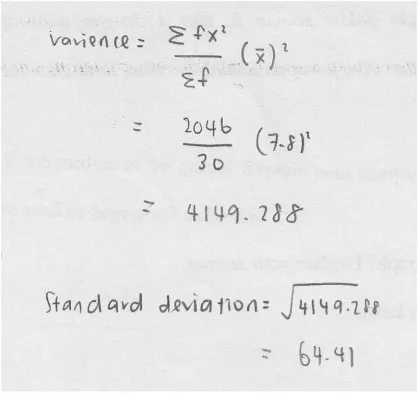
In relation to organizing and reducing data, the students were incapable of organizing the data into the GeoGebra spreadsheet, and they inaccurately reduced the data using measures of central tendency and variability. For example, S8 attempted to calculate the standard deviation of the graph in Task 1, but the wrong formula was used because she missed a minus sign, as dis-played inFig 2. Such mistakes corroborated the findings by Kourkoulus and Tzanakis [47], who discovered that their students did not understand standard deviation, as they were unable to calculate standard deviation when the formula was not given.
For representing data, the students failed to draw proper graphs using a computer. Addi-tionally, they were unable to recognize different representations of the same data set. The stu-dents were also incapable of evaluating the efficiency of two different demonstrations for the same data set. For instance, the frequency polygon was wrongly illustrated by student S4 in Task 2 because he could not differentiate between the histogram and the frequency polygon, as illustrated inFig 3.
With regard to analyzing and interpreting data, the students could not accurately make comparisons within the same data set and between two different data sets. Moreover, they failed to draw correct conclusions, predictions or inferences from the data or graph. To illus-trate this point, student S5 made an incorrect prediction for Task 5 because she perceived that the histogram with a flat and smooth distribution had a smaller standard deviation than the histogram with bars of dissimilar height, as shown in the following interview protocol. This type of mistake was also reported by Garfield, delMas, and Chance [48].
The researcher: Next. Umm. . .The teacher did a survey of the number of weeks used by the students from class 4A and 4B to finish reading a book during the school holidays. The fol-lowing data indicated the results of the survey. Question no. 7, Predict which class has the larger standard deviation. Explain why.
S5: Class 4B because. . . The researcher: Why?
S5: I think because class 4B will be more spread out than class 4A. The researcher: Can you show me how you know it is more spread out?
Level 2 summary. Similar to the results for Level 1, idiosyncratic reasoning, no student was categorized at Level 2, verbal reasoning. Nevertheless, reasoning at this level was shown in some of the students’ responses. As noted earlier, this level is consistent with the unistructural level of the SOLO model at the concrete symbolic mode.
[image:18.612.157.577.79.473.2]In describing data, students at this level could read some of the information from the data or graph verbally, but it was incomplete or only partly accurate. In addition, they exhibited incomplete or partly accurate awareness of the displayed features of graphs. The students could recognize general aspects of the graphs, but their responses were incomplete or only partially accurate. In the interview protocol below, for example, student S8 was required to examine the general attributes of a frequency polygon in terms of shape, measures of central tendency and variability in Task 2. She was able to identify the shape correctly (i.e., skewed to the right). However, she could not explain the reason for this shape: she perceived that most of the data were on the right side if it was skewed to the right. This misconception was also observed by Lee, Zeleke and Wachtel [49]. For the measure of central tendency, she asserted that the correct Fig 2. S8’s solution to find the standard deviation of the graph.
answer concerned the mean. However, upon prompting, she altered her response to the median, and she was able to give the correct response: the mean was larger than the median. For the measure of variability, she attempted to use the range, but this response was incorrect because the highest amount was computed incorrectly in the earlier question.
The researcher: Question no. 4, Describe the distribution of the graph in terms of its shape, center and variability. Explain your answer.
S8: (Looking at the screen and her paper) The graph shows. . .the graph is skewed to. . . right.
The researcher: Uh. . .How do you know it is skewed to the right? Can you explain? S8: (Looking at the graph) More concentrated. . .at right. . .
The researcher: Can you show me? Where. . .where is it more concentrated on. . .on the right side? Can you show me? Which one?
S8: (Moving the cursor to the graph on the screen) Is it here? Eh, no. . .(touching her head and pointing her finger at her paper)
The researcher: Box plot? (laughing) S8: (laughing)
[image:19.612.202.565.77.437.2]The researcher: You want to choose the box plot, huh? Fig 3. S4’s construction of a frequency polygon.
S8: Ha. . .(changing the graph on the screen) The researcher: If you want to. . .you can. . .
S8: (Looking at the screen and her paper) Skewed to the right. The graph is skewed to right.
The researcher: Hm. . .can you explain?
S8: (Thinking) The right has. . .right has spread out. . .more, more at the right. The researcher: Then how about. . .how about the center?
S8: The center is. . .median. . .median. . .(looking at the screen) the center is mean 27.625.
The researcher: Can you explain your answer? Show me. . .show me. . .the mean. S8: (Looking at the screen) Median, ha. . .(laughing) center is median.
The researcher: So what is the median? S8: 26.5. . .
The researcher: How about the variability?
S8: The median. . .the mean is larger than the median. . .skewed to the right, and the range. . .the range is 32.
The researcher: Ha. . .Can you explain how you got the 22, ha? S8: (Looking at her paper) 32. . .
The researcher: 32? How do you get it?
S8: By using the larger number minus the lower number (pointing her finger to number 44 and 12)
With respect to organizing and reducing data, the students managed to describe the process of organizing data using the computer, but their answers were incomplete or only partially cor-rect. They reduced the data using measures of central tendency and variability, but their state-ments were also fragmented and somewhat inaccurate. For instance, student S7 could compute the interquartile range in Task 1, but she missed the steps for obtaining the 7.5th observation and the 22.5th observation from the histogram, as displayed inFig 4.
As with representing data, the students could explicate the procedure for drawing the graph using the computer, but their answers were incomplete and only partially accurate. Addition-ally, they could distinguish the different representations and explain the effectiveness of the two representations for the same data set, but their answers were incomplete or only partially correct. For example, student S5 selected the histogram as a better representation when she was asked to choose between the histogram and the box plot in Task 2. Nonetheless, even after probing by the researcher, this student could give only one rationale—which was that the histo-gram could closely depict the shape of the distribution—as the following interview protocol illustrates.
The researcher: Aah. . .Question no. 8, Which graph do you think represents the data bet-ter, the histogram or the box plot? Explain why.
S5: I think the histogram. The histogram shows the shape of the distribution better. The researcher: Any other reason?
S5: No (shaking her head), that’s all.
in stating that the similarities were in the interquartile range and the standard deviation, while the differences were in their mean and median. However, she did not provide any reason for this answer, as presented in the following excerpt from her interview protocol.
The researcher: Umm. . .Question no. 14, are there any similarities or differences between the two graphs produced on the computer? Explain why.
S9: The interquartile range and the standard deviation in both graphs are the same, and the mean and median of the two graphs are different.
The researcher: Why are the interquartile range and the standard deviation the same? S9: (Examining the paper and shaking her head)
The researcher: How about the mean and median? Why are they different? S9: (Examining the paper) They’re influenced by the, aah. . .the. . .(shaking head) The researcher: Is there anything else you might like to add?
S9: (Shaking her head again)
[image:21.612.203.562.77.349.2]Level 3 summary. A number of students were categorized as Level 3, transitional reasoning, for certain constructs. This level was concordant with the multi-structural level of the SOLO model at the concrete symbolic mode, as discussed above. None of the responses for the con-structs of describing data and organizing and reducing data could be categorized at this level. With regard to representing data, the students were able to construct the graphs properly using the computer, but they could not relate them to the actual data. The students could dis-tinguish more than one feature of different depictions for the same data set and evaluate the effectiveness of two depictions for the same data set, but they could not relate them to the actual data or graph. For example, as shown in the following interview protocol, student S9 was Fig 4. S7’s solution to find the interquartile range of the graph.
capable of drawing the stem and leaf plot and providing a step-by-step explanation in Task 4, but she failed to relate the plot to the actual data.
The researcher: OK. Question no. 4. Construct a stem and leaf plot for each set of data. Explain how you did so.
S9: (Holding and clicking the mouse) Highlight the data and click the one variable for analysis and choose the stem and leaf plot.
The researcher: How are the data and the stem and leaf plot related to each other? (point-ing to the screen)
S9: (Examining the screen and then shaking her head)
With reference to analyzing and interpreting data, the students were incapable of relating their answers to the actual data or graph when making comparisons within the same data set and between different data sets. The same problem occurred when they drew conclusions, pre-dictions, or inferences from the data or graph. For example, when student S3 was asked to draw a conclusion from the data on instant noodle consumption for Taiwan and Malaysia in Task 3, he was able to solve the question, but he could not relate his answers to the actual data or graph. In this case, he provided only his own opinion—that Malaysians like instant noodles more than Taiwanese people—as demonstrated in the excerpt from his interview protocol.
The researcher: Question no. 8, Draw a conclusion from the data on instant noodle con-sumption for Malaysia and Taiwan. Explain why.
S3: (looking at his paper and thinking) Malaysia. . .instant noodle consumption for Malaysia is higher than Taiwan.
The researcher: Why is it higher? Explain why? S3: Emm (thinking) because it is needed for. . . The researcher: It is?
S3: Needed. For. . .food (smiling) (look at his paper) The researcher: Any other reason?
S3: Mmm (looking at his paper and thinking) the Malaysian likes to eat instant noodle more than Taiwanese (smiling)
The researcher: Any other reason? S3: Mmm (looking at his paper) no.
Level 4 summary. Several students were categorized under Level 4, procedural reasoning. As stated previously, this level was consistent with the relational level of the SOLO model in the concrete symbolic mode.
The researcher: Question no. 11. Describe the distribution of the graph with respect to its shape, center and variability. Explain your answer.
S2: Shape. . .(Looking at the graph on his paper) the graph is unimodal and negatively skewed to the left. . .and the center. . .
The researcher: Can you explain first how you know it is skewed to the left and unimo-dal?
S2: It only has the higher frequency at one place (pointing to the histogram on the paper) and unimodal (scratching his head) and the graph is. . .and the graph is more compact on the right side, so it is negatively skewed.
The researcher: More compact?
S2: Ha. . .more compact on the right side, so it is negatively skewed. The researcher: Then how about the center?
S2: The mean is lower than the median and the mode. The researcher: Why do you say that?
S2: According to the negative distribution graph, the mean will always be lower than the median and the mode. This is proven by the. . .this calculator [pause] value.
The researcher: How about the variability?
S2: The variability. . .(Looking at his paper) the graph ranges from 1 to 11.
The researcher: Can you tell me more about that? Why do you say 1 to 11? Can you show me?
S2: Because the range is from 1 to 11 (Pointing on his paper) the lowest to the highest.
In organizing and reducing data, the students correctly organized the data on the computer, but they did not provide adequate explanations for their responses. Moreover, they failed to provide justification, although they had successfully reduced the data using measures of central tendency and variability. For instance, when a question for Task 1 asked, ‘What is the range of the graph? Explain your answer’, student S9 was able to obtain the range from the histogram and explain how she arrived at the answer (i.e., subtracting 1 from 11). However, she could not describe the meaning of the range, as displayed in this excerpt from her interview protocol.
The researcher: OK, now we look at question no. 7. What is the range of the graph? Explain your answer.
S9: (Looking at the laptop’s screen) The range is 10. The researcher: Can you explain how you got 10? S9: Eleven. . .(shaking head) Eleven minus one.
The researcher: Aah. . .can you show me how you got it? S9: (Pointing at the screen) This 11. . .minus 1.
The researcher: So, aah. . .What do you mean by range? S9: (Thinking and then shaking her head)