Article
Family Food Security and Children’s Environment:
A Comprehensive Analysis with Structural
Equation Modeling
Che Wan Jasimah bt Wan Mohamed Radzi1 , Huang Hui1,
Nur Anisah Binti Mohamed @ A. Rahman2and Hashem Salarzadeh Jenatabadi1,* 1 Department of Science and Technology Studies, Faculty of Science, University of Malaya,
Kuala Lumpur 50603, Malaysia; [email protected] (C.W.J.b.W.M.R.); [email protected] (H.H.) 2 Institute of Mathematical Sciences, Faculty of Science, University of Malaya, Kuala Lumpur 50603, Malaysia;
* Correspondence: [email protected] or [email protected]; Tel.: +603-7967-4343
Received: 11 April 2017; Accepted: 1 July 2017; Published: 12 July 2017
Abstract:Structural Equation Modeling (SEM) has been used extensively in sustainability studies to model relationships among latent and manifest variables. This paper provides a tutorial exposition of the SEM approach in food security studies and introduces a basic framework based on family food security and children’s environment sustainability. This framework includes family food security and three main concepts representing children’s environment, including children’s BMI, health, and school performance. A detailed description is provided of how SEM is applied in this type of study. The proposed model contains dependent, independent, mediator, and moderator variables. Three latent variables categorized include family food security, children’s health, and children’s school performance, and two manifest variables are children’s body mass index and children’s gender. The samples for this study involve 452 Chinese children aged 7–12. The data analysis outcome indicates that the introduced model is capable of estimating the impact of family food security on children’s environment. The results from this study confirm that the combination of children’s body mass index with children’s health acts as a strong mediator in the relationship between family food security and children’s school performance.
Keywords: food security; classical structural equation modeling; food access; children’s health; children’s BMI; children’s school performance
1. Introduction
Food security is necessary for economic and social stability as well as sustainable development [1]. In the last two decades, food security has become one of the most discussed topics in specific studies, like energy [2], agriculture [3], and public health [4]. Food security has been considered by numerous researchers and is now recognized as a vital tragedy for human society owing to its growing prevalence. This concept has been addressed as a key in estimating children’s health [5,6], children’s BMI [7], and children’s school performance [8]. However, there is lack of study considering the impact of family food security on the relationship among children’s BMI, children’s health, and their school performance.
Correlation analysis [9,10] and regression modeling [11,12] are the most familiar methodologies for analyzing the relationship between food security/insecurity and children’s environment. However, there are some concerns regarding the estimation of these factors based on regression modeling. The presence of multicollinearity among independent variables is the main avoidable problem in this sort of regression modeling. Moreover, this problem has an impact on individual predictors
but no effect on predictive power. In other words, in multiple regression modeling there may be a well-fitted model, but correlated predictors may not produce trustable results of research model coefficients. Moreover, regression modeling does not facilitate estimating causal and indirect effects in a single and integrated equation [13]. Besides, accurate interpretation of the analysis results based on multidimensional modeling is not achievable and the results are not usable for a comprehensive evaluation. In recent years, SEM, a developed modeling technique, has been considered a suitable method of analyzing any normal and causal relationship with lack of multicollinearity among latent (construct) and measurement variables. This methodology is at the same time capable of testing the generated model by evaluating the overall fit indices [14].
The new integrated model suggested illustrates the overall impacts of both observed (children’s BMI) and unobserved indicators (family food security and children’s health) that lead to predicting children’s school performance. Therefore, it is a single model capable of helping researchers to better understand the relations and provide an overall evaluation of the constructs (latent or measurement variables) by utilizing a combination of five characteristics (family food security, children’s health, children’s BMI, children’s school performance, and children’s gender). Moreover, the model proposed in the present study seeks to estimate the independent and mediator variables (food security and children’s health) based on definitions of the latent variables. Ultimately, gender is deemed a moderator in comparing the research model between boys and girls.
2. Materials and Methods
There are 15 public primary schools with over 500 students located in the poor area of Urumqi City, Xinjiang Province. The sampling procedure included three phases. The first phase was cluster sampling, whereby every primary school was considered one cluster. We contacted by email and phone to request their cooperation for this research, and only 5 schools confirmed willingness to participate. To every primary school, 120 questionnaires were delivered. The second phase entailed stratified sampling, where every grade was defined as a stratum. Each primary school includes six grades (six strata), and 15 questionnaires were considered for each grade. The third phase was random sampling from volunteer parents for every grade. Therefore, 5×6×20 = 600 questionnaires comprised the sampling number. 15 bachelor students were trained in public health and management to collect data and interview the parents based on the study survey. The volunteer parents were invited to the schools by the school principals. The parents were also asked to bring their children’s health cards. Each questionnaire took 15 to 20 min. Among 600 distributed questionnaires, we considered 452 questionnaires for final data analysis (148 questionnaires were deleted for incomplete, missing data, and outlier reasons). The survey was conducted with funding by the University of Malaya (project number RP027E-15HNE), and the University of Malaya Research Ethics Committee approved the research procedure (UM.TNC2/RC/H&E/UMREC 127).
indicators among children. Research on the simultaneous integration of the interrelationships among the four well-known concepts into one model also remains scarce.
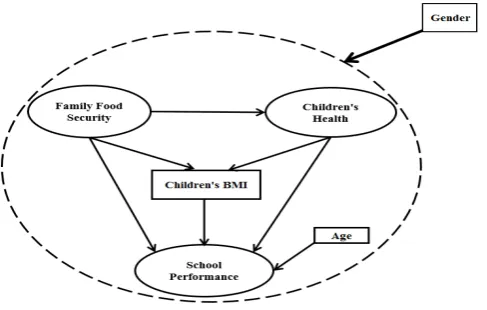
Therefore, six substantial relations among research variables are assessed in the present study. First, the direct relation between food security status and children’s health, as well as food security situation and children’s BMI levels are assessed to determine whether food security may be associated with children’s health and BMI. The second relation studied is the impact of family food security status on children’s school performance, to investigate whether the food security level of the family is related to their children’s school performance, such as school attendance, and mathematics or reading performance. The third relation considers the direct impact of BMI on children’s school performance level. The aim is to understand how children’s BMI status impacts school performance. The fourth direct association regards the impact of children’s health on their BMI status. With this output, it is possible to illustrate whether health is related to the BMI status of children. In this study, the age of the children is considered as a control variable which can be has a significant impact on school performance. Finally, the indirect association between food security status and children’s school performance through children’s health and BMI is analyzed to investigate whether children’s health and BMI serve as mediators between food security status and children’s school performance (see Figure1).
Six important relationships are examined in the form of eight hypotheses as follows:
Hypothesis 1 (H1).Family food security has a significant impact on children’s health. Hypothesis 2 (H2).Family food security has a significant impact on children’s BMI.
Hypothesis 3 (H3).Family food security has a significant impact on children’s school performance. Hypothesis 4 (H4).Children’s health has a significant impact on children’s BMI.
Hypothesis 5 (H5).Children’s health has a significant impact on children’s school performance. Hypothesis 6 (H6).Children’s BMI has a significant impact on children’s school performance.
Hypothesis 7 (H7).The combination of children’s BMI with health is a mediator in the relationship between family food security and children’s school performance.
Hypothesis 8 (H8).Gender is a moderator in the relationship between the family food security and children’s environment indicators.
Sustainability 2017, 9, 1220 3 of 18
Therefore, six substantial relations among research variables are assessed in the present study. First, the direct relation between food security status and children’s health, as well as food security situation and children’s BMI levels are assessed to determine whether food security may be associated with children’s health and BMI. The second relation studied is the impact of family food security status on children’s school performance, to investigate whether the food security level of the family is related to their children’s school performance, such as school attendance, and mathematics or reading performance. The third relation considers the direct impact of BMI on children’s school performance level. The aim is to understand how children’s BMI status impacts school performance. The fourth direct association regards the impact of children’s health on their BMI status. With this output, it is possible to illustrate whether health is related to the BMI status of children. In this study, the age of the children is considered as a control variable which can be has a significant impact on school performance. Finally, the indirect association between food security status and children’s school performance through children’s health and BMI is analyzed to investigate whether children’s health and BMI serve as mediators between food security status and children’s school performance (see Figure 1).
Six important relationships are examined in the form of eight hypotheses as follows:
Hypothesis 1 (H1). Family food security has a significant impact on children’s health.
Hypothesis 2 (H2). Family food security has a significant impact on children’s BMI.
Hypothesis 3 (H3). Family food security has a significant impact on children’s school performance.
Hypothesis 4 (H4). Children’s health has a significant impact on children’s BMI.
Hypothesis 5 (H5). Children’s health has a significant impact on children’s school performance.
Hypothesis 6 (H6). Children’s BMI has a significant impact on children’s school performance.
Hypothesis 7 (H7). The combination of children’s BMI with health is a mediator in the relationship between family food security and children’s school performance.
[image:3.595.179.423.572.727.2]Hypothesis 8 (H8). Gender is a moderator in the relationship between the family food security and children’s environment indicators.
Figure 1. Research Framework.
The initial independent construct and the most important input in this study is family food security. Various techniques were applied to measure food security/insecurity. In this paper, family food security was measured based on the Bickel and Nord [23] study, which involved 18 questions (See Supplementary Materials). The focus of this study is on very low food security and refers to nine descriptive questions (questions 1, 2, 3, 5, 10, 11, 12, 13, and 17). A nine-point Likert scale was considered to measure every indicator of family food security. For children’s health as a mediator, the five indicators considered are physical, mental, psychological, emotional, and behavioral health. All scales assess children’s health on a 5-point Likert scale (“very dissatisfied” to “very satisfied”).
The initial independent construct and the most important input in this study is family food security. Various techniques were applied to measure food security/insecurity. In this paper, family food security was measured based on the Bickel and Nord [23] study, which involved 18 questions (See Supplementary Materials). The focus of this study is on very low food security and refers to nine descriptive questions (questions 1, 2, 3, 5, 10, 11, 12, 13, and 17). A nine-point Likert scale was considered to measure every indicator of family food security. For children’s health as a mediator, the five indicators considered are physical, mental, psychological, emotional, and behavioral health. All scales assess children’s health on a 5-point Likert scale (“very dissatisfied” to “very satisfied”). School performance as a dependent construct contains four indicators: school issues (5-point Likert scale from “very dissatisfied” to “very satisfied”), school attendance (5-point Likert scale from “very dissatisfied” to “very satisfied”), mathematics performance (9-point Likert scale from “C−” to “A+”), and reading performance (9-point Likert scale from “C−” to “A+”). BMI is a measure of relative size based on the mass and height of an individual [24].
BMI(Metric Method) = (weight in kilograms)
height in meters2
Every primary school student has a “health card” containing information like weight and height. The parents were asked to provide their children’s weight and height based on the cards, and each child’s BMI was calculated based on the above formula.
Goodness of fit is the main output that can be extracted from the first phase of SEM data analysis. Chi-square statistics (CMIN), root mean square error of approximation (RMSEA), normed fit index (NFI), comparative fit index (CFI), Tucker Lewis index (TLI), relative fit index (RFI), incremental fit index (IFI), and the goodness of fit index (GFI) are the most important fit indices that should be examined. Wagenmakers [25] determined the following values for the above parameters to illustrate goodness of fit:
• NFI, CFI, TLI, IFI, RFI, and GFI should be equal to or greater than 0.9
• RMSEA should be less than 0.05.
At least four of the above indices must be significant to prove that the measurement and structural models fit well. Moreover, full structural relations with indirect and direct connections among endogenous and exogenous variables were completely stated by confirmatory factor analysis. Finally, a comprehensive single model should be analyzed for the presence of significant mediators in the research model.
3. Results
3.1. Factor Loading Analysis
To illustrate the validity of latent variables (family food security, children’s health, and children’s school performance), three separate factor loading analyses were carried out. The family food security status indicators are presented as primary and modified measurement models in Figure2. In this figure, the numbers on paths denote the factor loadings between family food security and its indicators. According to Argyris and Schön [26], standardized factor loading must be more than 0.5. As illustrated in Figure2a, the factor loading of four indicators of food security are below 0.5; therefore, these indicators must be excluded from the measurement model. Consequently, a modified model for family food security status is updated as per Figure2b.
Table 1.Model fitting analysis for primary and modified measurement models of family food security.
Fit Index Primary Model Critical (Acceptable) Value Modified Model Normed fit index (NFI) 0.925 >0.9 0.987 Comparative fit index (CFI) 0.936 >0.9 0.989 Tucker Lewis index (TLI) 0.915 >0.9 0.978 Incremental fit index (IFI) 0.936 >0.9 0.989 Relative fit index (RFI) 0.900 >0.9 0.973 Goodness of fit index (GFI) 0.927 >0.9 0.975 Root means square error of approximation (RMSEA) 0.085 <0.08 0.066
Sustainability 2017, 9, 1220 5 of 18
(a) (b)
Figure 2. (a) Primary Measurement Model; (b) Modified Measurement Model. Primary and modified measurement models of family food security.
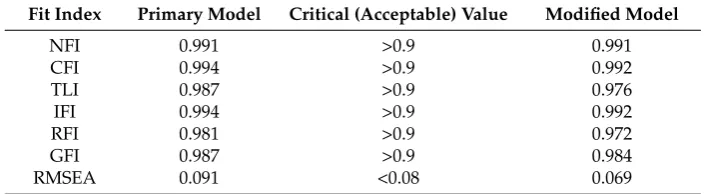
The children’s health latent variable is defined by five indicators. This latent variable is tested to illustrate the measure adequacy of its indicators. Figure 3 and Table 2 present the primary and modified fitting analyses and measurement model testing of the children’s health situation. Based on Figure 3a, the fourth indicator has 0.34 factor loading, which is below 0.5. Therefore, this indicator is removed from the measurement model. Following modification, the whole fitting indicator is well-defined. The results demonstrate that the modified model fits well to four indicators, namely children’s physical, mental, psychological, and behavioral health. The model without the fourth indicator is presented in Figure 3b.
(a) (b)
Figure 3. (a) Primary Measurement Model; (b) Modified Measurement Model. Primary and modified measurement models of children’s health.
Table 2. Model fitting analysis for primary and modified measurement models of children’s health.
Fit Index Primary Model Critical (Acceptable) Value Modified Model
NFI 0.991 >0.9 0.991
CFI 0.994 >0.9 0.992
TLI 0.987 >0.9 0.976
IFI 0.994 >0.9 0.992
RFI 0.981 >0.9 0.972
GFI 0.987 >0.9 0.984
RMSEA 0.091 <0.08 0.069
The last latent variable taken into consideration is children’s school performance. This latent variable is defined by four items. According to the results in Figure 4 and Table 3, the CFA model indicates adequate fit to the data collected based on [NFI] = 0.987, [CFI] = 0.990, [TLI] = 0.969, [RFI] =
Figure 2.(a) Primary Measurement Model; (b) Modified Measurement Model. Primary and modified measurement models of family food security.
The children’s health latent variable is defined by five indicators. This latent variable is tested to illustrate the measure adequacy of its indicators. Figure3and Table2present the primary and modified fitting analyses and measurement model testing of the children’s health situation. Based on Figure3a, the fourth indicator has 0.34 factor loading, which is below 0.5. Therefore, this indicator is removed from the measurement model. Following modification, the whole fitting indicator is well-defined. The results demonstrate that the modified model fits well to four indicators, namely children’s physical, mental, psychological, and behavioral health. The model without the fourth indicator is presented in Figure3b.
Sustainability 2017, 9, 1220 5 of 18
(a) (b)
Figure 2. (a) Primary Measurement Model; (b) Modified Measurement Model. Primary and modified measurement models of family food security.
The children’s health latent variable is defined by five indicators. This latent variable is tested to illustrate the measure adequacy of its indicators. Figure 3 and Table 2 present the primary and modified fitting analyses and measurement model testing of the children’s health situation. Based on Figure 3a, the fourth indicator has 0.34 factor loading, which is below 0.5. Therefore, this indicator is removed from the measurement model. Following modification, the whole fitting indicator is well-defined. The results demonstrate that the modified model fits well to four indicators, namely children’s physical, mental, psychological, and behavioral health. The model without the fourth indicator is presented in Figure 3b.
(a) (b)
Figure 3. (a) Primary Measurement Model; (b) Modified Measurement Model. Primary and modified measurement models of children’s health.
Table 2. Model fitting analysis for primary and modified measurement models of children’s health.
Fit Index Primary Model Critical (Acceptable) Value Modified Model
NFI 0.991 >0.9 0.991
CFI 0.994 >0.9 0.992
TLI 0.987 >0.9 0.976
IFI 0.994 >0.9 0.992
RFI 0.981 >0.9 0.972
GFI 0.987 >0.9 0.984
RMSEA 0.091 <0.08 0.069
The last latent variable taken into consideration is children’s school performance. This latent variable is defined by four items. According to the results in Figure 4 and Table 3, the CFA model indicates adequate fit to the data collected based on [NFI] = 0.987, [CFI] = 0.990, [TLI] = 0.969, [RFI] =
Table 2.Model fitting analysis for primary and modified measurement models of children’s health.
Fit Index Primary Model Critical (Acceptable) Value Modified Model
NFI 0.991 >0.9 0.991
CFI 0.994 >0.9 0.992
TLI 0.987 >0.9 0.976
IFI 0.994 >0.9 0.992
RFI 0.981 >0.9 0.972
GFI 0.987 >0.9 0.984
RMSEA 0.091 <0.08 0.069
The last latent variable taken into consideration is children’s school performance. This latent variable is defined by four items. According to the results in Figure4and Table3, the CFA model indicates adequate fit to the data collected based on [NFI] = 0.987, [CFI] = 0.990, [TLI] = 0.969, [RFI] = 0.960, [GFI] = 0.991, and [RMSEA] = 0.076. Moreover, the factor loadings of the four indicators are greater than 0.5. As a result, the children’s school performance measurement model is well-defined.
Sustainability 2017, 9, 1220 6 of 18
[image:6.595.197.399.307.425.2]0.960, [GFI] = 0.991, and [RMSEA] = 0.076. Moreover, the factor loadings of the four indicators are greater than 0.5. As a result, the children’s school performance measurement model is well-defined.
[image:6.595.148.448.482.580.2]Figure 4. Measurement model of children’s school performance.
Table 3. Model fitting analysis of primary and modified measurement models of children’s school performance.
Fit Index Primary Model Critical (Acceptable) Value
NFI 0.987 >0.9
CFI 0.990 >0.9
TLI 0.969 >0.9
IFI 0.990 >0.9
RFI 0.960 >0.9
GFI 0.991 >0.9
RMSEA 0.076 <0.08
3.2. Measurement Model
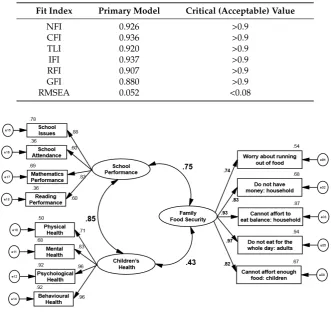
Multicollinearity appears to be the main concern in studies that focus on modeling, as it is a serious threat to SEM. Low discriminant validity of the factors normally causes multicollinearity. In order to examine the discriminant validity of factors, the full measurement model including three latent variables must be checked. The full research model without endogenous or exogenous factors will be illustrated. With this concept, all latent variables are considered in one level. As seen in Table 4, all indices meet the criteria ([NFI] = 0.926, [CFI] = 0.936, [TLI] = 0.920, [IFI] = 0.937, [RFI] = 0.907, [GFI] = 0.880, and [RMSEA] = 0.052). Consequently, the full measurement model fits well to the research data. In Figure 5, the curved lines show the covariance between latent variables. Figure 5 indicates that none of the factor loading coefficients are below 0.5 and the covariance between each construct (children’s school performance, family food security status, and children’s health status) have strong relationships with their measurements. However, the multicollinearity criterion is high correlation of over 0.85 between every pair of latent variables [27]. We have two latent variables as research inputs and the correlation analysis with AMOS (we used AMOS software for data analysis) shows that this correlation value is 0.43 which is less than 0.85. Therefore, it is confirmed that the proposed framework has no multicollinearity with the collected data.
Table 4. Model fitting analysis of full measurement model.
Fit Index Primary Model Critical (Acceptable) Value
NFI 0.926 >0.9
CFI 0.936 >0.9
TLI 0.920 >0.9
IFI 0.937 >0.9
RFI 0.907 >0.9
GFI 0.880 >0.9
RMSEA 0.052 <0.08
Figure 4.Measurement model of children’s school performance.
Table 3.Model fitting analysis of primary and modified measurement models of children’s school performance.
Fit Index Primary Model Critical (Acceptable) Value
NFI 0.987 >0.9
CFI 0.990 >0.9
TLI 0.969 >0.9
IFI 0.990 >0.9
RFI 0.960 >0.9
GFI 0.991 >0.9
RMSEA 0.076 <0.08
3.2. Measurement Model
Multicollinearity appears to be the main concern in studies that focus on modeling, as it is a serious threat to SEM. Low discriminant validity of the factors normally causes multicollinearity. In order to examine the discriminant validity of factors, the full measurement model including three latent variables must be checked. The full research model without endogenous or exogenous factors will be illustrated. With this concept, all latent variables are considered in one level. As seen in Table4, all indices meet the criteria ([NFI] = 0.926, [CFI] = 0.936, [TLI] = 0.920, [IFI] = 0.937, [RFI] = 0.907, [GFI] = 0.880, and [RMSEA] = 0.052). Consequently, the full measurement model fits well to the research data. In Figure5, the curved lines show the covariance between latent variables. Figure5
research inputs and the correlation analysis with AMOS (we used AMOS software for data analysis) shows that this correlation value is 0.43 which is less than 0.85. Therefore, it is confirmed that the proposed framework has no multicollinearity with the collected data.
Table 4.Model fitting analysis of full measurement model.
Fit Index Primary Model Critical (Acceptable) Value
NFI 0.926 >0.9
CFI 0.936 >0.9
TLI 0.920 >0.9
IFI 0.937 >0.9
RFI 0.907 >0.9
GFI 0.880 >0.9
RMSEA 0.052 <0.08
Sustainability 2017, 9, 1220 7 of 18
Figure 5. Full measurement model.
3.3. Model Identification
In the measurement model procedure, a suitable level of model identification must be found [28]. The variance
–
covariance matrix is related to the number of observable variables contained in the research model. The number of unique values can be calculated with ( + 1)/2, where p represents the number of measurable indicators. Based on the measurement model presented in Figure 5, there are 13 measurable indicators, which lead to ( )= 91 unique values to be estimated. For model identification, it must be proven that the number of parameters is less than or equal to the total number of unique values. Figure 5 shows there are 3 covariance values between latent variables, 10 real factor loadings, 13 error terms, and 3 variances for the latent variables. Therefore, the research measurement model includes 29 parameters, leaving 62 degrees of freedom, which signifies that the model is over-identified.3.4. Convergence Validity
Fornell and Larcker [29] defined three phases of convergence validity: (a) reliability of items for each measure: the factor loading must be equal to or higher than 0.5 [26], (b) Cronbach’s alpha of every construct must be equal to or higher than 0.7 [30], and (c) the average variance extracted (AVE) must be equal to or higher than 0.50 [31]. As seen in Table 5 and Figure 5, all factor loading, Cronbach’s Alpha, and AVE values meet the recommended norms and standards, meaning that the proposed construct convergence validity of the measurement model is adequate.
Table 5. Average variance extracted (AVE) and Cronbach’s Alpha values.
Latent Variables AVE Cronbach’s Alpha
Children’s Health 0.75 0.82
Children’s School Performance 0.54 0.73
Food Security 0.74 0.71
3.5. Structural Model
Structural modeling is applied next to identify the hypothesized connection among research constructs (exogenous or endogenous), which is linked to the assumed model’s concept.
Hypothesis 1 (H1). Family food security has a significant impact on children’s health.
The first hypothesis is tested to examine whether children’s health status as a dependent and mediator latent variable is related to family food security. This relation of family food security with children’s health exhibits perfect model fit to the given data ([NFI] = 0.959, [CFI] = 0.965, [TLI] = 0.951,
Figure 5.Full measurement model.
3.3. Model Identification
In the measurement model procedure, a suitable level of model identification must be found [28]. The variance–covariance matrix is related to the number of observable variables contained in the research model. The number of unique values can be calculated withp(p+1)/2, where p represents the number of measurable indicators. Based on the measurement model presented in Figure5, there are 13 measurable indicators, which lead to 13(132+1)=91 unique values to be estimated. For model identification, it must be proven that the number of parameters is less than or equal to the total number of unique values. Figure5shows there are 3 covariance values between latent variables, 10 real factor loadings, 13 error terms, and 3 variances for the latent variables. Therefore, the research measurement model includes 29 parameters, leaving 62 degrees of freedom, which signifies that the model is over-identified.
3.4. Convergence Validity
Table 5.Average variance extracted (AVE) and Cronbach’s Alpha values.
Latent Variables AVE Cronbach’s Alpha
Children’s Health 0.75 0.82
Children’s School Performance 0.54 0.73
Food Security 0.74 0.71
3.5. Structural Model
Structural modeling is applied next to identify the hypothesized connection among research constructs (exogenous or endogenous), which is linked to the assumed model’s concept.
Hypothesis 1 (H1).Family food security has a significant impact on children’s health.
The first Hypothesis is tested to examine whether children’s health status as a dependent and mediator latent variable is related to family food security. This relation of family food security with children’s health exhibits perfect model fit to the given data ([NFI] = 0.959, [CFI] = 0.965, [TLI] = 0.951, [RFI] = 0.943, [GFI] = 0.929, and [RMSEA] = 0.071). As presented in Figure6, family food security has a significant positive impact on children’s health (β= 0.43;p-value < 0.001). Therefore, children’s health
is better with higher family food security.
Sustainability 2017, 9, 1220 8 of 18
[image:8.595.119.479.363.506.2][RFI] = 0.943, [GFI] = 0.929, and [RMSEA] = 0.071). As presented in Figure 6, family food security has a significant positive impact on children’s health (β = 0.43; p-value < 0.001). Therefore, children’s health is better with higher family food security.
Figure 6. Impact of family food security on children’s health.
Hypothesis 2 (H2). Family food security has a significant impact on children’s BMI.
The second hypothesis is tested to investigate whether family food security status is directly related to children’s BMI. This relation presents acceptable model fit to the given data ([NFI] = 0.980, [CFI] = 0.984, [IFI] = 0.984, [TLI] = 0.974, [RFI] = 0.967, [GFI] = 0.968, and [RMSEA] = 0.063). Figure 7 shows the impact of a latent variable over a measurement variable, which is one of the features of SEM techniques for modeling. As seen in Figure 7, family food security has a significant negative impact on children’s BMI (β = −0.53; p-value < 0.001). Therefore, families with high food security attempt significant control and achieve lower children’s BMI.
Figure 7. Impact of family food security on children’s BMI.
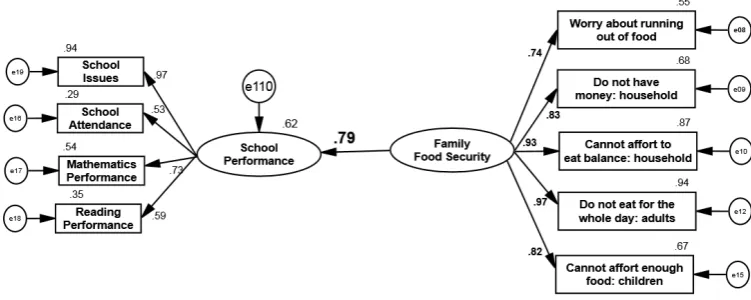
Hypothesis 3 (H3). Family food security has a significant impact on children’s school performance.
The third hypothesis is tested to examine the relationship between family food security and children’s school performance level. This relation demonstrates acceptable model fit to the data concerned ([NFI] = 0.959, [CFI] = 0.965, [TLI] = 0.951, [RFI] = 0.943, [IFI] = 0.965, [GFI] = 0.929, and [RMSEA] = 0.065). Figure 8 signifies that family food security status and children’s school performance have a very strong positive relation (β = 0.79; p-value < 0.001).
Figure 6.Impact of family food security on children’s health.
Hypothesis 2 (H2).Family food security has a significant impact on children’s BMI.
The second Hypothesis is tested to investigate whether family food security status is directly related to children’s BMI. This relation presents acceptable model fit to the given data ([NFI] = 0.980, [CFI] = 0.984, [IFI] = 0.984, [TLI] = 0.974, [RFI] = 0.967, [GFI] = 0.968, and [RMSEA] = 0.063). Figure7
shows the impact of a latent variable over a measurement variable, which is one of the features of SEM techniques for modeling. As seen in Figure7, family food security has a significant negative impact on children’s BMI (β=−0.53;p-value < 0.001). Therefore, families with high food security attempt
Sustainability2017,9, 1220 9 of 19 [RFI] = 0.943, [GFI] = 0.929, and [RMSEA] = 0.071). As presented in Figure 6, family food security has a significant positive impact on children’s health (β = 0.43; p-value < 0.001). Therefore, children’s health is better with higher family food security.
Figure 6. Impact of family food security on children’s health.
Hypothesis 2 (H2). Family food security has a significant impact on children’s BMI.
[image:9.595.124.474.89.271.2]The second hypothesis is tested to investigate whether family food security status is directly related to children’s BMI. This relation presents acceptable model fit to the given data ([NFI] = 0.980, [CFI] = 0.984, [IFI] = 0.984, [TLI] = 0.974, [RFI] = 0.967, [GFI] = 0.968, and [RMSEA] = 0.063). Figure 7 shows the impact of a latent variable over a measurement variable, which is one of the features of SEM techniques for modeling. As seen in Figure 7, family food security has a significant negative impact on children’s BMI (β = −0.53; p-value < 0.001). Therefore, families with high food security attempt significant control and achieve lower children’s BMI.
Figure 7. Impact of family food security on children’s BMI.
Hypothesis 3 (H3). Family food security has a significant impact on children’s school performance.
The third hypothesis is tested to examine the relationship between family food security and children’s school performance level. This relation demonstrates acceptable model fit to the data concerned ([NFI] = 0.959, [CFI] = 0.965, [TLI] = 0.951, [RFI] = 0.943, [IFI] = 0.965, [GFI] = 0.929, and [RMSEA] = 0.065). Figure 8 signifies that family food security status and children’s school performance have a very strong positive relation (β = 0.79; p-value < 0.001).
Figure 7.Impact of family food security on children’s BMI.
Hypothesis 3 (H3).Family food security has a significant impact on children’s school performance.
[image:9.595.109.485.421.571.2]The third Hypothesis is tested to examine the relationship between family food security and children’s school performance level. This relation demonstrates acceptable model fit to the data concerned ([NFI] = 0.959, [CFI] = 0.965, [TLI] = 0.951, [RFI] = 0.943, [IFI] = 0.965, [GFI] = 0.929, and [RMSEA] = 0.065). Figure 8signifies that family food security status and children’s school performance have a very strong positive relation (Sustainability 2017, 9, 1220 β= 0.79;p-value < 0.001). 9 of 18
Figure 8. Impact of family food security on children’s school performance.
Hypothesis 4 (H4). Children’s health has a significant impact on children’s BMI.
The fourth hypothesis is analyzed to test the relation between children’s health and their BMI. This relation exhibits good model fit to the data ([NFI] = 0.982, [CFI] = 0.984, [TLI] = 0.968, [RFI] = 0.963, [IFI] = 0.984, [GFI] = 0.972, and [RMSEA] = 0.036). According to Figure 9, children’s health status (β = −0.64; p-value < 0.001) is directly related to children’s BMI. Figure 9 also indicates that children’s health status has a negative significant impact on children’s BMI, which is more likely to be lower.
Figure 9. Impact of children’s health on children’s BMI.
Hypothesis 5 (H5). Children’s health has a significant impact on children’s school performance.
The fifth research hypothesis is about understanding the direct connection between children’s health and children’s school performance. The results ([NFI] = 0.952, [IFI] = 0.958, [CFI] = 0.958, [TLI] = 0.938, [RFI] = 0.929, [GFI] = 0.927, and [RMSEA] = 0.019) show that the relation between children’s health and children’s school performance confirms adequate fit to the data. The results in Figure 10 illustrate a very strong, positive, significant association between the health status of children and their school performance (β = 0.88; p-value < 0.001).
Figure 10. Impact of children’s health on children’s school performance.
Figure 8.Impact of family food security on children’s school performance.
Hypothesis 4 (H4).Children’s health has a significant impact on children’s BMI.
The fourth Hypothesis is analyzed to test the relation between children’s health and their BMI. This relation exhibits good model fit to the data ([NFI] = 0.982, [CFI] = 0.984, [TLI] = 0.968, [RFI] = 0.963, [IFI] = 0.984, [GFI] = 0.972, and [RMSEA] = 0.036). According to Figure9, children’s health status (β=−0.64;p-value < 0.001) is directly related to children’s BMI. Figure9also indicates that children’s
Sustainability2017,9, 1220 10 of 19 Figure 8. Impact of family food security on children’s school performance.
Hypothesis 4 (H4). Children’s health has a significant impact on children’s BMI.
The fourth hypothesis is analyzed to test the relation between children’s health and their BMI. This relation exhibits good model fit to the data ([NFI] = 0.982, [CFI] = 0.984, [TLI] = 0.968, [RFI] = 0.963, [IFI] = 0.984, [GFI] = 0.972, and [RMSEA] = 0.036). According to Figure 9, children’s health status (β = −0.64; p-value < 0.001) is directly related to children’s BMI. Figure 9 also indicates that children’s health status has a negative significant impact on children’s BMI, which is more likely to be lower.
Figure 9. Impact of children’s health on children’s BMI.
Hypothesis 5 (H5). Children’s health has a significant impact on children’s school performance.
The fifth research hypothesis is about understanding the direct connection between children’s health and children’s school performance. The results ([NFI] = 0.952, [IFI] = 0.958, [CFI] = 0.958, [TLI] = 0.938, [RFI] = 0.929, [GFI] = 0.927, and [RMSEA] = 0.019) show that the relation between children’s health and children’s school performance confirms adequate fit to the data. The results in Figure 10 illustrate a very strong, positive, significant association between the health status of children and their school performance (β = 0.88; p-value < 0.001).
Figure 10. Impact of children’s health on children’s school performance.
Figure 9.Impact of children’s health on children’s BMI.
Hypothesis 5 (H5).Children’s health has a significant impact on children’s school performance.
The fifth research Hypothesis is about understanding the direct connection between children’s health and children’s school performance. The results ([NFI] = 0.952, [IFI] = 0.958, [CFI] = 0.958, [TLI] = 0.938, [RFI] = 0.929, [GFI] = 0.927, and [RMSEA] = 0.019) show that the relation between children’s health and children’s school performance confirms adequate fit to the data. The results in Figure10illustrate a very strong, positive, significant association between the health status of children and their school performance (β= 0.88;p-value < 0.001).
Figure 8. Impact of family food security on children’s school performance.
Hypothesis 4 (H4). Children’s health has a significant impact on children’s BMI.
The fourth hypothesis is analyzed to test the relation between children’s health and their BMI. This relation exhibits good model fit to the data ([NFI] = 0.982, [CFI] = 0.984, [TLI] = 0.968, [RFI] = 0.963, [IFI] = 0.984, [GFI] = 0.972, and [RMSEA] = 0.036). According to Figure 9, children’s health status (β = −0.64; p-value < 0.001) is directly related to children’s BMI. Figure 9 also indicates that children’s health status has a negative significant impact on children’s BMI, which is more likely to be lower.
Figure 9. Impact of children’s health on children’s BMI.
Hypothesis 5 (H5). Children’s health has a significant impact on children’s school performance.
The fifth research hypothesis is about understanding the direct connection between children’s health and children’s school performance. The results ([NFI] = 0.952, [IFI] = 0.958, [CFI] = 0.958, [TLI] = 0.938, [RFI] = 0.929, [GFI] = 0.927, and [RMSEA] = 0.019) show that the relation between children’s health and children’s school performance confirms adequate fit to the data. The results in Figure 10 illustrate a very strong, positive, significant association between the health status of children and their school performance (β = 0.88; p-value < 0.001).
Figure 10. Impact of children’s health on children’s school performance.
Figure 10.Impact of children’s health on children’s school performance.
Hypothesis 6 (H6).Children’s BMI has a significant impact on children’s school performance.
The sixth Hypothesis regards understanding the direct relation between children’s BMI and their school performance. The results ([IFI] = 0.868, [NFI] = 0.864, [CFI] = 0.867, [TLI] = 0.735, [RFI] = 0.729, [GFI] = 0.854, and [RMSEA] = 0.272) signify that the model of children’s BMI and school performance does not adequately fit the data. Figure 11 indicates a negative significant connection between children’s BMI and school performance (β=−0.90;p-value < 0.001).
Sustainability 2017, 9, 1220 10 of 18
Hypothesis 6 (H6). Children’s BMI has a significant impact on children’s school performance.
The sixth hypothesis regards understanding the direct relation between children’s BMI and their school performance. The results ([IFI] = 0.868, [NFI] = 0.864, [CFI] = 0.867, [TLI] = 0.735, [RFI] = 0.729, [GFI] = 0.854, and [RMSEA] = 0.272) signify that the model of children’s BMI and school performance does not adequately fit the data. Figure 11 indicates a negative significant connection between children’s BMI and school performance (β = −0.90; p-value < 0.001).
Figure 11. Impact of children’s BMI status on children’s school performance.
Hypothesis 7 (H7). The combination of children’s BMI with health is a mediator in the relationship between family food security and children’s school performance.
Testing the 6 former hypotheses provides strong support to examine all relations in the full model. Comparison analysis is applied to examine the research framework hypotheses in modeling based on the multiple regression concept. Figure 12 shows the primary structural model with the regression coefficients. Age of the children does not significantly impact on school performance. Therefore, this control variable is eliminated from the research model at this data analysis level. However, the fitting index results ([IFI] = 0.900, [NFI] = 0.889, [CFI] = 0.952, [TLI] = 0.873, [RFI] = 0.860, [GFI] = 0.840, and [RMSEA] = 0.092) demonstrate that only two indices (IFI and CFI) display model fitting. However, as noted earlier, at least four model fitting tests are required for acceptable results. In order to solve this problem, modification indices can be used to create alternative models to improve fitting, but they must be supplemented with sufficient theoretical justification [25]. In addition, the indices should be minimized to avoid over-fitting [32].
Figure 12. Primary structural model.
Sustainability2017,9, 1220 11 of 19
Hypothesis 7 (H7).The combination of children’s BMI with health is a mediator in the relationship between family food security and children’s school performance.
Testing the 6 former hypotheses provides strong support to examine all relations in the full model. Comparison analysis is applied to examine the research framework hypotheses in modeling based on the multiple regression concept. Figure12shows the primary structural model with the regression coefficients. Age of the children does not significantly impact on school performance. Therefore, this control variable is eliminated from the research model at this data analysis level. However, the fitting index results ([IFI] = 0.900, [NFI] = 0.889, [CFI] = 0.952, [TLI] = 0.873, [RFI] = 0.860, [GFI] = 0.840, and [RMSEA] = 0.092) demonstrate that only two indices (IFI and CFI) display model fitting. However, as noted earlier, at least four model fitting tests are required for acceptable results. In order to solve this problem, modification indices can be used to create alternative models to improve fitting, but they must be supplemented with sufficient theoretical justification [25]. In addition, the indices should be minimized to avoid over-fitting [32].
Hypothesis 6 (H6). Children’s BMI has a significant impact on children’s school performance.
The sixth hypothesis regards understanding the direct relation between children’s BMI and their school performance. The results ([IFI] = 0.868, [NFI] = 0.864, [CFI] = 0.867, [TLI] = 0.735, [RFI] = 0.729, [GFI] = 0.854, and [RMSEA] = 0.272) signify that the model of children’s BMI and school performance does not adequately fit the data. Figure 11 indicates a negative significant connection between children’s BMI and school performance (β = −0.90; p-value < 0.001).
Figure 11. Impact of children’s BMI status on children’s school performance.
Hypothesis 7 (H7). The combination of children’s BMI with health is a mediator in the relationship between family food security and children’s school performance.
[image:11.595.153.440.289.518.2]Testing the 6 former hypotheses provides strong support to examine all relations in the full model. Comparison analysis is applied to examine the research framework hypotheses in modeling based on the multiple regression concept. Figure 12 shows the primary structural model with the regression coefficients. Age of the children does not significantly impact on school performance. Therefore, this control variable is eliminated from the research model at this data analysis level. However, the fitting index results ([IFI] = 0.900, [NFI] = 0.889, [CFI] = 0.952, [TLI] = 0.873, [RFI] = 0.860, [GFI] = 0.840, and [RMSEA] = 0.092) demonstrate that only two indices (IFI and CFI) display model fitting. However, as noted earlier, at least four model fitting tests are required for acceptable results. In order to solve this problem, modification indices can be used to create alternative models to improve fitting, but they must be supplemented with sufficient theoretical justification [25]. In addition, the indices should be minimized to avoid over-fitting [32].
Figure 12. Primary structural model.
Figure 12.Primary structural model.
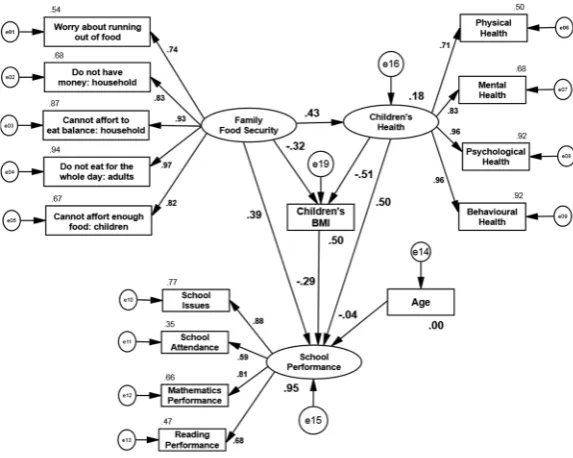
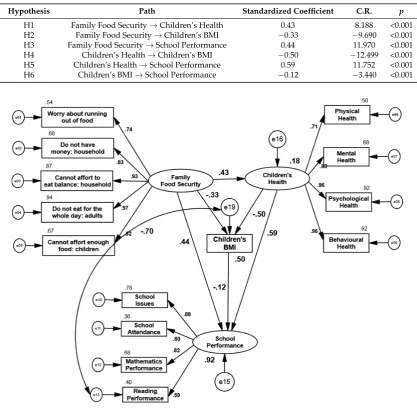
[image:11.595.166.430.660.714.2]The modification index results are displayed in Table6. The maximum covariance belongs to e13–e19 with 183.508. Therefore, in Figure13the relationship between reading performance and BMI should be considered. This means that children’s BMI, which has a significant impact on children’s performance, also has a specific significant relationship with reading performance (−0.7). As a result, high BMI leads to lower reading performance according to this research.
Table 6.Modification index analysis.
Relation Modification Indices
e12↔e16 42.211
e13↔e19 183.508
e06↔Family Food Security 36.490
final structural model after applying the modification indices. The figure also shows that family food security has a positive significant impact on both children’s health status (β= 0.43,p-value < 0.001)
and children’s school performance level (β= 0.44,p-value < 0.001) and a negative significant impact
on children’s BMI (β=−0.33,p-value < 0.001). Children’s health has a positive significant effect on
children’s school performance (β= 0.59,p-value < 0.001) and negative significant effect on children’s
BMI (β=−0.50,p-value < 0.001). Finally, children’s BMI has a negative significant impact on children’s
school performance (β=−0.12,p-value < 0.001). The results of the full structural model with regression
[image:12.595.90.508.268.680.2]path coefficients are also presented in Table7. According to Figure13, 18% of variance in children’s health is explained by family food security; 50% of variance in children’s BMI status is explained by children’s health and family food security; and 92% of variance in children’s school performance level is explained by family food security, children’s health, and children’s BMI.
Table 7.Analysis of estimated parameters’ significance.
Hypothesis Path Standardized Coefficient C.R. p
H1 Family Food Security→Children’s Health 0.43 8.188 <0.001 H2 Family Food Security→Children’s BMI −0.33 −9.690 <0.001 H3 Family Food Security→School Performance 0.44 11.970 <0.001 H4 Children’s Health→Children’s BMI −0.50 −12.499 <0.001 H5 Children’s Health→School Performance 0.59 11.752 <0.001 H6 Children’s BMI→School Performance −0.12 −3.440 <0.001
1
Figure 13.Final structural model.
3.6. Mediation Analysis
Sustainability2017,9, 1220 13 of 19
Baron and Kenny [33] presented the application of a mediation analysis in the social sciences which has been used in many studies. Currently, new advances in mediation analysis have been made by using the counterfactual framework [34,35]. Applying the counterfactual framework has permitted descriptions of direct and indirect effects and for decomposition of a total effect into direct and indirect effects, even in models with interactions and nonlinearities.
The main concern in this study is to understand the relationship between three latent variables and one measurement variable, which are presented in this section. In this research, the two mediators are children’s health and children’s BMI. Figure14presents the graphic relationships between the independent and dependent variables, and the two mediators. When a mediator exists between two variables, the relations may be categorized as an indirect effect, partial mediation, or full mediation, which are defined as follows:
• Indirect effect: When the effects of X on M and M on Y are both significant, but there is no relation between X and Y.
• Partial mediation: When all effects of X on M, and M on Y, and interactions are significant.
• Full mediation: When the effects of X on M and M on Y are both significant, but there is no significant relation between X and Y, although there is an interaction.
3.6. Mediation Analysis
Mediation analysis is used to find out the mechanisms that underlie a detected association between an exposure indicator and an outcome, and tests in what way they impact a third intermediate indicator, the mediator.
Baron and Kenny [33] presented the application of a mediation analysis in the social sciences which has been used in many studies. Currently, new advances in mediation analysis have been made by using the counterfactual framework [34,35]. Applying the counterfactual framework has permitted descriptions of direct and indirect effects and for decomposition of a total effect into direct and indirect effects, even in models with interactions and nonlinearities.
The main concern in this study is to understand the relationship between three latent variables and one measurement variable, which are presented in this section. In this research, the two mediators are children’s health and children’s BMI. Figure 14 presents the graphic relationships between the independent and dependent variables, and the two mediators. When a mediator exists between two variables, the relations may be categorized as an indirect effect, partial mediation, or full mediation, which are defined as follows:
Indirect effect: When the effects of X on M and M on Y are both significant, but there is no relation between X and Y.
Partial mediation: When all effects of X on M, and M on Y, and interactions are significant. Full mediation: When the effects of X on M and M on Y are both significant, but there is no
[image:13.595.180.417.335.547.2]significant relation between X and Y, although there is an interaction.
Figure 14. Indirect and mediation models with two mediators.
Based on the above analysis, in the first step the effects of X on M and M on Y should be checked for significance. Afterwards, the indirect effect is compared to the mediation effect when the validity of the first step is reliable. When the mediation effect is accepted, it is necessary to study the partial and full mediations. According to Table 8, the effect of family food security status (independent variable) on children’s health status (the first mediator), children’s BMI (the second mediator), and children’s school performance level (dependent variable) is significant; hence, at this stage, a comparison test should be done on the indirect versus mediation effects. Table 8 compares the mediating and indirect paths in the defined path model. Statistics, such as a baseline comparison for model fitting including NFI, IFI, RFI, TLI, CFI, RMSEA, and chi-square goodness of fit are included in the table. According to Table 9, three of the indices are within acceptable ranges. However, for the mediation model, RFI, NFI, IFI, TLI, and CFI are greater than 0.9, confirming that mediation model
Figure 14.Indirect and mediation models with two mediators.
Sustainability2017,9, 1220 14 of 19
Table 8.Comparison of model fit analysis between indirect and mediation models.
Fit Index Indirect Mediation
RFI 0.881 0.913
NFI 0.906 0.932
IFI 0.916 0.943
TLI 0.894 0.927
CFI 0.916 0.943
GFI 0.857 0.885
RMSEA 0.051 0.042
fitting is satisfied. Figure 15 presents the indirect research model from which the relation between family food security and children’s school performance was deleted.
Table 8. Comparison of model fit analysis between indirect and mediation models.
Fit Index Indirect Mediation
RFI 0.881 0.913
NFI 0.906 0.932
IFI 0.916 0.943
TLI 0.894 0.927
CFI 0.916 0.943
GFI 0.857 0.885
RMSEA 0.051 0.042
Figure 15. Indirect research model.
Table 9 illustrates the direct, indirect, and total effect of each latent and measurement variable in the model. The indirect effect is significant, which confirms that the interaction between children’s health status and BMI acts as a partial mediator in the association between family food security and children’s school performance. This result supports the seventh hypothesis of this research.
Table 9. Mediation test of research model.
Outcome Input Standardized Estimates
Direct Indirect Total
School Performance
Children’s BMI −0.12 - −0.12
Children’s Health 0.59 0.06 0.65
Family Food Security 0.44 0.32 0.76
R2 = 0.83
Hypothesis 8 (H8). Gender is a moderator in the relationship between the family food security and children’s
environment indicators.
Figure 15.Indirect research model.
[image:14.595.172.425.575.669.2]Table9illustrates the direct, indirect, and total effect of each latent and measurement variable in the model. The indirect effect is significant, which confirms that the interaction between children’s health status and BMI acts as a partial mediator in the association between family food security and children’s school performance. This result supports the seventh Hypothesis of this research.
Table 9.Mediation test of research model.
Outcome Input Standardized Estimates Direct Indirect Total School Performance
Children’s BMI −0.12 - −0.12
Children’s Health 0.59 0.06 0.65
Family Food Security 0.44 0.32 0.76
R2= 0.83
3.7. Multi-Group Analysis
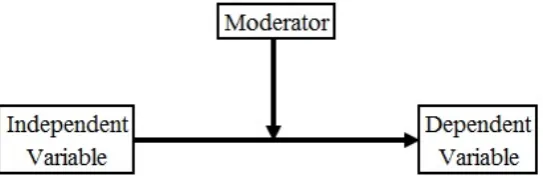
A moderating variable moderates the relationship between the independent and dependent variables. This means that the effect of one variable (independent) on the dependent variable changes with the level of another variable that is known as the moderator (Figure16).
3.7. Multi-Group Analysis
[image:15.595.163.435.162.256.2]A moderating variable moderates the relationship between the independent and dependent variables. This means that the effect of one variable (independent) on the dependent variable changes with the level of another variable that is known as the moderator (Figure 16).
Figure 16. Multi-group modeling structure.
The existence of a moderator affects expressions in alterations that occur in the research model across various moderator indicator levels. Moderators may be either a natural variable, such as gender or time, or a manipulated factor in an experimental setting. Examining the moderator effects enables researchers to determine whether the experimental impacts on individual subgroups are different [36]. In the current research, gender is considered a moderator in the research model.
The Chin test is used, which suggests multi-group analysis via t-test with the following formula:
= Regression Coeficient − Regression Coeficient (m − 1)
[image:15.595.157.446.383.428.2](m + n − 2) × S. E. +(m + n − 2) × S. E.(n − 1) × m +1 1n
[image:15.595.86.512.527.613.2]Table 10 displays the output of the multi-group test for every relation in the research model. The t-values of the relationships between children’s health and children’s BMI, as well as children’s health and children’s school performance are different between the boys and girls groups. Therefore, gender acts as a significant moderator in the research model.
Table 10. Chin’s test analysis.
Path Boys Model Girls Model Chin’s Test
Family Food Security → Children’s Health 0.55 0.36 0.856
Family Food Security → Children’s BMI −0.45 −0.27 0.924 Family Food Security → School Performance 0.47 0.41 0.261
Children’s Health → Children’s BMI −0.68 −0.21 2.147 * Children’s Health → School Performance 0.31 0.63 3.967 *
Children’s BMI → School Performance −0.18 −0.08 0.132 * means that the differences is significant
4. Discussion
An attempt was made in this study to provide a valid and reliable model for measuring the effectiveness of family food security on children’s environment. Therefore, the main concern was to introduce and examine a causal association between family food security status and children’s BMI, health, and school performance by testing the hypothesized structural model. Confirmatory factor analysis was suggested as the primary analysis between family food security, children’s health, and school performance. The final analysis results delaminate non-significant indicators and introduce the significant indicators with acceptable factor loadings ranging from 0.59 to 0.97.
The validity of this integrated model indicates that it is able to estimate the relationships among BMI, health, and school performance as the main environments of children. Moreover, it is endeavored to understand the effect of family food security on this children’s environment. Figure 17 shows the association between family food security and three main indicators (children’s BMI, health and school performance) of the environment of children in a household.
Figure 16.Multi-group modeling structure.
The existence of a moderator affects expressions in alterations that occur in the research model across various moderator indicator levels. Moderators may be either a natural variable, such as gender or time, or a manipulated factor in an experimental setting. Examining the moderator effects enables researchers to determine whether the experimental impacts on individual subgroups are different [36]. In the current research, gender is considered a moderator in the research model.
The Chin test is used, which suggests multi-group analysis viat-test with the following formula:
= "rRegression Coeficientgroup1− Regression Coeficientgroup2
(m−1)2
(m+n−2) ×S.E.
2 group1+
(n−1)2
(m+n−2) ×S.E.
2 group2
#
×q1
m+n1
Table10displays the output of the multi-group test for every relation in the research model. Thet-values of the relationships between children’s health and children’s BMI, as well as children’s health and children’s school performance are different between the boys and girls groups. Therefore, gender acts as a significant moderator in the research model.
Table 10.Chin’s test analysis.
Path Boys Model Girls Model Chin’s Test
Family Food Security→Children’s Health 0.55 0.36 0.856
Family Food Security→Children’s BMI −0.45 −0.27 0.924
Family Food Security→School Performance 0.47 0.41 0.261
Children’s Health→Children’s BMI −0.68 −0.21 2.147 *
Children’s Health→School Performance 0.31 0.63 3.967 *
Children’s BMI→School Performance −0.18 −0.08 0.132
* means that the differences is significant.
4. Discussion
The validity of this integrated model indicates that it is able to estimate the relationships among BMI, health, and school performance as the main environments of children. Moreover, it is endeavored to understand the effect of family food security on this children’s environment. Figure17shows the association between family food security and three main indicators (children’s BMI, health and school performance) of the environment of children in a household.
[image:16.595.207.389.172.335.2]Sustainability 2017, 9, 1220 15 of 18
Figure 17. Family food security and children’s environment.
The proposed model is a multi-mediation model that includes two mediators and one moderator. These are children’s health and BMI, which connect family food security with children’s school performance. Recent studies on childhood obesity have proven there is a strong association between family food security status and the BMI of their children [15,37]. Much like recent studies regarding childhood public health modeling, the present study findings confirm that the food security of the family has a strong impact on the health situation of children [38]. Moreover, it was found there is a significant relationship between family food security and children’s school performance. In other words, families with higher food security have the capability to control and improve their children’s school performance, including school attendance and mathematics and reading performance. A previous study in the public health area also confirmed there is a relationship between family food security and children’s school performance [39].
Specifically, five food security items from nine indicators were examined in this study. Although the current model fully fits the data and all related hypotheses are met, there is a lack of evidence in former modeling research to support utilizing structural equation modeling and introducing latent variables to family food security among health and nutrition studies.
By comparing related studies, it is observed that children’s health and all subscales of food security are included in the new model. Hence, this model is more comprehensive and provides a greater range of data related to the factors affecting children’s school performance. Moreover, the model appears to match the present sample well, and it is evident that all suppositions are appropriately supported by the data. The family food security status with −0.33 regression weight is confirmed to have a meaningful association with children’s BMI status. Moreover, food security is highly related to children’s school performance. It is also observed that children’s health-related well-being has a remarkable effect on children’s BMI loss.
With the help of the model considered and due to the strong and significant association between the constructs, larger values of the variables’ shared variances were determined. Essentially, based on the findings, 92% of changes in children’s school performance can be justified by the family food security situation and children’s health along with children’s BMI. A structural model matching well to the acquired data indicates that the current integrated research model is in agreement with the associations within the acquired data. Studying the dimensional integrated model in order to assess the direct and indirect associations between the constructs was one of the key objectives of the present research. Despite the fact that the regression models in prior research could describe and determine the associations among constructs, they could not determine the direct and indirect associations and interactions between two mediators among the variables of interest. The results of the present research show that in spite of the direct association between children’s school performance and family food security, an indirect but meaningful relationship exists between family food security and children’s BMI through children’s health. Parents with higher food security levels seemed to have children with lower BMIs as well as healthier children. As a result, their children appeared to have a
Family Side Children's environment
Food Security
School Performance
BMI
Healthy
Figure 17.Family food security and children’s environment.
The proposed model is a multi-mediation model that includes two mediators and one moderator. These are children’s health and BMI, which connect family food security with children’s school performance. Recent studies on childhood obesity have proven there is a strong association between family food security status and the BMI of their children [15,37]. Much like recent studies regarding childhood public health modeling, the present study findings confirm that the food security of the family has a strong impact on the health situation of children [38]. Moreover, it was found there is a significant relationship between family food security and children’s school performance. In other words, families with higher food security have the capability to control and improve their children’s school performance, including school attendance and mathematics and reading performance. A previous study in the public health area also confirmed there is a relationship between family food security and children’s school performance [39].
Specifically, five food security items from nine indicators were examined in this study. Although the current model fully fits the data and all related hypotheses are met, there is a lack of evidence in former modeling research to support utilizing structural equation modeling and introducing latent variables to family food security among health and nutrition studies.
By comparing related studies, it is observed that children’s health and all subscales of food security are included in the new model. Hence, this model is more comprehensive and provides a greater range of data related to the factors affecting children’s school performance. Moreover, the model appears to match the present sample well, and it is evident that all suppositions are appropriately supported by the data. The family food security status with−0.33 regression weight is confirmed to have a meaningful association with children’s BMI status. Moreover, food security is highly related to children’s school performance. It is also observed that children’s health-related well-being has a remarkable effect on children’s BMI loss.
the direct and indirect associations between the constructs was one of the key objectives of the present research. Despite the fact that the regression models in prior research could describe and determine the associations among constructs, they could not determine the direct and indirect associations and interactions between two mediators among the variables of interest. The results of the present research show that in spite of the direct association between children’s school performance and family food security, an indirect but meaningful relationship exists between family food security and children’s BMI through children’s health. Parents with higher food security levels seemed to have children with lower BMIs as well as healthier children. As a result, their children appeared to have a normal BMI and weight. In other words, family food security is not only directly associated with the BMI condition of children but can also indirectly impact their BMI through an influence on children in terms of health condition. Likewise, the mediating role of BMI and children’s health-related well-being, and their interaction, have not been considered in previous studies.
Regarding the current study’s limitations, it should be mentioned there is a lack of evidence to provide a connection between children’s calorie intake, energy expenditure, and childhood obesity. The next point to consider is the genetic causes of overweight and obesity. According to previous studies, genetics are deemed a remarkable factor in causing obesity [40] and should be included in the model.
This study was done in a poor city area. It was confirmed that 92% of school performance is related to family food security, children’s health, and BMI. Some indicators that are logically important in the research model are parental food monitoring and children’s food intake. However, it is not reasonable to involve these kinds of variables for households with food security problems. This was another limitation of the study, and it was therefore not possible to analyze the interference of parental food monitoring and children’s food intake due to the sampling structure.
Clinical causes and effects were not examined in the present research, hence, it is recommended to study these in future investigations on account of their significance. This investigation was principally improved by using an adequate sample size to gain scientifically credible findings through SEM. Lastly, the data were analyzed by applying structural equation modeling.
Supplementary Materials:The following are available online atwww.mdpi.com/2071-1050/9/7/1220/s1. Acknowledgments:This research is supported by university of Malaya, Kuala Lumpur, Malaysia with project number RP027E-15HNE.
Author Contributions:Author Contributions: Conceived and designed the experiments: Che Wan Jasimah bt Wan Mohamed Radzi, Nur Anisah Binti Mohamed @ A. Rahman, Huang Hui, and Hashem Salarzadeh Jenatabadi; performed the experiments: Huang Hui; analyzed the data: Hashem Salarzadeh Jenatabadi and Nur Anisah Binti Mohamed @ A. Rahman; contributed reagents and materials: Huang Hui, Che Wan Jasimah bt Wan Mohamed Radzi, and Hashem Salarzadeh Jenatabadi; wrote the paper: Huang Hui, Che Wan Jasimah bt Wan Mohamed Radzi, Nur Anisah Binti Mohamed @ A. Rahman, and Hashem Salarzadeh Jenatabadi.
Conflicts of Interest:The authors declare no conflict of interest.
References
1. Wu, J.; Zhang, J.; Wang, S.; Kong, F. Assessment of food security in China: A new perspective based on production-consumption coordination.Sustainability2016,8, 183. [CrossRef]
2. De Laurentiis, V.; Hunt, D.V.; Rogers, C.D. Overcoming food security challenges within an energy/water/food nexus (ewfn) approach.Sustainability2016,8, 95. [CrossRef]
3. Gomiero, T. Soil degradation, land scarcity and food security: Reviewing a complex challenge.Sustainability 2016,8, 281. [CrossRef]
4. Hui, H.; Jenatabadi, H.S. Comparing Bayesian and Maximum Likelihood Predictors in Structural Equation Modeling of Children’s Lifestyle Index.Symmetry2016,8, 141.