©IJRASET 2015: All Rights are Reserved
520
Optimization of Different Machining Parameters
of En 354 Alloy Steel In CNC Turning Operation
Using Taguchi Method
SanjayYadav1, SanjayKajal2
1
M.Tech Scholar, 2Assistant Professor
Department of Mechanical Engineering, U.I.E.T. Kurukshetra University Kurukshetra (HRY), India
Abstract- The objective of this experimental study is to develop a single optimization method for lower surface roughness and maximum metal removal rate in terms of process parameters while carrying out CNC turning operation. The machining parameters which are controllable for this operation included spindle speed, feed rate and depth of cut and developed a relationship between them to get minimum surface finish and maximum MRR. Taguchi orthogonal array, S/N ratio and ANOVA were employed to study the performance characteristics in the CNC turning of EN 354 alloy steel using CNMG 120408 GT cutting tool to find out the optimum level which affects the cutting parameters on surface roughness and MRR. Experiments have been conducting using L9 orthogonal array on a STALLION 100 HS CNC turning machine. The MINITAB–17 software was used to analysis the responses. The machining parameters are varied to investigate their effect on output responses. Results of this study indicate that the cutting speed has the most significant factor followed by feed rate on both responses.
Keywords: Surface Roughness, MRR, ANOVA, EN 354 Steel, MINITAB-17Software, Taguchi Method.
I. INTRODUCTION
©IJRASET 2015: All Rights are Reserved
521
experiment technique i.e. Taguchi’s technique have been used to accomplish the objective. Taguchi parameter design uses the orthogonal array concept, used to estimate main effects [5]. In this work, L9 orthogonal array based Taguchi optimization technique is used to optimize the effect of machining parameter such as spindle speed, depth of cut, nose radius and feed rate on material removal rate and surface roughness in CNC turning of EN 354 low carbon steel and ANOVA technique is employed to analyze the percentage contribution and influence of process parameters.
II. LITERATURE REVIEW
The literature contains a good body of knowledge on the research of surface roughness, metal removal rate, tool wear rate etc. in the past. In order to develop and optimize a surface roughness and metal removal rate it is essential to understand the current status work in this area. The surface quality is an important factor to evaluate the productivity of machined component as well as machine tools. In 1907 Taylor showed that an optimum cutting speed exists this could maximize metal removal rate and minimize surface roughness [6] Therefore a number of Researchers have been focused on an appropriate method to evaluate the optimal value of the process parameters to predict the surface roughness and metal removal rate.
M.kaladhar[7] was carried out “Determination of Optimum Process Parameters during turning of AISI 304 Austenitic Stainless Steels using Taguchi method and ANOVA”. They investigated the effects of process parameters feed, speed, depth of cut and nose radius on surface finish and material removal rate (MRR) to obtain the optimal setting of these process parameters. And the Analysis Of Variance (ANOVA) is also used to analyze the influence of cutting parameters during machining. Tian-Syung LAN[8] were carried out “Parametric Deduction Optimization for Surface Roughness”. They investigated with four parameters (cutting depth, feed rate, speed, tool nose runoff) with three levels (low, medium, high) were considered to optimize the surface roughness for Computer Numerical Control (CNC) finish turning. H.Yanda[9] were carried out “Optimization of material removal rate, surface roughness and tool life on conventional dry turning of FCD700”. They investigate the effect of the cutting speed, feed rate and depth of cut on material removal rate (MRR), surface roughness, and tool life in conventional turning of ductile cast iron FCD700 grade using TiN coated cutting tool in dry condition. The effect of cutting condition (cutting speed and feed rate) on MRR, surface roughness, and tool life were studied and analyzed. Low surface finish was obtained at high cutting speed and low feed rate. Ihsan Korkut[10] were carried out “Determination of optimum cutting parameters during machining of AISI 304 austenitic stainless steel” they describes that high strength, low thermal conductivity, high ductility and high work hardening tendency of austenitic stainless steels are the main factors that make their machinability difficult. In this study determination of the optimum cutting speed has been aimed when turning an AISI 304 austenitic stainless steel using cemented carbide cutting tools. The influence of cutting speed on tool wear and surface roughness was investigated. K.Senthil Kumar et al.[11]investigated The effect on surface roughness of machining parameters Material-Duplex Stainless Steel The surface roughness is mainly influenced by the feed rate. With an increase in feed rate, the surface roughness also increases considerably. The cutting speed and the depth of cut are less significant for surface roughness than the feed rate From the ANOVA analysis, the parameter that has the most significant effect on surface roughness is the feed rate.
III. MRR and Surface Roughness Measurement
The metal removal rate has been calculated from the difference of weight of work before and after machining by using following formula:
MRR =
Where,
= weight of work before machining
©IJRASET 2015: All Rights are Reserved
522
t = machining time in minute
ρa = density of alloy steel (7.85 g/mm3 )
There are several ways to describe surface roughness such as average roughness, Root mean square (RMS), maximum peak to valley method and center line average method (CLA). Among them, average method is used commonly to measure the value of surface roughness. In modern industry, there are several instruments which measure the surface roughness directly. The instruments such as microscope, stylus type instruments, profile tracing instruments etc. The portable surface roughness tester SRT- 6210 used in present experimental work. The portable SRT-6210 is shown in figure1:
Figure 1 SRT 6210
IV. TAGUCHI METHOD
A Japanese engineer G. Taguchi developed a methodology, based on the fewer experimental designs and providing a clear understanding of the variation nature and the economic consequences of quality engineering in the world of manufacturing.[12]Design of Experiments (DoE) is a statistical technique, used to study many factors simultaneously and most economically. The Taguchi method is a well-known technique that provides a systematic and efficient methodology for process optimization and this is a powerful tool for the design of high quality systems.
Designing products/processes so as to be robust to environmental conditions
Designing and developing products/processes so as to be robust to component variations Minimizing variation around a target value.
The philosophy of Taguchi is applicable widely. Taguchi method uses a special design of orthogonal arrays to study the entire parameter space with a small number of experiments only.[13] A statistical analysis of variance (ANOVA) is performed to see which process parameters are statistically significant. ANOVA is used to determine the influence of any given process parameters from a series of experimental results by design of experiments and it can be used to interpret experimental data. With the S/N and ANOVA analyses, the optimal combination of the process parameters can be predicted. The selection of orthogonal array (OA) is the most important steps in Taguchi technique. An OA is small set of possibilities which helps to determine with least no. of experiments run. In the present work “higher the better” characteristic for metal removal rate and the “lower the better” characteristic for the surface roughness were used. The steps included in the Taguchi design are: Selection of quality characteristics.
Selection of factors and interaction to be evaluated. Selection of numbers of levels for factors
Selection of appropriate OA
Assignment of factors and interaction to the columns Conduct of experiments
Analysis of results
Conformation of experiments
A. Design of Experiment
©IJRASET 2015: All Rights are Reserved
523
values and so on the basis of selected parameters, experimental design is carried out. The Taguchi experimental design is done for L9 Orthogonal array (OA) for three parameters which are spindle speed, feed and depth of cut. Minitab17 software was used for analyze the data.
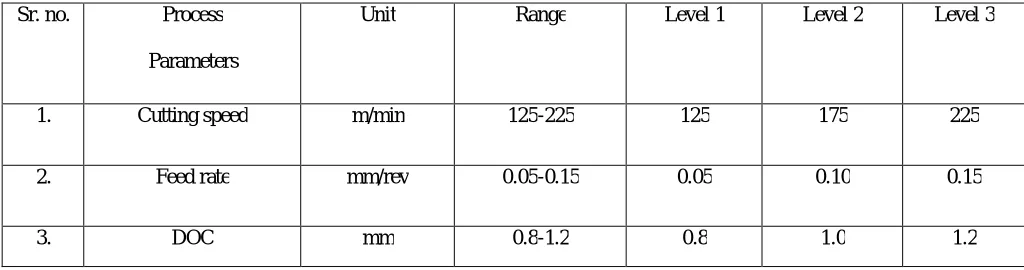
Table1 The range and level of process parameters
An L9 OA experimental setup was selected to satisfy the minimum number of experimental conditions for the factor and levels presented the present study.
V. EXPERIMENTAL DETAILS
A. Work Piece Material
EN 354 is a low carbon case hardening alloy steel which requiring high toughness due to presence of nickel. It is a nickel- chromium-molybdenum alloy steel which has good core strength. Work piece of diameter 40mm and length 300mm was prepared from bar stock so that it can be accommodated in the CNC lathe machine and all the trails can be performed. The chemical composition of EN 354 alloy steel is:
Table2 Chemical composition of EN 354 Alloy Steel
B. Cutting Tool Inserts
[image:5.612.39.551.154.289.2]The selection of cutting tool material has also great advantage such as reducing the manufacturing cost and lead time, machining more hard materials, improving surface integrity and obtaining higher metal removal rates. Thus commercially available uncoated carbide tool of Kyocera CNMG120408 GT with nose radius 0.8 is used in this investigation as shown in figure2
Figure 2 The turning insert
Sr. no. Process
Parameters
Unit Range Level 1 Level 2 Level 3
1. Cutting speed m/min 125-225 125 175 225
2. Feed rate mm/rev 0.05-0.15 0.05 0.10 0.15
3. DOC mm 0.8-1.2 0.8 1.0 1.2
Material C% Mn% Si% S% P% Cr% Ni% Mo%
©IJRASET 2015: All Rights are Reserved
524
C. Equipment Used
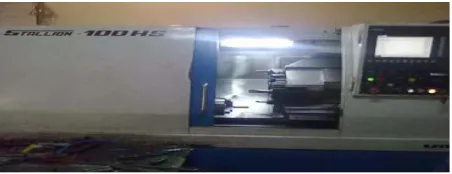
[image:6.612.182.408.174.261.2]The CNC turning process must have the capability of high speed, versatility, flexibility and robustness in response to the ever changing demands of the customers. A HMT CNC turning center STALLION 100HS is used for experimentation as shown in fig. The lathe equipped with variable spindle speed from 100rpm to 3000rpm and a 5.5 kW motor drive has been used in this tests. The control system of CNC lathe machine is based on the Siemens 802D which controls the different input parameters. The machine set up is shown in figure3as:
Figure 3 HMT STALLION 100 HS CNC lathe
The work piece material which is turned on CNC machine shows in figure4 as:
Figure4 Show the work piece material after machining
[image:6.612.45.546.486.641.2]Selection of Orthogonal Array and Experimental Design
Table 3 Shows the L9 Orthogonal Array
Sr. No. Factor 1 Factor 2 Factor 3
1. 125 0.05 0.8
2. 125 0.10 1.0
3. 125 0.15 1.2
4. 175 0.05 1.2
5. 175 0.10 0.8
6. 175 0.15 1.0
7. 225 0.05 1.0
8. 225 0.10 1.2
9. 225 0.15 0.8
VI. ANALYSIS AND DISCUSSION
©IJRASET 2015: All Rights are Reserved
525
analysis have been carried out using Minitab statistical software.
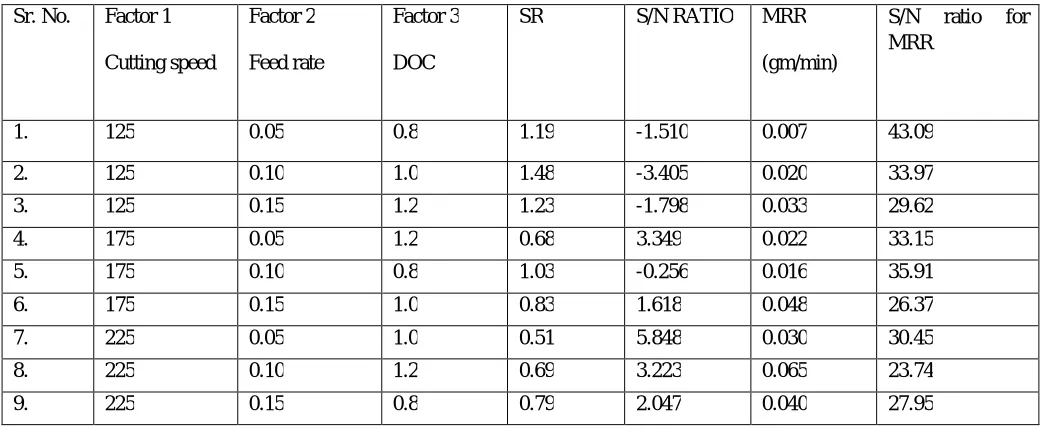
Table 4 Experimental results for Surface Roughness and MRR
Sr. No. Value of SR(Ra) in µm Value of MRR in gm/min
1. 1.19 0.007
2. 1.48 0.020
3. 1.23 0.033
4. 0.68 0.022
5. 1.03 0.016
6. 0.83 0.048
7. 0.51 0.030
8. 0.69 0.065
[image:7.612.34.562.332.556.2]9. 0.79 0.040
Table 5 The S/N ratio for SR and MRR Sr. No. Factor 1
Cutting speed
Factor 2
Feed rate
Factor 3
DOC
SR S/N RATIO MRR
(gm/min)
S/N ratio for MRR
1. 125 0.05 0.8 1.19 -1.510 0.007 43.09
2. 125 0.10 1.0 1.48 -3.405 0.020 33.97
3. 125 0.15 1.2 1.23 -1.798 0.033 29.62
4. 175 0.05 1.2 0.68 3.349 0.022 33.15
5. 175 0.10 0.8 1.03 -0.256 0.016 35.91
6. 175 0.15 1.0 0.83 1.618 0.048 26.37
7. 225 0.05 1.0 0.51 5.848 0.030 30.45
8. 225 0.10 1.2 0.69 3.223 0.065 23.74
9. 225 0.15 0.8 0.79 2.047 0.040 27.95
ANOVA Table 6 for MRR
Source DF Seq SS Adj SS Adj MS F P %C
Cutting Speed
2 100.67 100.67 50.33 74.66 0.013 37.78
Feed rate 2 86.85 86.85 43.42 64.41 0.015 32.60
DOC 2 77.54 77.54 38.77 57.50 0.017 29.10
Residual error
2 1.34 1.34 0.67 0.050
©IJRASET 2015: All Rights are Reserved
526
ANOVA Table 7 for SR
MINITAB 17statistical software has been used for the analysis of the experimental data. The ANOVA technique is help to determine which parameter is most significant.
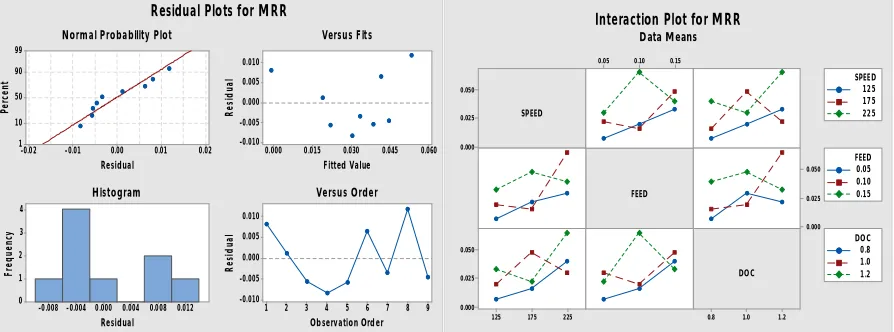
A. Plots for MRR
The main effect plot for MRR as shown in figure6 These show the variation of individual response with cutting speed, feed rate and depth of cut separately. From figure 5 the residual spread along straight line that the residual are distributed normally. From the ANOVA table 6 the most significant factor foe the MRR is cutting speed with contribution of 37.78% followed by feed rate with contribution 32.60%.
0.02 0.01 0.00 -0.01 -0.02 99 90 50 10 1 Residual P e rc e n t 0.060 0.045 0.030 0.015 0.000 0.010 0.005 0.000 -0.005 -0.010 Fitted Value R e s id u a l 0.012 0.008 0.004 0.000 -0.004 -0.008 4 3 2 1 0 Residual F re q u e n cy 9 8 7 6 5 4 3 2 1 0.010 0.005 0.000 -0.005 -0.010 Observation Order R e si d u a l
Normal Probability Plot Versus Fits
Histogram Versus Order
Residual Plots for MRR
0.050 0.025 0.000 1.2 1.0 0.8 0.15 0.10 0.05 0.050 0.025 0.000 225 175 125 0.050 0.025 0.000 SPEED FEED DOC 125 175 225 SPEED 0.05 0.10 0.15 FEED 0.8 1.0 1.2 DOC Interaction Plot for MRR
[image:8.612.72.519.404.570.2]Data Means
Figure 5 Residual plot and Interaction plot for MRR
Source DF Seq SS Adj SS Adj MS F P %C
Cutting Speed 2 54.40 27.20 27.20 93.2 0.011 77.09
Feed rate 2 11.69 11.69 5.84 20.04 0.048 16.5
DOC 2 3.89 3.89 1.94 6.67 0.13 5.5
Residual error 2 0.583 0.583 0.29 0.08
©IJRASET 2015: All Rights are Reserved
527
225 175 125 -27 -28 -29 -30 -31 -32 -33 -34 -35 -36 0.15 0.100.05 0.8 1.0 1.2
SPEED M e an o f S N r a ti o s FEED DOC
Main Effects Plot for SN ratios
Data Means
[image:9.612.71.521.89.241.2]Signal-to-noise: Larger is better
Figure 6 Main effect plot for S/N ratio of MRR
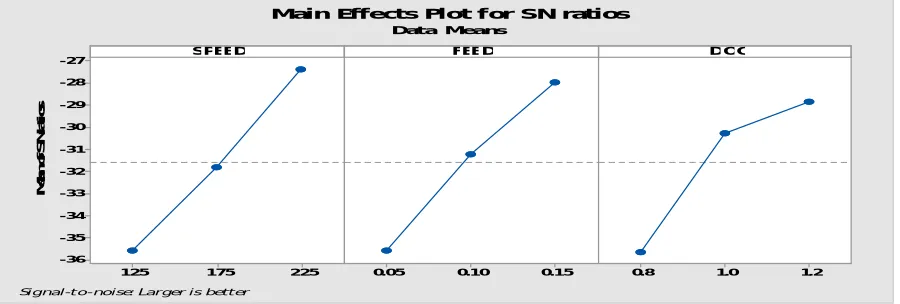
B. Plots For Surface Roughness
The main effect plot for SR is shown in figure8. From figure 7 the residual spread for SR lie along straight line that suggest the residual are distributed normally. From the ANOVA table 7 for SR the most significant factor is cutting speed with contribution 77.09% followed by feed rate with contribution of 16.5%. Other factors are less significant since p value is more than 0.05 for the confidence level 95%.
0.30 0.15 0.00 -0.15 -0.30 99 90 50 10 1 Residual P e rc e n t 1.25 1.00 0.75 0.50 0.2 0.1 0.0 -0.1 -0.2 Fitted Value R e si d u a l 0.2 0.1 0.0 -0.1 -0.2 3 2 1 0 Residual F re q u e n cy 9 8 7 6 5 4 3 2 1 0.2 0.1 0.0 -0.1 -0.2 Observation Order R e si d u a l
Normal Probability Plot Versus Fits
Histogram Versus Order
Residual Plots for SR
1.5 1.0 0.5 1.2 1.0 0.8 0.15 0.10 0.05 1.5 1.0 0.5 225 175 125 1.5 1.0 0.5 SPEED FEED DOC 12 5 17 5 22 5 SPEED 0.05 0.10 0.15 FEED 0.8 1.0 1.2 DOC Interaction Plot for SR
Data Means
[image:9.612.55.514.521.667.2]Figure 7 Residual plot and Interaction plot for SR
Figure 8 Main effect plot for S/N ratio of SR 225 175 125 4 3 2 1 0 -1 -2 -3 0.15 0.10
0.05 0.8 1.0 1.2
SPEED M e a n o f S N r a ti o s FEED DOC
Main Effects Plot for SN ratios Data Means
©IJRASET 2015: All Rights are Reserved
528
VII. CONCLUSION
In this study, the surface roughness and MRR in the surface finishing process of EN 354 alloy steel were analyzed through Taguchi design. The following conclusions have been drawn from the study:
The experimental results showed that the Taguchi parameter design is an effective way of determining the optimal cutting parameters for achieving low surface roughness.
The MRR is mainly affected by cutting speed (37.78%) and depth of cut (32.60%) and for SR the most significant factor are cutting speed (77.09%) followed by feed rate(16.5%). The depth of cut has least effect on both responses.
The best setting of input process parameters for MRR in turning within the selected range is as follows: cutting speed is 225 mm/min, feed rate is 0.15 mm/rev and depth of cut is 1.2 mm gives the optimal parameter design for MRR.
The best setting of input process parameters for SR in turning within the selected range is as follows: cutting speed is 225 mm/min, feed rate is 0.05 mm/rev and depth of cut is 1.2 mm gives the optimal parameter design for SR
REFERENCES
[1] Nirav M. Kamdar, Prof. Vipul K. Patel (2012),“Experimental investigation of machining parameters of EN36 steel using tungsten carbide cutting tool during hot machining”, International Journal Of Engineering Research And Application, Vol.2 (3), pp.1833-1838.
[2] Boothroyed, geoffery and A.Knight(1989) Fundamentals Of Machining And Machine Tools, 2nd Edition, Marcel Dekker, New York. [3] B.Y.Lee, H.S.Liu Y.S.Tarng/Journal of Material Processing Technology 74 (1998) 149-157.
[4] M. Adinarayana, G. Prasanthi,” Parametric Analysis And Multi Objective Optimization Of Cutting Parameters In Turning Operation Of AISI 4340 Alloy Steel With CVD Cutting Tool” IJRET, VOL.03(02),PP.2321-7308.
[5] Vishwanathan 2008 e chapter 3, Introduction to Taguchi Methods.
[6] M.kaladhar, K.venkata subbaiah, ch.srinivasa rao,” determination of optimum process parameters during turning of AISI 304 austenitic stainless steel using taguchi method and ANOVA”, International Journal of lean thinking volume-3,issue 1(june 2012).
[7] Tian-Syung Lan, “Parametric Deduction Optimization for Surface Roughness”. American Journal of Applied Sciences 7 (9): 1248-1253, 2010 ISSN 1546-9239.
[8] H. Yanda, J.A. Ghani, M.N.A.M. Rodzi, K. Othman and C.H.C. Haron., “optimization of material removal rate, surface roughness and tool life on conventional dry turning of FCD 700”, International Journal of Mechanical and Materials Engineering (IJMME), Vol.5 (2010), No.2, 182-190. [9] Ihsan Korkut, Mustafa Kasap, Ibrahim Ciftci, Ulvi Seker, “Determination of optimum cutting parameters during machining of AISI 304 austenitic
stainless steel”. Materials and Design 25 (2004) 303– 305.
[10] K.Senthil Kumar, J.S.Senthil Kumar, A. Srinivassan (2013), “Reducing surface Roughness by optimizing the turning parameters”, South African Journal of Industrial Engineering, Vol.24, PP.78-87.
[11] Jakhale prashant P, Jadhav.B.R (2007), “Optimization of surface roughness of alloy steel by changing operational parameters and insert Geometry in the turning process”, International Journal Of Advance Engineering Research And Studies, Vol. 32(4), PP.17–21.