Computational Techniques To Recover Missing
Data From Gene Expression Data
Hemalatha.S1, M.Hemalatha2
Department of Computer Science, Karpagam University, Coimbatore, TN, India.
Abstarct: Microarray gene expression data generally suffers from missing value problem due to a variety of experimental reasons. Since the missing data points can adversely affect downstream analysis, many algorithms have been proposed to impute missing values. In this survey, we provide a comprehensive review of existing missing value imputation algorithms, focusing on their underlying algorithmic techniques and how they utilize local or global information from within the data, or their use of domain knowledge during imputation. In addition, we describe how the imputation results can be validated and the different ways to assess the performance of different imputation algorithms, as well as a discussion on some possible future research directions. It is hoped that this review will give the readers a good understanding of the current development in this field and inspire them to come up with the next generation of imputation algorithms.
Key words : Missing Value Imputation , Gene Expression Data, Gene Expression Analysis, Information Recovery.
I. INTRODUCTION
Microarray technology has been one of the most useful tools in functional genomics research. It has been used widely in numerous studies over a broad range of biological disciplines, such as cancer classification, identification of genes relevant to a certain diagnosis or therapy, investigation the mechanism of drug action and cancer prognosis. Using this technology, the relative expression levels in two or more mRNA populations can be analyzed for tens of thousands of genes simultaneously. In a cDNA microarray experiment, two samples of fluorescence labeled cRNA targets which are reversed transcribed from mRNA purified from cellular contents are hybridized onto a cDNA microarray. If the cDNA sequence on the target is complementary to the DNA probe on a given spot, that cDNA will hybridize to the spot, where it will be detected by a laser scanner. The laser scanner will scan at the two specific wavelengths corresponding to the two fluorescence dyes, giving a two-channel signal. The ratio of the two fluorescence intensities at each spot indicates the relative abundance of the corresponding DNA sequence in the two cDNA samples. As one sample is the reference, the ratio expresses the extent to which the other sample is differentially expressed with respect to the reference. By examining the expression ratio of each spot, gene expression study can be performed. Missing values have been found to give nontrivial negative effect on some popular algorithms, such as hierarchical clustering and support vector machine (SVM) classifier, and many analysis methods such as principal component analysis (PCA) and singular value decomposition (SVD) cannot be applied to data with missing values.
A. The Missing Value Problem
In a typical gene expression data matrix, the rows are the genes (or oligonucleotides) under investigation and the columns are the experimental conditions or time points. The gene expression data matrix is obtained by performing a series of microarray experiments on the same set of genes, one for each column. Let the gene expression data be represented as an M×N matrix Y where the entries of Y are the expression ratios for M genes under N different conditions or time points. Then the element Yij denotes the expression level of the ith gene in the jth experiment. In general, there are two types of information available. The first type of information is the correlation structure between entries in the data matrix. In gene expression data matrix, correlation between rows exists due to the fact that genes involved in similar cellular processes usually have similar expression profiles.
B. Missing Value Imputation Techniques
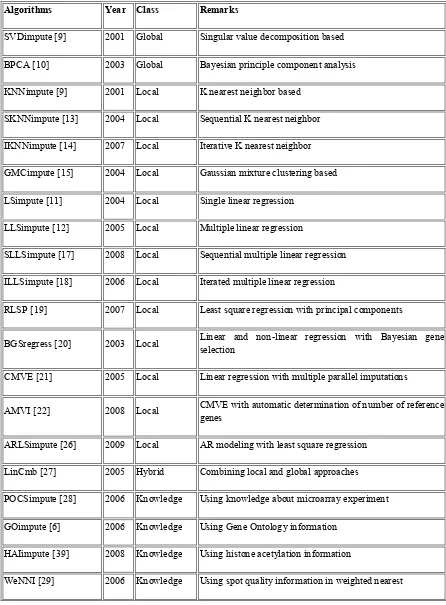
Table 1: Missing Value Imputation Algorithms Categorized into Different Classes
Algorithms Year Class Remarks
SVDimpute [9] 2001 Global Singular value decomposition based
BPCA [10] 2003 Global Bayesian principle component analysis
KNNimpute [9] 2001 Local K nearest neighbor based
SKNNimpute [13] 2004 Local Sequential K nearest neighbor
IKNNimpute [14] 2007 Local Iterative K nearest neighbor
GMCimpute [15] 2004 Local Gaussian mixture clustering based
LSimpute [11] 2004 Local Single linear regression
LLSimpute [12] 2005 Local Multiple linear regression
SLLSimpute [17] 2008 Local Sequential multiple linear regression
ILLSimpute [18] 2006 Local Iterated multiple linear regression
RLSP [19] 2007 Local Least square regression with principal components
BGSregress [20] 2003 Local Linear and non-linear regression with Bayesian gene selection
CMVE [21] 2005 Local Linear regression with multiple parallel imputations
AMVI [22] 2008 Local CMVE with automatic determination of number of reference genes
ARLSimpute [26] 2009 Local AR modeling with least square regression
LinCmb [27] 2005 Hybrid Combining local and global approaches
POCSimpute [28] 2006 Knowledge Using knowledge about microarray experiment
GOimpute [6] 2006 Knowledge Using Gene Ontology information
HAIimpute [39] 2008 Knowledge Using histone acetylation information
Algorithms Year Class Remarks
WeNNI_BC [45] 2008 Knowledge Using one-channel depletion information for bias correction
iMISS [23] 2006 Knowledge Using multiple external reference data sets
metaMISS[63] 2007 Knowledge Using database matrix obtained from databases of microarray data
C. Global Approach
Algorithms in this category perform missing value imputation based on global correlation information derived from the entire data matrix. They assume the existence of a global covariance structure among all genes or samples in the expression matrix. When this assumption is not appropriate, i.e. when the genes exhibit dominant local similarity structures, their imputation becomes less accurate. Well known imputation algorithms in this category include SVD imputation (SVDimpute) and Bayesian principal component analysis (BPCA). In SVDimpute, the SVD is used to obtain a set of mutually orthogonal expression patterns, called eigengenes, which can be linearly combined to approximate the expression of all genes in the data set. SVDimpute first regresses the gene against the k most significant eigengenes and then use the coefficients of the regression to reconstruct the missing values from a linear combination of the keigengenes. In BPCA, the N-dimensional gene expression vectors y is expressed as a linear combination of K principal axis vectors vl, i.e. , where the factor scores wl and the residual error ε are
regarded as normally distributed random variables in the probabilistic PCA model. An EM-like algorithm is then used to estimate the posterior distributions of the model parameter and the missing values simultaneously.
D. Local Approach
In contrast to global approach, algorithms in this category exploit only local similarity structure in the data set for missing value imputation. Only a subset of genes that exhibits high correlation with the gene containing the missing values is used to compute the missing values in the gene. Some of the earliest and well-known imputation algorithms, such as, K nearest-neighbor imputation (KNNimpute), least square imputation (LSimpute), local least square imputation (LLSimpute), are among this category.
KNNimpute is perhaps one of the earliest and most frequently used missing value imputation algorithms. KNNimpute uses pair wise information between the target gene with missing values and the K nearest reference genes to impute the missing values. The missing value j in the target gene is estimated as the weighted average of the jth component of the K reference genes with the weights set proportional to the inverse of the Euclidean distance between the target and the reference genes. KNNimpute performs well when strong local correlation exists between genes in the data. Several modifications to the basic KNNimpute algorithm have been proposed. In sequential KNNimpute (SKNNimpute), imputed genes are reused in later missing value imputation of other genes. In Gaussian mixture clustering imputation (GMCimpute), the data is clustered into S components Gaussian mixtures using the EM algorithm. Then the S estimates of the missing value, one from each component, are averaged to obtain the final estimate of the missing value. The clustering and estimation steps are iterated until the cluster memberships of two consecutive iterations are identical.
more complex BPCA.
Collateral missing value imputation (CMVE) is a local imputation technique that utilizes the concept of multiple parallel estimation of missing values to improve the final estimation. In CMVE, the K reference genes are selected by using the absolute covariance value between the reference gene and the target gene. The first estimate of the missing value is then obtained by solving a single least square (LS) regression problem as in LSimpute. Then the K genes are used to jointly estimate the AR coefficients and the missing values are estimated by solving a least square problem using the estimated AR coefficients.
E. Hybrid Approach
The correlation structure in the data affects the performance of imputation algorithms. If the data set is heterogeneous, local correlation between genes are dominant and localized imputation algorithms such as KNNimpute or LLSimpute perform better than global imputation methods such as BPCA or SVDimpute. On the other hand, if the data set is more homogenous, a global approach such as BPCA or SVDimpute would better capture the global correlation information in the data. In, Jornstenet al. proposes a hybrid approach called LinCmb that captures both global and local correlation information in the data. In LinCmb, the missing values are estimated by a convex combination of the estimates of five different imputation methods: row average, KNNimpute, SVDimpute, BPCA and GMCimpute. Row average, KNNimpute and GMCimpute uses local correlation information in their imputation, whereas SVDimpute and BPCA uses global correlation information in their imputation The weights are then obtained by performing a least square regression on the estimated fake missing entries. The final weights for LinCmb are obtained by averaging the weights obtained in 30 iterations. LinCmb has been shown to be adaptive to the correlation structure of the data matrix in that if there are more missing entries in the data matrix, more weights are placed on the global methods.
F. Knowledge Assisted Approach
The common theme for algorithms in this category is the integration of domain knowledge or external information into the imputation process. The use of domain knowledge has the potential to significantly improve the imputation accuracy beyond what is possible with purely data-driven approach, especially for data sets with small number of samples, noisy, or with high missing rate. Algorithms in this category can make use of, for example, knowledge about the biological process in the microarray experiment, knowledge about the underlying biomolecular process as annotated in Gene Ontology (GO), knowledge about the regulatory mechanism, information about spot quality in the microarray experiment, and information from multiple external data sets.
In GOimpute, the semantic similarity is used as the external information on the functional similarity of two genes. GOimpute considers the BP and MF ontologies when calculating the semantic dissimilarity between two genes gi and gj. The
semantic dissimilarity ds(gi,gj) and the expression level distance d(gi,gj) are combined to form a combined distance defined as
, where the positive weight α controls the relative contribution of the two distance measures. The histone acetylation information aided imputation (HAIimpute) framework proposed in ref. Integrates histone acetylating information into KNNimpute and LLSimpute to improve the accuracy of missing value estimation. HAIimpute uses the histone acetylation data of Saccharomyces cerevisiae from ref., where genome wide histone acetylation levels at 11 sites for both Intergenic regions (IGRs) and open reading frames (ORFs) were measured. In ref., clusters of genes with similar acetylation patterns across the 11 residues were determined by the k-means algorithm.
The imputed value is taken as a linear combination of the original value and the value suggested by its neighbors, i.e.
, where takes into account the quality weights of the neighbors and the distance between the neighbors and the original value.
Given a gene expression data set A, the missing values in a column in A are imputed by first finding a set of 40 most similar columns from the database matrix or from A as measured by the absolute Pearson correlation. GMCimpute is then used to impute the missing values in the column from this set of 40 most similar columns. Their results indicated that better imputation accuracy in terms of NRMSE can be obtained with this approach.
II. VALIDATION OF IMPUTATION RESULTS
done by computing certain performance indices between the imputed and the (known) original values. We called this kind of validation internal validation, i.e. the validation uses only information in the data set. Examples of performance indices for internal validation include: (i) fidelity to true expression values, (ii) preservation of internal structures in the data set, (iii) preservation of significant genes in the data set and (iv) preservation of discriminative/predictive power for classification.
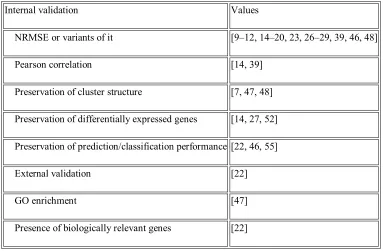
Table 2: Performance Assessment of Missing Value Imputation Algorithms
Internal validation Values
NRMSE or variants of it [9–12, 14–20, 23, 26–29, 39, 46, 48]
Pearson correlation [14, 39]
Preservation of cluster structure [7, 47, 48]
Preservation of differentially expressed genes [14, 27, 52]
Preservation of prediction/classification performance [22, 46, 55]
External validation [22]
GO enrichment [47]
Presence of biologically relevant genes [22]
Internal Validation: Fidelity to True Expression Values
The most common method to assess imputation accuracy is to compute the normalized root mean square error (NRMSE) or variants of it [e.g. RMSE, where the denominator in Equation (1) is replaced by mn] between the imputed values and the true values. The
NRMSE is defined as: (1) where gik denotes the value of the kth experiment
for gene gi, and g and denote the true value and the imputed value respectively. To overcome the non-availability of ground truth,
assessment of imputation algorithm is usually done on the complete data matrix derived from the original data matrix. The accuracy of imputation is assessed using the MSD
(2) where is the imputed data, is the replicate data, and the summation is run over all expression values in the replicate data set except where they are marked as invalid in the data pre-processing step. One can see that except for the choice of ground truth, the MSD is the same as the squared of the RMSE.
A. Preservation of Internal Structures
by (3) where n(uj) and n(vj) are the
cardinalities of the clusters uj and vj, respectively, and equals one if gene g does not belong to the cluster uj, and zero
otherwise. Every possible combination of ui∈U, vj∈V pair would generate a K×K matrix of . Then the optimum K
cluster pairs can be obtained from the K×K matrix by solving an assignment problem using the Hungarian algorithm. Finally, given
the optimum k cluster pairs {uj∈U, vj∈V}, the ADBP error is calculated as (4) Imputation
algorithm that produces a lower ADBP error could preserve the structure within the data set better than algorithm that has a higher ADBP error.
B. Preservation of Significant Genes
Ideally, a good imputation algorithm should preserve interesting genes in the data set, while minimizes the chance of artificially inflating genes that were originally non-differentially expressed [14, 27, 52]. In ref. [52], the change in the list of differentially expressed genes detected due to imputation is used as a performance measure for imputation algorithms. Then, standard or regularized t-test is applied to the imputed data set and the list of genes sorted by the P-value is compared to the gold standard to compute the false positive rate at a false negative rate of 0 and 5%.
C. Preservation of discriminative/predictive power
The performance of imputation algorithms can also be assessed by how the imputation affects the classification accuracy of the imputed data set for different disease types. The study in ref looks at the effects of missing values and their imputation on classification performance. Three imputation algorithms (KNNimpute, LLSimpute and BPCA) are applied to five different cancer data sets and the classification accuracy is assessed by three different classifiers [SVM, KNN, classification and regression tree (CART)]. It was shown that except for replacement by zeros, other imputation algorithms have little difference in affecting classification performances of the SVM or KNN classifiers.
D. External Validation
External validation assesses the merit of an imputation algorithm by examining how it affects downstream biological analysis with the aid of external information related to functional annotation or pathway information.
In many microarray experiments, the goal is to detect sets of genes that share similar functional roles. Once clustering has been done, a biologist typically looks for GO terms that are significantly enriched among the genes of each cluster. The GO terms can then be used to characterize the functional roles of the genes under study. Hence, one way of assessing the performance of an imputation algorithm is to check for significant enrichment of GO terms in gene clusters. In ref., the enrichment P-value for each
GO terms t and for each cluster is calculated by (5) where b is the number of genes in the cluster, K is the number of genes in the cluster annotated with GO term t, B is the number of genes in the data set, and T is the number of genes in the data set annotated with GO term t. The P-value in ref. (20) expresses the probability of randomly finding the same or higher number of genes annotated with the particular GO term in the cluster from the data set.
III. FACTORS AFFECTING IMPUTATION PERFORMANCE
correlation structure in the data, the missing-data mechanism, the distribution of missing entries in the data, and the percentage of missing values in the data. To measure the underlying correlation structure in the data set, an entropy measure of the data set D,
given by (6) where and , i = 1,…, k, are the eigenvalues of the covariance matrix of the data, is used to measure the dispersion in the eigenvalues. Low entropy indicates that the data are strongly correlated. In contrast, high entropy indicates a complex data exhibiting strong local substructure. As expected, global methods, such as SVDimpute and BPCA, perform better on microarray data sets with low entropy and local methods, such as LLSimpute and KNNimpute, perform better on high entropy data sets.
IV. DISCUSSION AND FUTURE DIRECTIONS
In spite of the many recent advances, better imputation algorithms that can adapt to the characteristics of the data are still needed. Adaptive method that could capture both global and local correlation information in the data set would be useful in many situations. One attempt in this direction is the hybrid approach LinCmb we discussed in ‘Hybrid approach’ section. It is also unclear whether the simple scheme of linearly combining the estimates from multiple imputation algorithms is the best strategy to adopt or some other more sophisticated strategy is needed. One possible combination strategy is to combine multiple estimates based on the variance in each of the estimates. This requires the estimation of the variance of each imputation, which could be done by a procedure called multiple imputations.
V. CONCLUSION
High throughput gene expression profiling techniques such as cDNA microarray technology usually suffer from missing value problem due to various experimental reasons. As many downstream analysis methods require a complete data set, missing value imputation is an important pre-processing step in microarray data analysis. Troyanskayaet al. Were the first to bring this important problem to the attention of the bioinformatics research community. Since then, many missing value imputation algorithms have been proposed. In this article, we present a comprehensive review of many of these algorithms, categorizing them in terms of how they utilize information from within the data or information from domain knowledge or external sources in the imputation. In our discussion, we group different imputation algorithms into local approach, global approach, hybrid approach or knowledge assisted approaches. Validation of imputation result is an important step in assessing the performance of any imputation algorithm. To date, there is a lack of any systematic discussion of this important issue. In this article, we summarize the various validation methods used by different researchers and categorized them into either internal or external validation, based on whether internal information from within the data set or external biological knowledge is used. Finally, we conclude the survey by pointing out some possible future research directions. It is hoped that this comprehensive review would give the readers a better understanding of the current development in this field and inspire them to come up with the next generation of imputation algorithms.
A. Key Points
1) Global correlation information, local similarity information and domain knowledge have been successfully exploited in many existing missing value imputation algorithms.
2) The performance of an imputation algorithm can be assessed using internal data-driven validation and external domain/application-specific validation.
3) There is no one optimal imputation algorithm for all type of data. Knowledge of the underlying principle of the imputation algorithm and the characteristic of the data is needed for a good imputation performance.
REFERENCES
[1] HoheiselJD. Microarray technology: beyond transcript profiling and genotype analysis. Nat Rev Genet 2006;7: 200-10.
[5] DugganDJ, BittnerM, ChenY, et al.Expression profiling using cDNA microarrays. Nat Genet 1999;21:10-4.
[6] TuikkalaJ, EloL,NevalainenO,et al. Improving missing value estimation in microarray data with gene ontology. Bioinformatics 2006; 22(5):566-72. [7] Bras LP, Menezes JCImproving cluster-based missing value estimation of DNA microarray data. Biomolecular Eng 2007;24:273-82.
[8] Ouyang M, Welsh WJ, Georgopoulos PGaussian mixture clustering and imputation of microarray data. Bioinformatics 2004; 20(6):917-23.
[9] Brock GN, Shaffer JR, Blakesley RE, et alWhich missing value imputation method to use in expression profiles: a comparative study and two selection schemes. BMC Bioinformatics 2008; 9:12.
[10] Zhang X, Song X, Wang H, et al local least squares imputation estimating missing value of microarray data. Comp Biol Med 2008;38:1112-20. [11] Cai Z, Heydari M, Lin G Iterated local least squares microarray missing value imputation. J Bioinform Comput Biol 2006;4(5):935-57. [12] Yoon D, Lee EK, Park TRobust imputation method for missing values in microarray data. BMC Bioinformatics 2007;8 Suppl. 2:S6.
[13] Zhou X, Wang X, Dougherty ERMissing value estimation using linear and non-linear regression with Bayesian gene selection. Bioinformatics 2003;19(17):2302-7.
[14] Sehgal MS, Gondal I, Dooley LSCollateral missing value imputation: a new robust missing value estimation algorithm for microarray data. Bioinformatics 2005;21(10):2417-23.
[15] Sehgal MS, Gondal I, Dooley LS, et alAmeliorative missing value imputation for robust biological knowledge inference. J Biomed Inform 2008;41:499-514.
AUTHORS PROFILE
Dr.M.Hemalatha completed MCA, MPhil., PhD in Computer Science and currently working as a Professor and Dept. of Computer Science in Karpagam University. Twelve years of Experience in teaching and published more than hundred papers in International Journals and also presented more than eighty one paper in various national conferences and international conference. Area of research is Data Mining, Software Engineering, Bioinformatics, and Neural Network. She is a Reviewer in several National and International Journals.