EFFECT OF CMMI-BASED SOFTWARE PROCESS MATURITY ON SOFTWARE SCHEDULE ESTIMATION
Maged A. Alyahya, Rodina Ahmad, Sai Peck Lee
Department of Software Engineering, FCSIT University of Malaya, Kuala Lumpur, Malaysia
[email protected], [email protected], [email protected]
ABSTRACT
The Software Capability Maturity Model (SW-CMM) has become a popular model for enhancing software development processes with the goal of developing high-quality software within budget and schedule. The software cost estimation model, COnstructive COst MOdel (COCOMO), in its last update (COCOMO II) has a set of seventeen cost drivers and a set of five scale factors. Process Maturity (PMAT) is one of the five scale factors and its ratings are based on SW-CMM. This paper investigates the impact of process maturity on software development Schedule (cycle time) by deriving a new set of COCOMO II’s PMAT rating values based on the most recent version of CMM, i.e. Capability Maturity Model Integration (CMMI). The precise data for the analysis were collected from the record of 40 historical projects which spanned the range of CMMI Levels, from Level 1 (Lower half and Upper half) to Level 4, where eight data points were collected from each level. The Ideal Scale Factor (ISF) method is applied in order to withhold the effect of the COCOMO II’s PMAT scale factor. All prediction accuracies evaluations were measured using PRED (.20). The study shows that the proposed model (with the new PMAT rating values) produced better schedule estimates as compared to the generic COCOMO II model’s schedule estimates.
Keywords: Schedule estimation, scale factor, cost driver, COCOMO, SW-CMM, CMMI.
1.0 INTRODUCTION
favorable for most companies [3]. Hence, the need arises to come up with a more effective model to account for the schedule of developing software systems. A number of algorithmic models have been proposed as the basis for estimating the schedule of a software project. They are conceptually similar but use different parameter values. While most of those software models are proprietary, COCOMO II (our primary focus in this study) is a fully documented and widely accepted model, updated from original COCOMO 81 [4] till its most recent version, COCOMO II [5].
1.1 Problem Overview
Accurate software effort and schedule estimation is important for effective project management such as budgeting, project planning and control. Software development schedule estimation has been a difficult task. The accuracy of a software effort and schedule estimation model has a direct and significant impact on the quality of the firm‟s software investment decisions [6]. Unfortunately, despite the large body of experience with effort and schedule estimation models (including COCOMO), the accuracy of these models is still far from being satisfactory [7]. Different software schedule estimation models have different inputs. The impact of these inputs may vary from one model to another. From the results of studies on the effect of process maturity's on software development project‟s cycle time, it seems reasonable to suggest that it is an important input to software effort and schedule estimation models. Despite the fact that the Software Engineering Institute at Carnegie Mellon University (CMU-SEI) has released the Capability Maturity Model Integration (CMMI), which is the updated version of the original CMM, COCOMO II still relies on SW-CMM to assess its PMAT scale factor. Many investigations, ideas, and methods have been proposed by researchers to enhance the predictive ability of COCOMO II model. To the best of our knowledge, studies that focus on the effects of CMMI-based software process improvement on COCOMO II‟s schedule estimation are missing in the literature.
1.2 Research Hypothesis
The hypothesis of the work presented here is that deriving a set of new PMAT values under the Capability Maturity Model Integration (CMMI), would improve the prediction power of the COCOMO II model in terms of its schedule estimation ability, and thus make it precisely applicable in software development organizations that are adopting CMMI. The rest of this research is organized as follows: Section 2 presents the definition of the COCOMO Model and surveys an overview of the CMM and CMMI-based Process Maturity; Section 3 presents a few researches that are related to this study; Section 4 describes the data gathering and data analysis methods. Section 5 presents the results and discussion, while Section 6 offers some conclusions of this study and presents recommended future works.
2.0 BACKGROUND
The Constructive Cost Model (COCOMO), was originally published in 1981 (COCOMO 81) [4], and became one of most popular parametric cost estimation models of the 1980s. But in the 90s, COCOMO 81 faced a lot of difficulties and complications in estimating the costs of software that were developed to a new life cycle processes such as non-sequential and rapid development process models, reuse-driven approaches, and object-oriented approaches [8]. Thus, COCOMO II was published initially in the Annals of Software Engineering in 1995 with three sub models; an application-composition model, an early design model and a post-architecture model [8]. COCOMO II has, as an input, a set of seventeen effort multipliers (EM) or cost drivers which are used to adjust the nominal effort (PM) to reflect the software product being developed. The seventeen COCOMO II factors (cost drivers) are shown in Table 1 [5].
2.1.1 Effort Estimation
The COCOMO II effort estimation model is formulated as in (1). This model is used for both Early Design and Post-Architecture models to estimate effort. The inputs are the Size of software development, a constant A, an exponent E, and a number of effort multipliers (EM). The number of effort multipliers depends on the model being used.
where the constant A=2.94, and the exponent E will be described in the following section.
2.1.2 Scale Factors
A study accomplished by [9] presents the conclusion that the most critical input to the COCOMO II model is size, so, a good size estimate is very important for any good model estimation. Size in COCOMO II is treated as a special cost driver, so it has an exponential factor, E. The exponent E in (2) is an aggregation of five scale factors. All scale factors have rating levels. These rating levels are very low (VL), low (L), nominal (N), high (H), very high (VH) and extra high (XH). Each rating level has a weight, W, which is a quantitative value used in the COCOMO II model. The five COCOMO II scale factors are shown in Table 1 [5]:
where B is a constant = 0.91.
A & B are constant values devised by the COCOMO team by calibrating to the actual effort values for the 161 projects currently in COCOMO II database.
2.1.3 Schedule Estimation
Project Schedule months is the number of calendar months from the time the development begins through the time it is completed. Boehm et al. [5] have produced (3) to estimate the project scheduling months. It has denoted as Time to Develop, TDEV:
(2)
(1)
where C = 3.67, PM is the Person-Months, and F, as stated in (4), is the schedule equation exponent derived from the five Scale Factors.
where D= 0.28 and SF is the COCOMO II‟s scale factor.
[image:4.612.55.553.246.457.2]C & D are constant values devised by the COCOMO team by calibrating to the actual schedule values for the 161 projects currently in COCOMO II database.
Table 1. COCOMO II Scale Factors and Cost Drivers.
Scale Factors Cost Drivers
Precedentedness (PREC)
Required Software Reliability
(RELY) Programmer Capability (PCAP). Data base size (DATA). Application Experience (APEX).
Development Flexibility (FLEX)
Developed for Reusability (RUSE). Platform Experience (PLEX).
Documentation needs (DOCU). Language & Tool Experience (LTEX).
Risk Resolution (RESL)
Product Complexity (CPLX). Personnel Continuity (PCON). Execution Time Constraints
(TIME). Use of Software Tools (TOOL). Team Cohesion
(TEAM)
Main storage Constraints (STOR). Multisite Development (SITE). Platform Volatility (PVOL). Development Schedule (SCED). Process Maturity
(PMAT) Analyst Capability (ACAP).
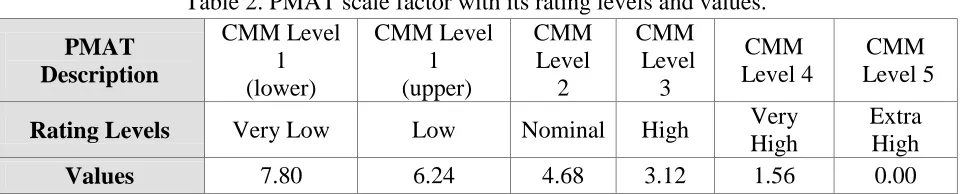
[image:4.612.68.548.533.630.2]The procedure for determining PMAT – the factor of interest in this study - is organized around the Software Engineering Institute‟s Capability Maturity Model (SEI-CMM), Table 2 [5].
Table 2. PMAT scale factor with its rating levels and values.
PMAT Description
CMM Level 1 (lower)
CMM Level 1 (upper)
CMM Level
2
CMM Level
3
CMM Level 4
CMM Level 5
Rating Levels Very Low Low Nominal High Very
High
Extra High
Values 7.80 6.24 4.68 3.12 1.56 0.00
According to [10], The CMM Level 1 (lower half) is for organizations that depend on “heroes” to do the task. They do not concentrate on repeatable processes. The CMM Level 1 (upper half) is for organizations that have adhered to most of the requirements that satisfy CMM Level 2. In the published definition of CMM, Level 1 (Lower half) and (Upper half) are grouped into Level 1.
2.2 CMMI-based Process Maturity
The Software Capability Maturity Model (SW-CMM) published by SEI is used to rate an organization‟s process maturity [11]. SW-CMM provides a number of requirements that all organizations can use in setting up the software processes used to control software product development. The SW-CMM specifies “what” should be in the software process rather than “when” or “for how long”. There are five levels of process maturity, Level 1 (lowest half) to Level 5 (highest). To be rated at a particular level, the organization should demonstrate capabilities in a set of Key Process Areas (KPA) associated with a specific SW-CMM level. The capabilities demonstrated in moving from lower levels to higher levels are cumulative. For example, Level 3 organizations should show compliance with all KPAs in Level 2 and Level 3. The detailed information on SW-CMM Process Maturity is available in [11].
Since (SW-CMM) was released, it was applied to many areas; therefore, several capability maturity models have been provided. These included people CMM (P-CMM), system engineering CMM (SE-CMM), the software acquisition CMM (SA-CMM), and the integrated product development CMM (IPD-CMM) (EPIC, 1996). As these models were built by different organizations, there were an overlapping in the application‟s scopes in addition to the lack of consistency in the terminology, assessment approach, and architecture. These problems led to the increase of time and cost to adopt multiple models. Therefore, the Software Engineering Institute, SEI, has released in 2000 the Capability Maturity Model Integration (CMMI) in order to integrate all existing capability maturity models. On August, 2000, (CMM) was replaced by a new process model, which is the Capability Maturity Model Integration (CMMI). The Capability Maturity Model Integration (CMMI) was created to reduce redundancy, to support product and process improvement, and to eliminate undesired inconsistency experienced by organizations that are using multiple models. The CMMI combines all relevant process models found in CMM into one product suite [12].
There are two representations of CMMI: continuous representation; and staged representation. The continuous representation focuses on the capability of process areas, while the staged representation focuses on the organizational maturity. This work concentrates in CMMI staged representation which is discussed briefly below.
Like CMM, there are five maturity levels in CMMI, numbered through 1 to 5 in staged representation. Maturity levels are defined in terms of related specific and generic process areas and the achievement of their requirements. Achievement of specific and generic goals related to a process area determines the organization‟s maturity level. Refer to [12] for more details about CMMI.
3.0 LITERATURE REVIEW
improvement. Our work is a kind of combination between the previous two perspectives, i.e. we improved the schedule prediction power of the COCOMO II model by investigating the benefits of CMMI-based software process maturity.
COCOMO II is being revised, updated, and calibrated to be more suitable for future estimation. There are several calibrations conducted on COCOMO II [13, 14, 15, 16, 17]. Also, numerous studies have been done to enhance the predictive power of the COCOMO model by adding or reducing some influencing factors or cost drivers [2, 18, 19, 20, 21, 22].
Chulani et al. [13] reported a study with a regression tuning algorithm using the COCOMO project database producing estimates that are within 30% of the actual values, 69% of the time, while Clark [15] reported a study in which the Bayesian 38 tuning are within 30% of the actual values, 76% of the time after stratification by the organization. Yahya et al. [22] improved the COCOMO II‟s predictive power by adding a set of 16 factors to the model and considered it as the most influential factors in their local environment; they claimed that their enhanced model has improved the COCOMO II‟s predictive power by 9% as compared to the generic COCOMO II. Chen et al. [19] concluded that the COCOMO II model can be improved via WRAPPER feature subset selection method developed by the data mining community. Using data sets from the PROMISE repository, they showed WRAPPER significantly and dramatically improves COCOMO II‟s predictive power. Huang et al. [23] have proposed a novel neuro-fuzzy Constructive Cost Model for software cost estimation. They claimed that the validation using industry project data shows that the model greatly improves estimation accuracy in comparison with the generic COCOMO model. Baik argued in [18] that disaggregation of the TOOL variable in COCOMIO II improves the prediction accuracy from 67% to 87%.
On the other hand, much has been discussed on the benefits of increasing maturity levels as well as the benefits of CMMI-based software process improvements [10, 24, 25, 26, 27, 28, 29, 30].
By adopting the CMM, researchers have found that the control, predictability, and the effectiveness of the processes are importantly enhanced. According to [31], each CMM level enhance the quality of the product and generally reduces the development schedule. Manish and Kaushal [30] focused exclusively on CMM level 5 software projects from several organizations to investigate the effects of highly mature processes maturity on development effort, quality, and schedule. Based on historical data projects from 37 CMM level 5 of four organizations and by using a linear regression model, they found that high process maturity levels, as indicated by the rating of CMM level 5, reduce the impacts of most factors that previously were believed to affect the software development effort, quality, and schedule such as personnel capability, requirements volatility, and requirements specifications. They also claimed that the only factor found to be important in determining effort, schedule, and quality was the software size. On the average, their developed models estimated effort and schedule around 12% percent and defects to about 49% of the actual, across organizations. In general, their results indicated that some of the biggest advantages from high levels of organizational process maturity come from the obvious reduction in variance of software development outcomes that were previously caused by some factors other than size of the software.
the process maturity versus effects of other factors, concluding that an increase of one process maturity level can reduce development effort by 4% to 11%, but this reduction seemed like a generalization across all five levels of CMM process maturity, i.e. the percentage of effort reduction is not the same among all levels. Despite the fact that several researches and case studies have shown many benefits of enhancing organizational process maturity by using different assessment approaches [29], [23], [32], none has attempted to isolate individual factors that affects productivity as shown by Clark when he isolated the effects of process maturity on effort versus other factors. Nevertheless, they indicated that increasing organizational maturity levels will generally have some considerable effects.
Donald et al. [26] have conducted an empirical research to find out the relationship between quality of the products, organizational process maturity, development effort, and project‟s schedule for a set of 30 software products in IT firms. Their findings indicated that process maturity has an effect in reducing software development schedule and effort. Diaz and Sligo [31] reported that the process maturity level also has some effects on software development schedule by indicating how software process improvement helped Motorola. Based on some measurements, Motorola‟s software development schedule was around eight times faster at CMM level 5 than at CMM level 1.
Despite numerous studies on the performance assessment results of CMM-based software process maturity and its impact on software development effort and schedule, there is still very limited works on the overall CMMI-based software process maturity [33]. Unlike previous studies in the literature that addressed the benefits of CMMI-based software process maturity and, [33] in terms of six dimensions of the performance assessment considered the performance assessment for both tangible and intangible benefits of CMMI adoption. They presented the results of performance assessment of the CMMI-based Software process improvement based on an empirical study from 18 software firms in Taiwan, which have already obtained CMMI maturity level 2 and 3 certifications. They argued that their empirical study revealed that the CMMI-based software process improvement has a positive effect on the six performance dimensions in their investigated software firms. However, the gained benefits were in “Lighten the load of project members”, “Improve product usability”, “Improve product efficiency”, “Improve product portability”, “Increase bargain power” and “Reduce the project effort and schedule”.
Another study conducted by [29] reported some great quantitative evidence that Capability Maturity Model Integration (CMMI)-based software process improvement can give a higher quality products and better project performance with lower cost and decreased project schedule. The reported results were drawn from a set of 12 cases from 11 independent firms. Since the performance results provided by [29] are limited, [28] continued the assessment performance of CMMI-based software process improvement. Results are drawn from a variety of small and huge organizations around the world. They reported that most of their results come from higher maturity organizations, but some notable enhancements also have been achieved by lower maturity organizations. Great quantitative results obtained for all six performance categories discussed in [28] including software cost and schedule.
Table 3: Summary of benefits and impact of CMMI adoption–Schedule [28]
# Results Organization
1
On-time delivery remained well over 90 percent, moving from 97% to 99%, with a slight improvement as the organization moved from SW-CMM maturity level 3 to CMMI maturity level 5
IBM Australia Application Management Services 2 70 to 80 percent reduction in average slippage of project delivery
dates as the organization achieved CMMI maturity level 2 JP Morgan Chase
3
Average days variance from development plan reduced from approximately 130 days to less than 20 days one year after reaching CMMI maturity level 2
NCR
4
Met every schedule milestone (25 in a row) on time, with high quality and customer satisfaction in a CMMI maturity level 5 organization
Northrop Grumman IT, Defense Enterprise
Solutions
5
Substantially improved schedule variance over three causal analysis and resolution cycles in a CMMI maturity level 5 organization with PSP-trained engineers
Northrop Grumman IT, Defense Enterprise
Solutions
6
Schedule variance improved from approximately 25 percent to 15 percent as the organization moved from SW-CMM maturity level 3 to CMMI maturity level 5
Reuters
7
On-time deliveries improved from 79 percent to 89 percent as the organization moved from SW-CMM maturity level 3 toward CMMI maturity level 4
Systematic Software Engineering
8 Schedule variation decline by 63 percent as the organization
moved from SW-CMM maturity level 4 to CMMI maturity level 5 The Boeing Company
4.0 RESEARCH METHODOLOGY
The primary data collection tool was a questionnaire that has been used in order to collect historical data from individual projects, i.e. each questionnaire should be applied only on one project. The questionnaire is based on "COCOMO II Cost Estimation Questionnaire" which was prepared in the Center of Software Engineering at University of Southern California, for COCOMO II‟s annual updating [34].
4.1 Data Collection Procedure
4.2 Data Analysis
Once the questionnaires were returned, they were checked for consistency and went through a data validation process, based on some constraints determined in [5].
In fact, for each questionnaire, there are five aspects that would be extracted and computed: 1. A set of seventeen COCOMO II's cost drivers. To deal with these seventeen cost drivers,
we computed their multiplication. A sample of the cost drivers is shown in Table 4. 2. A set of five exponential scale factors. To deal with these five scale factors, we computed
their summation. A sample of these scale factors is shown in Table 5 (excluding the last row).
3. Actual effort in Person-Months (PM), (see Table 6). 4. Actual schedule in calendar months, (see Table 6).
5. The size of the project. We collected the project size as a thousand source lines of code (KSLOC), which is the baseline size in COCOMO II.
Equation (1) was applied to predict the effort using COCOMO II. We also applied (3) to predict the project‟s scheduling months (TDEV) using COCOMO II. At the end of this analysis, we got the estimated effort and scheduling months for the generic COCOMO II as well as the actual effort and schedule for the current project.
To derive the new PMAT values, we computed Ideal Scale Factor (ISF) (See the next section).
4.3 Ideal Scale Factor (ISF) Analysis on PMAT
Boehm [4] described a method to normalize contaminating impacts of individual cost driver attributes in order to have a clearer picture of that cost driver‟s contribution. Since we have a relatively similar situation, i.e. we need to normalize contaminating effects of a scale factor (in our case, PMAT) rather than a cost driver. Therefore, in our context, we defined that:
For the given project P, compute the estimated development effort using the COCOMO II estimation procedure, with one exception: do not include the value for the Scale Factor Attribute (SFA) being analyzed. Call this estimate PM (P,SFA). Then the ideal Scale Factor, ISF(P, SFA), for this project/scale-factor combination is defined as the value which, if used in COCOMO II, would make the estimated development effort for the project equal to its actual development effort PM(P, Actual). i.e.
where
• ISF (P, PMAT): the Ideal Scale Factor on PMAT for project P. • PM (P, Actual): the actual development effort for the project P.
• PM (P, PMAT): COCOMO II estimate excluding the PMAT scale factor. • PM: Person-Months.
4.3.1 Steps for ISF-PMAT Analysis
Effect Of CMMI-Based Software Process Maturity On Software Schedule Estimation, pp 121-137
We performed the following steps to complete the ISF-PMAT analysis on our datasets: 1. Compute the PM(P, SFA), by using the following equation:
Where A is a model constant, EM is a set of seventeen effort multipliers (see Table 1), and
where B is a` model constant, and SF_But_PMAT refers to scale factors except PMAT, including PREC, FLEX, RESL, and TEAM.
2. Compute the ISF (P, SFA) by using (5).
3. Group ISF (P, SFA) by the current CMM PMAT rating (i.e. VL, L, N, H, VH).
4. Compute the mean value for each group as ISF-PMAT value for that rating. This step involves the computation of the mean value of ISF-PMAT for each CMM rating level. At the end of this stage, we estimated the scheduling months using the new derived PMAT values.
4.4 Evaluation of the Prediction Accuracy
The focus of this paper is on the degree to which the model‟s estimated effort measured in Person-Month (PMes) matches the actual effort (PMact). If the model is perfect (this is rare) then for any project, PMes = PMact. A common criterion for the evaluation of cost estimation models is the Relative Error (RE) or the Magnitude of Relative Error (MRE), which are defined as:
The RE and MRE values are calculated for each project whose effort is predicted. Another criterion that is commonly used is the percentage of predictions that fall within P % of the actual, denoted as PRED (P) [35],
K is the number of projects where MRE is less than or equal to P, and N is the number of projects. Our proposed model is evaluated at PRED (.20), which is done by counting the number of MRE in the equation that are less than or equal to .20 and dividing by the number of projects.
Table 4 through Table 8 show a sample of the calculated data, which represents one project from our forty datasets.
Table 4. COCOMO II cost drivers with their effort multipliers.
Cost Driver Value Cost Driver Value
RELY 0.92 PCAP 0.88
(11) PRED (P) = K / N
(10) PRED (P) = K / N
(6)
(7)
(8) RE= (PMes - PMact)/PMact
(9)
Malaysian Journal of Computer Science, Vol. 22(2), 2009 131
DATA 1.28 PCON 0.9
RUSE 1 APEX 0.81
DOCU 1 SCED 1
TIME 1.11 LTEX 0.84
STOR 1.05 TOOL 0.78
PVOL 0.87 SITE 0.86
ACAP 0.71
PLEX 0.85
CPLX 1.34
5.0 RESULTS AND DISCUSSION
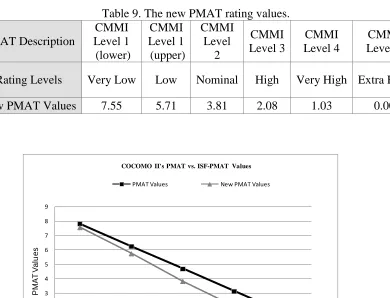
[image:11.612.65.547.73.185.2]After applying our methodology to the forty datasets, a new set of PMAT rating values under CMMI has been derived as in Table 9.
Table 9. The new PMAT rating values.
PMAT Description CMMI Level 1 (lower) CMMI Level 1 (upper) CMMI Level 2 CMMI Level 3 CMMI Level 4 CMMI Level 5
Rating Levels Very Low Low Nominal High Very High Extra High
New PMAT Values 7.55 5.71 3.81 2.08 1.03 0.00 Table 8. Estimated Effort and schedule with new
PMAT values.
Description value
∑scale factors with ISF-PMAT 13.49 Estimated Effort with ISF-PMAT 153.32 Magnitude Relative Error (Effort)= 0.20
Estimated Schedule 18.45 Magnitude Relative Error (Schedule)= 0.05 Table 5: Scale Factors and their values.
Scale Factor Value
PREC 3.72
FLEX 2.03
RESL 2.83
TEAM 1.10
PMAT 4.68
[image:11.612.48.540.196.393.2]New PMAT 3.81
Table 6. The actual time, effort, size, and the cost driver‟s multiplication.
Description Value
Actual Time 16.4
Actual Effort 127.66
Size (KSLOC) = 95
П Cost Drivers, EM = 0.448 Table 7. Estimated Effort and schedule by
generic COCOMO II model.
Description Value
∑Scale Factors, SF = 14.36 Estimated Effort, PM = 166.98 Magnitude Relative Error (Effort)= 0.31
Estimated Schedule 18.08 Magnitude Relative Error (Schedule)= 0.10
0 1 2 3 4 5 6 7 8 9
Very Low Low Nominal High Very High
P M A T V a lu e s
COCOMO II's PMAT vs. ISF-PMAT Values
[image:11.612.110.500.487.785.2]The black dotted line in Fig. 1 shows the current PMAT scale factor values used in COCOMO II. The gray line shows the new PMAT values derived from the ISF-PMAT analysis using our forty datasets. The VERY LOW ratings for PMAT decreased slightly from 7.80 to 7.55, while the LOW ratings decreased from 6.24 to 5.71. Since VERY LOW and Low rating levels in COCOMO II‟s PMAT are categorized under CMMI Level 1, i.e. few number of process areas (PA) are assigned to this level, and success still depends on individual effort. Therefore, Level 1 companies still need much effort to accomplish their projects, particularly for CMMI Level 1 (lower half) companies that rely on “heroes” to do the jobs and do not show any compliance that would satisfy subsequent levels. Another observation is that NOMINAL and HIGH rating levels (CMMI Level 2 and Level 3) demonstrate a relatively obvious reduction in PMAT values, which appears as a deviation in the gray line in Fig. 1.
In Fig. 2, X axis represents the 8 projects used in CMMI Level 3 organization in our study, whereas Y axis represents the Scheduling months. Each project (in X axis) has three columns: the left one (Black column) represents the actual schedule, the middle one (White gray column) represents the generic COCOMO II schedule estimation, and the right one (Dark gray column) represents the schedule estimation for the proposed COCOMO II model with new ISF-PMAT values. The figure demonstrates how the proposed model (with ISF-PMAT) has succeeded to give an estimated schedule which is closer to the actual schedule than generic COCOMO II estimations. This case is not absolute, i.e. in some little cases like in CMMI Level 1 (Lower and Upper) and Level 2 datasets, the estimated schedule by the generic COCOMO II were relatively closer to the actual schedule than the proposed model‟s estimation. The reason is due to some data anomalies, especially for low levels companies that do not have reliable and precise documentations for their historical projects.
As shown in Fig. 2, there are slight consistent overestimations for most of the projects. According to [36], a software estimation model can still be consistent if it provides uniform misestimating (i.e. underestimating or overestimating) for a set of projects. Since the proposed model presented here is uniformly overestimated the schedule for most of the 8 projects, so it could still be a consistent model.
Fig. 2. Actual and estimated schedule in both Generic COCOMO II and COCOMO II with ISF-PMAT.
0.00 5.00 10.00 15.00 20.00 25.00
1 2
3 4
5
6 7
8
Sc
h
e
d
u
le
Projects
Actual V.S. Estimated Schedule (CMMI-Level 3)
[image:13.612.141.455.107.315.2]5.1 Model Accuracy with ISF Results
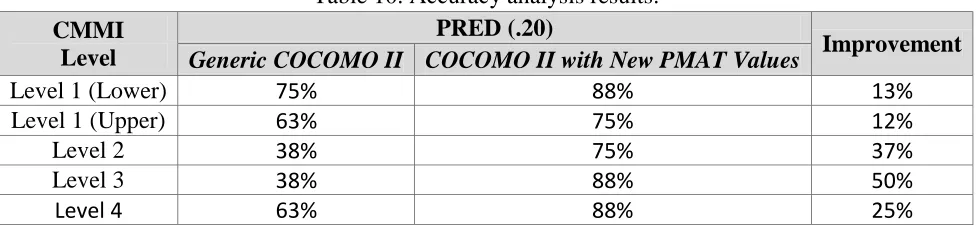
[image:14.612.63.552.150.263.2]After applying the derived ISF-PMAT values back to our forty datasets, improvement in the model‟s accuracy has been realized. This improvement is shown in Table 10.
Table 10. Accuracy analysis results.
CMMI Level
PRED (.20)
Improvement Generic COCOMO II COCOMO II with New PMAT Values
Level 1 (Lower) 75% 88% 13%
Level 1 (Upper) 63% 75% 12%
Level 2 38% 75% 37%
Level 3 38% 88% 50%
Level 4 63% 88% 25%
Table 10 shows that by applying the ISF-PMAT values into our forty datasets that had been collected from CMMI organizations, the accuracy level - PRED (.20) - in all maturity levels increased by 13%, 12%, 37%, 50%, and 25% respectively. As we mentioned and justified earlier, Table 10 shows that Level 3 has the highest percentage of improvement, and the lowest percentage of improvement assigned to Level 1 with its extensions, Lower and Upper halves.
6.0 CONCLUSION AND FUTURE WORKS
Accurate software development cost estimation is very important in the budgeting, project planning and effective control of project management. Different software cost estimation models have different inputs. One of the most important inputs to software cost estimation models (including COCOMO) is Process Maturity (PMAT). This study shows that the current values for the COCOMO II PMAT scale factor do not adequately reflect the impact of CMMI-based process maturity on the development schedule. Therefore, by using the Ideal Scale Factor method (ISF) and with the aid of our forty datasets, we have derived new PMAT values that better reflect the impact of CMMI-based process maturity on software development schedule. The new values resulted in an improvement on COCOMO II model accuracies in terms of PRED (.20) by 13% for CMMI Level one (Lower half), 12% for CMMI Level one (Upper half), 37% for CMMI Level two, 50% for CMMI Level three, and 38% for CMMI Level four organizations.
REFERENCES
[1] T. K. Abdel-Hamid and S. E. Madnick, “Impact of schedule estimation on software project behavior”, IEEE Software, 1986, pp. 70-75.
[2] Y. Miyazaki and K. Mori, "COCOMO Evaluation and Tailoring," Proceedings, ICSE 8, IEEE-ACM-BCS, 1985 pp. 292-299.
[3]
R. Dillibabu, K. Krishnaiah, “Cost estimation of a software product using COCOMO II.2000 model – a case study,” International Journal of Project Management, vol. 23, 2005, pp. 297-307.
[4] B. Boehm, Software Engineering Economics, Prentice Hall, 1981.
[5]
B. Boehm, E. Horowitz, R. Madachy, D. Reifer, B. KClark, B. Steece, A. Winsor Brown, S. Chulani, and C. Abts, “Software Cost Estimation with COCOMO II”, Prentice Hall, 2000.
[6]
H. Al-Sakran H., “Software Cost Estimation Model Based on Integration of Multi-agent and Case-Based Reasoning,” Journal of Computer Science, vol. 2, no. 3, 2006 pp. 276-282.
[7] H. Leung, F. Zhang, In Handbook of Software Engineering and Knowledge Engineering, vol. 2, World Scientific. 2002.
[8]
B. Boehm, , B. Clark, E. Horowitz, C. Westland, R. Madachy, R. Selby, "Cost Models for Future Software Life Cycle Processes: COCOMO 2.0," Annals of Software Engineering Special Volume on Software Process and Product Measurement, Amsterdam, vol. 1, 1995, pp. 45-60.
[9]
P. Musilek, W. Pedrycz, N. Sun, G. Succi, “On the sensitivity of COCOMO II software cost estimation model,” Proceedings of the Eighth IEEE Symposium on Software Metrics, METRICS. IEEE Computer Society, Washington, DC, 13, 2002.
[10] B. Clark, "Quantifying the Effects of Process Improvement on Effort," IEEE Software, vol. 17, no. 6, 2000, pp.65-70.
[11] M. Paulk, C. Weber, B. Curtis, and M. chrissis, The Capability Maturity Model: Guidelines for Improving the Software Process, ddison-Wesley, Reading, Mass., 1995.
[12]
Capability Maturity Model® Integration (CMMI®) Version 1.2 Overview, Carnegie Mellon University, Software Engineering Institute. Accessed on 02.May.2009 http://www.sei.cmu.edu/cmmi/adoption/pdf/cmmi-overview07.pdf
[13]
S. Chulani, B. Boehm, and B. Steece, "Bayesian Analysis of Empirical Software Engineering Cost Models," IEEE Trans. on Software Engineering, vol. 25, no. 4, 1999, pp. 573–583.
[14] S. Chulani, B. Boehm, and B. Clark, “Calibrating the COCOMO II Post-Architecture Model” Proceeding ICSE98 IEEE, vol. 1, 1998, pp. 477-480.
[15]
B. Clark, "Calibration of COCOMO II.2003," 17th International Forum on COCOMO and Software Cost Modeling,
http://sunset.usc.edu/events/2002/cocomo17/Calibration%20fo%20COCOMO%20I I.2003%20Presentation%20-%20Clark.pdf.
[16]
Y. Yang, B. Clark, "COCOMO II.2003 Calibration Status," CSE Annual Research
Review, March 2003, http://sunset.usc.edu
[17]
Y. Yang, B. Clark, "Reducing Local Calibration Bias in COCOMO II 2004 Calibration," 19th International Forum on COCOMO and Software Cost Modeling, October 26-29,
2004, http://sunset.usc.edu/cse/pub/event/
2004/COCOMO/files/WedAM/Wed_AM_05.ppt
[18] J. Baik, “Disaggregating and Calibrating the Case Tool Variable in COCOMO II,” IEEE Trans. Software Eng., vol. 28, no. 6, 2002, pp. 1009- 1022.
[19]
Z. Chen, T. Menzies, and D. Port, "Feature Subset Selection Can Improve Software Cost Estimation Accuracy," Proc.Workshop Predictor Models in Software Eng., ACM Press, 2005.
[20] J. Hale, A. Parrish, B. Dixon, and R. Smith, "Enhancing the COCOMO Estimation Models," IEEE Software, vol. 17, 2000, pp. 45-50.
[21] J. Randall, "Extreme Software Cost Estimating," The Journal of Defense Software Engineering, vol. 17, No. 1, 2004, pp. 27-30.
[22]
M. Yahya, F. Masoud, and A. Hudaib, "The effect of Software Development Environment on Software Cost Estimation," The Proceedings of the 10th World Multi-Conference on Systematic, Cybernetics and Informatics, 2006, PP. 239-243, USA,
[23]
J. Herbsleb et al., Benefits of CMM-Based Software Process Improvement: Initial Results, Tech. Report CMU/SEI-94- TR-13, Software Eng. Inst., Carnegie Mellon Univ., Pittsburgh, 1994.
[24]
J. Brodman and D. Johnson, “Return on Investment (ROI) from Software Process Improvement as Measured by US Industry,” Software Process Improvement and Practice, John Wiley &Sons Ltd., Sussex, England and Gauthier-Villars, 1995, pp. 35-47.
[25] K. Butler, “The Economic Benefits of Software Process Improvement,” Crosstalk, Hill AFB, Ogden, 1995, pp. 14-17.
[26]
D.E. Harter, M.S. Krishnan, and S.A. Slaughter, “Effects of Process Maturity on Quality, Cycle Time and Effort in Software Product Development,” Management Science, vol. 46, 2000, pp. 451-466.
[27] M. Chrissis, M. Konrad, and S. Shrum, CMMI: guidelines for process integration and product improvement, Addison-Wesley, 2003.
[28]
D. Gibso, D. Goldenson, and K. Kost, “Performance Results of CMMI-Based Process Improvement,” CMU/SEI-94- TR-13, Software Engineering Institute TECHNICAL REPORT CMU/SEI-2006-TR-004 ESC-TR-2006-004.
[29]
D. Goldenson, D. Gibson, “Demonstrating the Impact and Benefits of CMMI: An Update and Preliminary Results,” (CMU/SEI-2003-SR-009). Pittsburgh, PA: Software Engineering Institute, Carnegie Mellon University, 2003.
[30]
Manish A. and Kaushal C., "Software Effort, Quality, and Cycle Time: A Study of CMM Level 5 Projects," IEEE Transactions on Software Engineering, vol. 33, no. 3, pp. 145-156, Mar. 2007
[31] (Diaz and Sligo, 1997) M. Diaz and J. Sligo, “How Software Process Improvement Helped Motorola,” IEEE Software, vol. 14, no. 5, pp. 75-81, Sept.- Oct., 1997.
[32] H. Wohlwend and S. Rosenbaum, “Schlumberger‟s Software Improvement Program,” IEEE Trans. Software Eng., Vol. 20, No. 11, Nov. 1994, pp. 833–839.
[33]
[34] Center for Software Engineering, “COCOMO II Cost Estimation Questionnaire,” Computer Science Department, University of Southern California.
[35] S. Conte, H. Dunsmore, and V. Shen, Software Engineering Metrics and Models, Menlo Park, Calif.: Benjamin/Cummings, 1986.
[36]
M. Mukhopadhyay and S. Kekre, “Software Effort Models for Early Estimation of Process Control Applications” IEEE transactions on software engineering, vol. 18, no. 10, 1992.
BIOGRAPHY
Maged A. Yahya
Maged Yahya is currently a doctoral candidate in the Department of Software Engineering, Faculty of Computer Science & Information Technology at University of Malaya, Malaysia. He received his Bachelor degree in Computer Science from Zarqa Private University in 2002, and Master degree in Computer Science from University of Jordan in 2004, Jordan. His current research interests include software process improvement, Capability Maturity Model Integration (CMMI), and software cost estimation.
Rodina Ahmad
Rodina Ahmad is a senior lecturer in software engineering and information systems at the Faculty of Computer Science and Information Technology, University of Malaya. She teaches information systems and software engineering modules at both the undergraduate and master levels. She holds a degree in Computer Science and Mathematics from Hartford, Conn. Her master degree was from Rensselaer Polytechnic Institute, USA. Her PhD degree in Information Systems is from National University of Malaysia.
Sai Peck Lee