Identification of novel stem cell markers using gap analysis of gene
expression data
Paul M Krzyzanowski
*†
and Miguel A Andrade-Navarro
*†
Addresses: *Molecular Medicine, Ottawa Health Research Institute, 501 Smyth Road, Ottawa, Ontario, K1H 8L6, Canada. †Faculty of Medicine,
University of Ottawa, 451 Smyth Road, Ottawa, Ontario, K1H 8M5, Canada.
Correspondence: Paul M Krzyzanowski. Email: [email protected]
© 2007 Krzyzanowski and Andrade-Navarro.; licensee BioMed Central Ltd.
This is an open access article distributed under the terms of the Creative Commons Attribution License (http://creativecommons.org/licenses/by/2.0), which permits unrestricted use, distribution, and reproduction in any medium, provided the original work is properly cited.
Gap analysis for stem cell markers
<p>A method for the detection of marker genes in large heterogeneous collections of gene expression data is described and applied to DNA microarray data generated from 83 mouse stem cell-related samples.</p>
Abstract
We describe a method for detecting marker genes in large heterogeneous collections of gene expression data. Markers are identified and characterized by the existence of demarcations in their expression values across the whole dataset, which suggest the presence of groupings of samples. We apply this method to DNA microarray data generated from 83 mouse stem cell related samples and describe 426 selected markers associated with differentiation to establish principles of stem cell evolution.
Background
Gene expression microarrays allow thousands of transcripts in a cellular sample to be quantified simultaneously. (For reviews of the technology and applications, see the reports by Heller [1] and Sloughton [2].) Continuing improvements in microarray technology, in terms of transcript density, techni-cal robustness, and cost, have led to widespread usage of arrays in experiments. The size of single studies has grown and can encompass the analysis of up to hundreds of arrays simultaneously [3-5]. This vast explosion of reusable data being generated has resulted in efforts being directed at pro-ducing expression data repositories in which the data are curated and presented in an ordered manner [6-8]. The large number of data points makes such resources an exceptional source of biologic information.
Some common uses of gene expression data are the identifi-cation of co-regulated genes across many samples [9], identi-fication of differentially expressed genes in samples of interest [10], and, more recently, analysis of alternative splic-ing [11-13] and genome-wide surveillance of transcription [14-16]. They can also be used to identify marker genes
asso-ciated with specific sets of samples. As distinguishing fea-tures, such markers can be used as diagnostic tests for disease [17,18] or for the identification and purification of particular cell types [19,20]. The identification of multiple markers for a particular phenotype may also reveal biologic mechanisms by which certain genes act in concert.
A simple method to identify marker gene candidates is to identify genes that are differentially expressed between a set of control samples and samples from a condition of interest. A two-state comparison can be made, and genes associated with each type of sample can be identified and used as mark-ers. Current gene expression databases typically contain data from many types of samples, and this heterogeneity provides the potential for more powerful analyses. One can, for exam-ple, identify transcripts that are specific to a sample (or sam-ples) of interest, or conduct novel comparisons between different combinations of transcription profiles. The increased size of the databases also increases the number of possible two-state comparisons exponentially, which poses a computational problem. Overcoming this problem requires a computational method.
Published: 17 September 2007
Genome Biology 2007, 8:R193 (doi:10.1186/gb-2007-8-9-r193)
Received: 4 May 2007 Accepted: 17 September 2007 The electronic version of this article is the complete one and can be
We have developed a methodology that uses large heteroge-neous gene expression datasets to identify genes that can function as markers. In summary, we examine the distribu-tion of expression values of each probe set to identify gaps. These gaps can be used to partition the database into groups of low-expressing and high-expressing samples, which sug-gest the existence of distinct subpopulations of samples. We then score other probe sets based on their ability to reproduce these database partitions. The characteristics of samples in each database partition identify the context in which genes may act as markers, which aids in the subsequent evaluation of genes in terms of their putative marker roles.
In this study we illustrate our methodology in the analysis of a database of stem-cell related DNA microarray samples that we previously developed (StemBase [7]). In particular, we study 83 mouse stem cell related samples analyzed using the Affymetrix MOE430 genechip set (Affymetrix Inc., Santa Clara, CA, USA), which includes approximately 45,000 probe sets. Unbiased application of the method produces a set of 4,449 cell and tissue markers, including 45 out of 71 known stem cell markers (69%). Analysis of the markers that segre-gate six types of stem cells (hematopoietic, mast, mammos-pheres, osteoblasts, and two embryonic) from their differentiated counterparts suggests 426 high confidence markers, 206 of which are highly expressed in the stem cell and 222 are highly expressed in the differentiated counter-part (two being highly expressed in stem cells in some cases, and in the differentiated counterpart in others). Of those 426 markers, 17 are involved in multiple distinct lineages that include at least one non-embryonic cell type; nine markers are highly expressed in the stem cells, six are highly expressed in the differentiated cells, and two exhibit opposite variation in different stem-derivative cell pairs. Analysis of the
func-tions of the 222 genes that are highly expressed in the differ-entiated cells indicates enrichment of extracellular gene products and enzyme inhibitors (12 genes, five of them serpins).
The set of 426 stem cell markers allows us to focus on gene superfamilies that have undergone repeated gene duplication events for a phylogenetic analysis of the evolution of proteins involved in stem cell function. By sequence similarity analy-sis, we identify four such families (nuclear receptors, cyto-chrome P450, Rab family GTPases, and early B-cell factors) with multiple members in this set. The study of examples from each reveals multiple events of gene duplication along the vertebrate lineage giving rise to genes with a very high degree of sequence similarity, but very different patterns of expression in stem cells. This leads to a hypothesis that many stem cell related genes expressed in particular tissues arose by duplication and specialization of stem cell related genes originally expressed in other tissues. Superfamilies with large rates of duplication in the vertebrate lineage may have func-tions related to the development of an increasingly complex organism, including the generation and control of tissue-spe-cific stem cell pools. All results and data presented here are available and can be queried through a web server [21].
Results
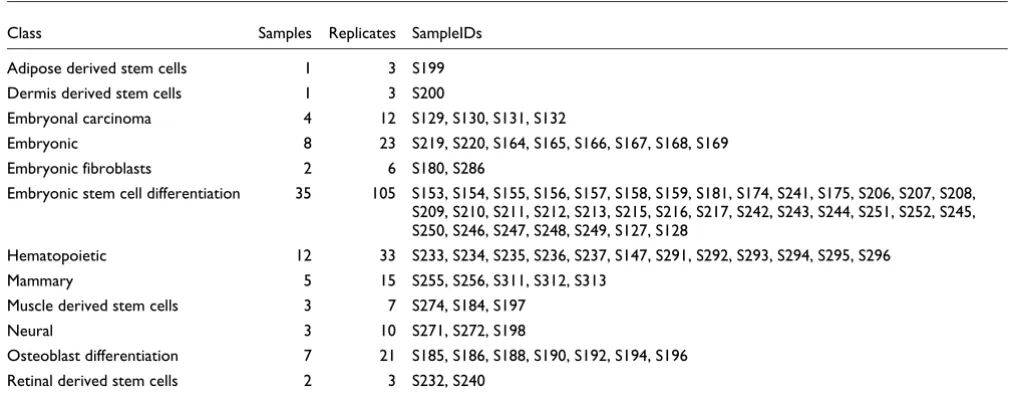
[image:2.612.54.560.528.725.2]We applied our method to a set of DNA microarray data from 83 samples from mouse stem cells and derivatives. Samples included embryonic, hematopoietic, mammosphere, retinal, neurosphere, adipose, and muscle cells (Table 1). All data were obtained using the Affymetrix MOE430 platform (Affymetrix Inc.) and subjected to quality controls as previ-ously described [7].
Table 1
Set of mouse samples selected for our analysis from StemBase
Class Samples Replicates SampleIDs
Adipose derived stem cells 1 3 S199
Dermis derived stem cells 1 3 S200
Embryonal carcinoma 4 12 S129, S130, S131, S132
Embryonic 8 23 S219, S220, S164, S165, S166, S167, S168, S169
Embryonic fibroblasts 2 6 S180, S286
Embryonic stem cell differentiation 35 105 S153, S154, S155, S156, S157, S158, S159, S181, S174, S241, S175, S206, S207, S208, S209, S210, S211, S212, S213, S215, S216, S217, S242, S243, S244, S251, S252, S245, S250, S246, S247, S248, S249, S127, S128
Hematopoietic 12 33 S233, S234, S235, S236, S237, S147, S291, S292, S293, S294, S295, S296
Mammary 5 15 S255, S256, S311, S312, S313
Muscle derived stem cells 3 7 S274, S184, S197
Neural 3 10 S271, S272, S198
Osteoblast differentiation 7 21 S185, S186, S188, S190, S192, S194, S196
Retinal derived stem cells 2 3 S232, S240
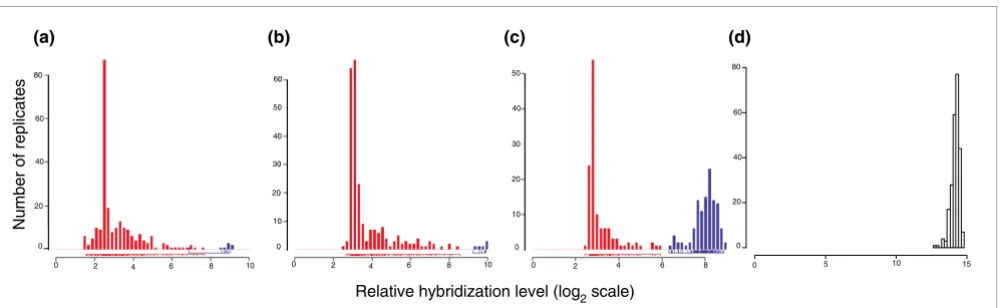
At a U-score cutoff of 0.9 (see Materials and methods, below), our method identified 893 different two-state classifications with which to segregate the 83 sample dataset. Figure 1 shows three exemplar distributions of hybridization values for three probe sets that clearly segregate the dataset and are desirable choices for markers. Interpretation of the segregation pattern becomes obvious from the distribution itself as the group of samples with low gene expression values is separated from the group of samples with high expression values by a gap. Simplicity of interrogation allowed us to create a web tool (accessible on the internet [21]) to query these classifications so that users can determine whether a given gene is a marker, and find which samples it represents. Also, the tool allows us to find the markers separating two sets of samples of choice.
Properties of the set of potential markers
Classifications contained varying numbers of probe sets. Fig-ure 2a shows that patterns with small numbers of markers are more numerous. The 893 classifications also separated differ-ent numbers of samples into groups. Most patterns assigned small numbers of samples to 'upregulated' groups (for exam-ple, the gene was highly expressed in three samples versus 80). Over 80% of the patterns separate ten or fewer samples from the remainder of the database as a highly expressed group (Figure 2b). The complete set of putative markers asso-ciated with the 893 patterns includes 10,401 probe sets, or approximately 25% of the probes on the microarray, which is intuitively quite a large fraction.
We expected that patterns defined by smaller numbers of marker genes would be more likely to include genes impor-tant for stem cell related functions. To investigate this, we examined the distribution of known stem cell markers in this set and whether the method was able to select them preferen-tially within small clusters.
Known stem cell markers in dataset
We investigated whether known stem cell markers were iden-tified in our dataset in order to understand the properties and usefulness of the selected patterns within the context of stem cell research.
By examining the literature, we selected 88 marker genes that represented the variety of stem cell types in our dataset (Table 2). We identified the corresponding entries in the Entrez Gene database for 72 of the 88 marker genes. In seven of the remaining cases we were unable to identify definitively the correct gene because of ambiguity of the provided gene iden-tifier (for example, 'laminin' could indicate one of several pos-sible genes), and in nine cases the identifier could not be related to any entry in the database (for example, 'neural-stemmin'). Of these 72 Entrez Gene IDs, 71 had at least one associated probe set on the Affymetrix MOE430A/B chip set. Our set of 10,401 'potential marker' probe sets, which con-tains patterns with a maximum of 200 associated probe sets (described under Filtering marker lists by size and number of classified samples, below), contained probe sets for 49 of these 71 marker genes (69%).
[image:3.612.56.557.438.592.2]Distributions of hybridization values for probe sets
Figure 1
Distributions of hybridization values for probe sets. Each histogram depicts the number of replicates (from a total of 241) with a given hybridization value for a given probe set. For illustrative purposes, we display the distribution of hybridization values of three probe sets selected using the gap method as markers corresponding to (a) a known neural stem cell marker (Nestin; probe set 1449022_at), (b) a novel stem cell marker encoding a protein of known function (phospholipase Pla2g7; probe set 1430700_a_at) that we observed to be upregulated in bone marrow mast cell precursors and in undifferentiated mammospheres, and (c) a novel stem cell marker corresponding to an uncharacterized transcript upregulated in undifferentiated V6.5 and J1 murine embryonic stem cells (2410146L05Rik; probe set 1460471_at). Details on these three cases can be obtained through our online webserver [21] by viewing group numbers 73, 497, and 265, respectively. (d) For comparison, we show the distribution for a housekeeping gene (Eef1a1; probe set 1424635_at), a ribosomal translation elongation factor protein, which is always expressed and was not classified as a marker in our analysis. For robustness, the segregation of the samples (indicated by red and blue bars in the three marker distributions for the down and upregulated groups, respectively) is derived by analysis of the global set of patterns (see Materials and methods) and might not correspond perfectly to the distribution observed here. See, for example, a single replicate in the distribution of Nestin, which is left of the gap in the distribution but was (correctly) associated to the upregulated (blue) group.
Relative hybridization level (log2 scale)
Number of replicates
Ex pres si on Le vel s o f 1 424635_at.A
0 10 20 30 40 50
0 20 40 60 80
0 10 20 30 40 50 60
0 20 40 60 80
0 5 10 15
0 2 4 6 8
0 2 4 6 8 10
0 2 4 6 8 10
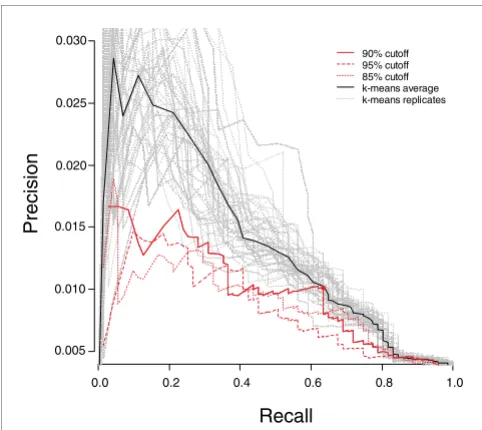
As previously observed, we obtained numerous patterns that segregate small subsets of samples and that are defined by small numbers of genes. To test our hypothesis that these would tend to contain relevant genes (in this case, genes use-ful for characterizing stem cells), we examined the recall and precision of our method for the 71 known markers as the max-imum marker list length was reduced from 200 to 3 (Figure 3). Limiting the list to patterns defined by 63 or fewer mark-ers reduced the total number of probe sets assigned marker roles from 10,401 to 5,848 (44% reduction) while losing only four known stem cell markers, representing a recall rate of 63% (45 out 71; point marked with a circle in Figure 3). This supports our theory that marker genes are more often con-tained in small clusters.
The 705 patterns defined by 63 or fewer markers segregated a mean of nine samples (median 5) in the upregulated group and were associated with a mean of 21 markers (median 15). This set associates 5,848 probe sets (4,449 genes) with at least one pattern, accounting for approximately 13% of the probe sets on the MOE430 microarray platform. We propose that many of those can be developed into useful markers. We define this as 'selected marker' set.
We compared the performance of our method with a popular method for analysis of gene expression data, namely k-means, which is a standard clustering algorithm (see Materi-als and methods, below). Both methods performed similarly in producing groups of genes that are expected to be enriched for stem cell markers (Figure 3). However, our method differs from a clustering algorithm in that we identify markers that segregate sets of samples whereas clustering algorithms group markers with similar expression patterns. Accordingly, the groups of associated markers produced by the gap method
were somewhat different from the clusters obtained using k-means (mean overlap of 69.8%).
Overview of the selected marker set
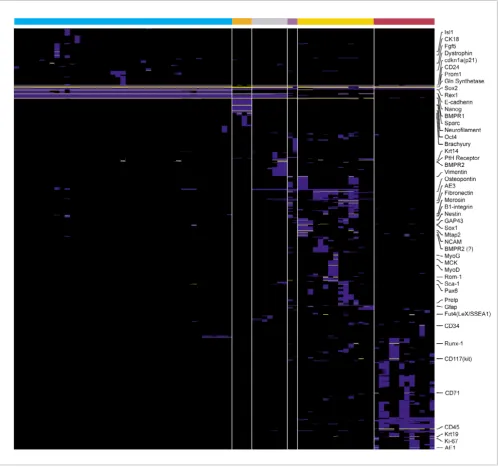
To illustrate the variety of patterns identified, Figure 4 shows the expression patterns of the 49 probe sets that represent previously known stem cell marker genes identified by the algorithm (yellow), together with another 1,252 genes that were assigned a perfect score by the algorithm (blue). All major divisions in the dataset appear clearly defined, with samples related to one of hematopoietic, sphere [22], or embryonic sample types forming major groups. For example, hematopoietic samples define many patterns with probe sets identified uniquely within them.
Gene Ontology statistics of the selected marker set
Since the selection of markers was done without reference to the identity of the samples, we would expect to find not just stem cell markers but also general markers of cell and tissue identity (for example, distinguishing differentiated blood cells from epithelial cells). To investigate in general terms the function of the genes that were selected in the marker set, we collected the 5,848 probe sets defining the 705 selected pat-terns (with 3 to 63 associated probe sets). These corresponded to 4,449 Entrez Gene IDs, for which we deter-mined the over-representation of Gene Ontology (GO) anno-tations. Using the 'potential marker' set of 7,478 genes (which defined groups with up to 200 probe sets) as a reference, we found several significantly enriched functional categories (Table 3).
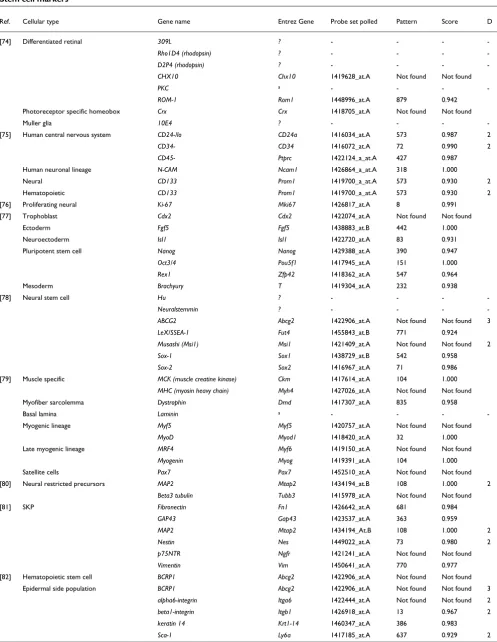
[image:4.612.54.558.87.288.2]Significantly enriched functions (P < 0.001) include those that allow cells to interact and respond to environmental cues ('defense response', 'cell communication', 'signal transducer Properties of the set of 893 patterns
Figure 2
Properties of the set of 893 patterns. (a) Number of patterns with a given number of probe sets associated with a score of 90%. (b) Number of patterns with a given number of samples segregated in the high expression group.
0 20 40 60 80 100 120 140 160
0 10 20 30 40 50 60 70 80
Number of patterns Number of patterns
Probe sets associated Samples in high group
(a)
(b)
20 30 40 50 60
200 150
100 50
0 10
activity', and 'receptor activity'), to interact with the immediate neighborhood of the cell ('extracellular matrix region', 'extracellular matrix', 'membrane', and 'cell adhe-sion'), and functions related to development ('multicellular organismal development' and 'organ development'). Finding these development-related functions is reasonable given that our set of samples is focused on stem cells. The abundance of functions related to the interaction of cells with their environ-ment, on the other hand, may generally reflect that cell iden-tity is largely defined at their surfaces; we would expect to see these functions in the analyses of other collections of gene expression data sampling multiple tissues.
Examination of markers of stem cell differentiation
One distinctive feature of the gap method is that genes are selected based on their ability to define binary groupings of samples. This is meaningful and often desired from the point of view of an experimental researcher. Understanding the sig-nificance of the marker becomes simpler as the pattern itself gives a classification of the sample set.
Likewise, the identified sample partitions allow simple, direct, and intuitive ways to manipulate the gene expression data. We illustrate this here by applying a selection procedure to the set of patterns obtained above to focus on markers that are active in any of several lineages of stem cell differentiation included in our dataset.
Generally, we are interested in the properties of probe sets that separate undifferentiated and differentiated sets of stem cells. We chose six pairs of stem cell samples and their differ-entiated derivatives from our dataset (two embryonic stem cell lines, hematopoietic stem cells [HSCs], osteoblasts, mam-mospheres, and mast cell progenitors; Additional data file 3) and selected probe sets that segregated at least one sample pair with high confidence (99% association score); specifi-cally, the probe set exhibited high expression in the undiffer-entiated sample and low expression in the differundiffer-entiated sample, or vice versa. This selection identified 488 probe sets (called the 'stem cell related' set) corresponding to 426 genes, of which 206 exhibited high expression in the undifferenti-ated sample and 222 in the differentiundifferenti-ated counterpart. Two genes showed high expression in the undifferentiated sample for some cell types, and in the differentiated sample in others:
Ugt1a2 detected by probe set 1426260_a_at, and a gene encoding a hypothetical coiled-coil domain-containing pro-tein detected by probe set 1444761_at. This set of 426 genes included five out of the 71 known stem cell markers used for benchmarking (Krt1-14, Mtap2, Ncam1, Spp1, and Vim).
Examination of the GO terms of the set resulted in a very short list of significant functions (P < 0.01). Separate analyses of genes upregulated in undifferentiated and differentiated states failed to identify GO terms over-represented in the genes that were highly expressed in stem cells. The only rele-vant terms for the genes expressed in the differentiated genes
(Table 3) were related to the extracellular environment ('extracellular region' and 'extracellular matrix'), but with less statistical significance than those for the selected list of 4,449 cell markers. It is known that stem cells often rely on the maintenance of a stable microenvironment (the niche) for physical support and extrinsic cues (for a review, see Li and Xie [23]). The GO term 'enzyme inhibitor activity', not rele-vant for the larger marker set, appeared as relerele-vant (P = 0.001) for a set of 12 genes, five of which belonged to the fam-ily of serpins (SERine Protease INhibitors; serpins a1b, a3n, b9, g1, and h1).
Serpins are a large class of proteins that are found in all mul-ticellular eukaryotes and predominantly function as serine protease inhibitors, but they can also function as caspase and cysteine protease inhibitors and, in rare cases, as hormone transporters, chaperones, or tumor suppressors. In contrast to eukaryotes, prokaryotic serpins are rare and most serpin-containing prokaryotes have only a single serpin gene [24]. In agreement with our findings, variation in serpin gene expres-sion was recently observed during differentiation in the myeloid lineage [25,26]. Here we give some insight into the functions of the six serpins we identified in our study.
Serpinb9 is an estrogen-inducible caspase inhibitor that can inhibit granzyme B-mediated apoptosis, a key mechanism by which cytolytic lymphocytes are able to destroy target cells. It is expressed at high levels in testis and placenta, and may con-tribute to the ability of immune-privileged cells to evade destruction [27]. Recently, it was shown that serpinb9 plays a role in allowing embryonic stem cells (ESCs) to evade a simi-lar fate [28]. Serpins a3n and a3g have been shown to be strongly influenced by LIM-homeobox 2 expression in a hematopoietic system [29].
Serpina3g was previously reported to be highly enriched in HSCs, in concordance with our observations [30]. Similar in function to serpinb9, serpina3n has been implicated in pro-viding protection from granzyme B mediated cell death in a study of Sertoli cell secreted factors [31]. Interestingly, Serpinh1 is one of the exceptions of the serpin family; it is a chaperone molecule that plays a role in the maturation of pro-collagen [32]. With relevance to stem cell biology, Serpinh1 knockout ESCs produce embryoid bodies with aberrant mor-phology [33]. In summary, the abundance of serpins as mark-ers might reflect generalized mechanisms of immune system avoidance that are activated in cells undergoing differentiation.
Table 2
Stem cell markers
Ref. Cellular type Gene name Entrez Gene Probe set polled Pattern Score D
[74] Differentiated retinal 309L ? - - -
-Rho1D4 (rhodopsin) ? - - -
-D2P4 (rhodopsin) ? - - -
-CHX10 Chx10 1419628_at.A Not found Not found
PKC a - - -
-ROM-1 Rom1 1448996_at.A 879 0.942
Photoreceptor specific homeobox Crx Crx 1418705_at.A Not found Not found
Muller glia 10E4 ? - - -
-[75] Human central nervous system CD24-/lo CD24a 1416034_at.A 573 0.987 2
CD34- CD34 1416072_at.A 72 0.990 2
CD45- Ptprc 1422124_a_at.A 427 0.987
Human neuronal lineage N-CAM Ncam1 1426864_a_at.A 318 1.000
Neural CD133 Prom1 1419700_a_at.A 573 0.930 2
Hematopoietic CD133 Prom1 1419700_a_at.A 573 0.930 2
[76] Proliferating neural Ki-67 Mki67 1426817_at.A 8 0.991
[77] Trophoblast Cdx2 Cdx2 1422074_at.A Not found Not found
Ectoderm Fgf5 Fgf5 1438883_at.B 442 1.000
Neuroectoderm Isl1 Isl1 1422720_at.A 83 0.931
Pluripotent stem cell Nanog Nanog 1429388_at.A 390 0.947
Oct3/4 Pou5f1 1417945_at.A 151 1.000
Rex1 Zfp42 1418362_at.A 547 0.964
Mesoderm Brachyury T 1419304_at.A 232 0.938
[78] Neural stem cell Hu ? - - -
-Neuralstemmin ? - - -
-ABCG2 Abcg2 1422906_at.A Not found Not found 3
LeX/SSEA-1 Fut4 1455843_at.B 771 0.924
Musashi (Msi1) Msi1 1421409_at.A Not found Not found 2
Sox-1 Sox1 1438729_at.B 542 0.958
Sox-2 Sox2 1416967_at.A 71 0.986
[79] Muscle specific MCK (muscle creatine kinase) Ckm 1417614_at.A 104 1.000
MHC (myosin heavy chain) Myh4 1427026_at.A Not found Not found
Myofiber sarcolemma Dystrophin Dmd 1417307_at.A 835 0.958
Basal lamina Laminin a - - -
-Myogenic lineage Myf5 Myf5 1420757_at.A Not found Not found
MyoD Myod1 1418420_at.A 32 1.000
Late myogenic lineage MRF4 Myf6 1419150_at.A Not found Not found
Myogenin Myog 1419391_at.A 104 1.000
Satellite cells Pax7 Pax7 1452510_at.A Not found Not found
[80] Neural restricted precursors MAP2 Mtap2 1434194_at.B 108 1.000 2
Beta3 tubulin Tubb3 1415978_at.A Not found Not found [81] SKP Fibronectin Fn1 1426642_at.A 681 0.984
GAP43 Gap43 1423537_at.A 363 0.959
MAP2 Mtap2 1434194_At.B 108 1.000 2
Nestin Nes 1449022_at.A 73 0.980 2
p75NTR Ngfr 1421241_at.A Not found Not found
Vimentin Vim 1450641_at.A 770 0.977
[82] Hematopoietic stem cell BCRP1 Abcg2 1422906_at.A Not found Not found
Epidermal side population BCRP1 Abcg2 1422906_at.A Not found Not found 3
alpha6-integrin Itga6 1422444_at.A Not found Not found 2
beta1-integrin Itgb1 1426918_at.A 13 0.967 2
keratin 14 Krt1-14 1460347_at.A 386 0.983
CD34- CD34 1416072_at.A 72 0.990 2
E-cadherin Cdh1 1448261_at.A 48 0.993
Keratin 19 Krt1-19 1417156_at.A 268 0.989 2
CD71- Tfrc 1452661_at.A 845 0.958
[83] Muller glia; retinal Gln synthetase Glul 1426235_a_at.A 573 0.901
Retinal syntaxin a - - -
-Pax6 Pax6 1419271_at.A 374 0.960
rhodopsin Rho 1425171_at.A Not found
[84] Neural (NeuN) Neuron specific protein ? - - -
-Neuron-specific enolase Eno2 1418829_a_at.A Not found Not found
-Osteoblasts Alkaline phosphatase Akp2 1423611_at.A Not found Not found
-BMP2 Bmp2 1423635_at.A Not found Not found
-BMP4 Bmp4 1422912_at.A Not found Not found
-BMP Receptor 1 Bmpr1a 1425492_at.A 581 0.939
Bmpr1b 1437312_at.B 446 0.917
BMP Receptor 2 Bmpr2 1434310_at.B 602 0.954
PTH receptor Pthr2 1452129_at.A Not found
Type 1 collagen a - - -
-bone sialoprotein Ibsp 1417484_at.A Not found
PTH receptor Pthr1 1417092_at.A 368 0.964
RunX-1 Runx1 1422865_at.A 295 0.982
osteonectin Sparc 1448392_at.A 581 1.000
osteopontin spp1 1449254_at.A 737 0.996
General stem cell factor receptor CD117 Kit 1459588_at.B 243 0.912
Muscle merosin Lama2 1426285_at.A 799 0.986
Cartilage related extracellular matrix aggrecan Agc1 1449827_at.A Not found Not found
-collagen II a - - -
-collagen IV a - - -
-PRELP Prelp 1416322_at.A 231 0.958
Adipose derived stem cell CD49d+ Itga4 1421194_at.A Not found Not found
-CD106- ? - - -
-[85] Mammary stem cell Bmi-1 Bmi1 Not on array - -
-p21 Cdkn1a 1424638_at.A 400 0.967
CD49f Itga6 1422444_at.A Not found Not found 2
Cytokeratin 19 Krt1-19 1417156_at.A 268 0.989 2
Sca-1 Ly6a 1417185_at.A 637 0.930 2
Musashi (Msi1) Msi1 1421409_at.A Not found Not found 2
Cytokeratin 5/6 ? - - -
-[86] Neural enrichment CD24 CD24a 1416034_at.A 573 0.990 2
Skin CD29 Itgb1 1426918_at.A 13 0.970 2
[87] Neural GFAP Gfap 1426508_at.A 249 0.924
Neurofilament Nefl 1426255_at.A 151 0.935
Nestin Nes 1449022_at.A 73 0.980 2
Photoreceptors Recoverin Rcvrn 1450215_at.A Not found Not found
-Epithelial lineage Cytokeratin (904-clone 34betaB4?) a - - -
-CK18 Krt1-18 1448169_at.A 83 0.917
AE1 Slc4a1 1416464_at.A 41 1.000
[88] Epithelial lineage AE3 Slc4a3 1418485_at.A 391 0.931
Note that some markers may be included in multiple rows of the table (as many as indicated in the right-most column), because a number of genes have been identified as markers of more than one cell type (for example, Abcg2 for hematopoietic and neural cells [78,82], or Nestin for neural and skin-derived precursors [SKPs] [81,87]). Some of the markers could not be assigned to an Entrez gene either because the marker name was ambiguous (indicated by 'a') or was absent from the database of gene names
[image:7.612.59.550.111.683.2](indicated by '?'). Patterns can be examined online via the web server [21]. All patterns for which a polled probe set is a marker can also be examined at the web server. Note that the chip containing the probe set is indicated by '.A' or '.B' appended to the identifier, because some probe sets are included in both the MOE430A and the MOE430B chips.
Table 2 (Continued)
expressed in both (Additional data file 3). This indicates not only that a single gene can be involved in multiple stem cell differentiation lineages but also that if it does then it will most often act in a similar way across those lineages.
This set allowed us also to study stem cell evolution. We were interested in determining whether there would be a relation between sequence similarity and involvement in stem cell function and involvement in one or many lineages. Large gene families with frequent duplication and reuse are valua-ble in these investigations because the members will have var-ying degrees of sequence similarity. Our set of stem cell markers provides a starting point to search for these families. To identify superfamilies within our set of stem cell markers, we performed an exhaustive pairwise sequence comparison of the protein sequences of the 426 stem cell markers (see Materials and methods, below, and Additional data file 3). Manual examination of the results to select full length simi-larity identified four superfamilies containing three or more members: serpins (cluster #18 in Additional data file 3), the nuclear receptor family (cluster #4), the cytochrome P450 family (cluster #17), and the Rab family GTPases (cluster #10). As serpins are described above, we opted to investigate further members from the additional families within the con-text of gene evolution in relation to stem cell function and expression pattern (Figure 5).
Nuclear receptors: Nr2f2
The proteins of the family of nuclear steroid and hormone receptors are dimerizing transcription factors characterized by a DNA binding domain and a carboxyl-terminal hormone binding domain; they are implicated in cell proliferation, dif-ferentiation, and apoptosis [34]. Three members of this family were identified in the set of 426 stem cell markers (Nr2f2, Essrb, and Rora). We examined Nr2f2 in greater detail.
Nuclear receptor subfamily 2, group F (Nr2f)2/COUP-TF2 represses Notch signaling activity in determination of vein identity [35], but it is also expressed in multiple tissues and organs of the embryo and is required for early outgrowth of limb buds [36]. In our set of samples, probe set 1416159_at, which detects this gene's transcript, segregates the V6.5 dif-ferentiated murine embryonic stem cell (mESC) sample from the rest (Figure 6). The 80% identical Nr2f1/COUP-TF1 (detected by probe set 1418157_at) segregates the samples of retinal spheres, neurospheres, and 10 T1/2 embryonic fibrob-lasts, but not any of V6.5 or other mESC samples, differenti-ated or not. By contrast, the probe sets for another close paralog Nr2f6/COUP-TF3 (1460647_a_at and 1460648_at) were not identified as markers.
The genes nr2f1 and nr2f2 share a common ancestral gene that is represented in the fly. The Drosophila homolog of
nr2f1 and nr2f2, svp (seven up), regulates stem cell identity of neuroblasts in order to control the identity of differentiated progeny cells [37]. In this case, there is a conservation of involvement in stem cell function from the divergence between Protostomia and Deuterostomia. Phylogenetic analysis (Figure 5) indicates that the gene is conserved as a single copy, possibly until divergence of Gnathostomata. All Teleostei appear to have the duplicated version of the gene. However, the patterns of gene expression in stem cells are very different (Figure 6), indicating the specialization of the duplicated copies of the gene.
Cytochrome P450 family: Cyp1b1
Cytochrome P450 proteins (CYPs) are a family of enzymes that are present in bacteria and Eukarya that participate in the metabolism of exogenous or endogenous chemicals [38,39]. Four members of this gene family were identified in the set of 426 stem cell markers (Cyp1b1, Cyp24a1, Cyp4f18, and Cyp7b1). All four were highly expressed in various differ-entiated cells and expressed at a low level in their undifferen-tiated counterparts. We conducted a detailed analysis of
Cyp1b1.
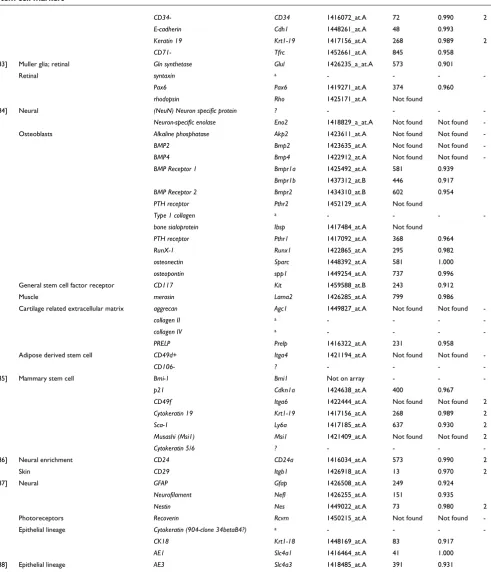
[image:8.612.57.298.85.300.2]Phylogenetic analysis of Cyp1b1 (Figure 5) suggests the exist-ence of two very close paralogs: Cyp1a1 and Cyp1a2. No equiv-alent sequence in the Drosophila genome (or in any other Protostomia) was identified, but the Echinodermata Strong-ylocentrotus purpuratus (purple sea urchin) appears to have an ancestral Cyp1a/b gene (with four copies, possibly Precision/Recall curves for genes selected by the gap method and k-means
Figure 3
Precision/Recall curves for genes selected by the gap method and k-means. Precision/recall curves in red are associated with the gap method, and the point marked with a circle denotes the precision/recall associated with patterns associated with 63 probe sets or less. Gray curves show precision/recall for all replicates of k-means clustering, and the average expected precision/recall curve is shown in black. Recall values are based on the 71 stem cell markers defined in Table 2, whereas precision is the fraction of marker genes identified in the total number of predicted marker genes.
Precision
0.0 0.2 0.4 0.6 0.8 1.0
90% cutoff 95% cutoff 85% cutoff k-means average k-means replicates
0.005 0.010 0.015 0.020 0.025 0.030
duplicated after its divergence from Chordates). The ances-tral gene appears to have duplicated before divergence of Actinopterygii from Sarcopterygii into the 1a and 1b forms, and the subsequent duplication of the 1a form appears to be absent in Sauropsida (for example, chicken) but present in all mammals (for example, opossum). In birds Cyp1a seems to have undergone a separate duplication after divergence from mammals.
In our set, Cyp1b1 segregates differentiated osteoblast cells and differentiated mammospheres from the rest of the data-set. Cyp1b1 metabolically activates estradiol (to produce 4-hydroxy estrogens), which are able to induce estrogen recep-tors, and mutation of Cyp1b1 may stimulate estrogen-medi-ated carcinogenesis [40]. It has also been suggested that Cyp1b1 is involved in axis control during embryonic develop-ment [41].
[image:9.612.57.555.87.558.2]Heatmap indicating the distribution of patterns for markers
Figure 4
By examination of the larger set of markers, we can see that Cyp1a1 is a muscle stem cell marker, but its paralog, Cyp1a2, does not behave as a marker in our dataset. This is supported by the observation that Cyp1a2-/- null mutant mice develop
normally with just some deficiencies in drug metabolism [42]. To the contrary, Cyp1a1 is potentially involved in many cancers and might also have a function in murine embryonic development [43]. CYP1A2 is one of the major CYP1 enzymes that catalyze 2-hydroxylation of estrogen [44], but the sub-strate of CYP1A1 is not yet known.
Cyp1a1 and Cyp1a2 are transcribed from the same bidirec-tional promoter region [45]. Their head-to-head arrangement is conserved in mammalian genomes, which suggests that the genomic organization of these genes is of functional signifi-cance. The fact that these two genes have different behavior as stem cell markers indicates that there are factors uncoupling their expression.
Rab family of GTPases: Rab3d
The Rab family of small GTPases are involved in intracellular cell signaling processes, including tethering and docking of vesicles to their target compartment, vesicle budding, and interaction of vesicles with cytoskeletal elements [46]. According to SMART (Simple Modular Architecture Research Tool; 4 April 2007), there are 66 mouse Rab proteins (defined as containing a Rab domain and no other annotated domain). We identified three members of this family in the set of 426 stem cell markers (Rab3d, Rab31, and Rab38). RhoJ was detected by sequence similarity but discarded after manual examination because it belongs to a different family. We per-formed a detailed analysis of Rab3d. In our set of markers
Rab3d expression segregates mast cell precursors. None of its paralogs, Rab3a, Rab3b, and Rab3c, was identified as a marker by our methodology.
The ancestral Drosophila gene, Rab3, is expressed in the nervous system [47]. Echinodermata Strongylocentrotus purpuratus has only this ancestral gene (Figure 5), but all Teleostei have four copies of the gene, suggesting duplication after the divergence of Chordata and Echinodermata.
In agreement with Rab3 expression patterns in the fly, the four Rab3 paralogs are expressed in mouse brain, where they regulate vesicular release; genetic deletion of individual par-alogs does not affect viability or fertility in mice, but knockout of all four genes results in early perinatal mortality [48]. However, these genes are expressed elsewhere. For example,
Rab3a is detected in acrosomal membranes of mouse sperm [49]. Rab3d is expressed in the exocrine pancreas and the parotid gland, where it is involved in secretory granule matu-ration [50]. Finally, Rab3b and Rab3d are expressed in mast cells [51], which explains our observation that Rab3d segre-gates mast cell precursors.
Early B-cell factors: Ebf2 and Ebf3
[image:10.612.56.562.117.307.2]In each of the four superfamilies analyzed above (serpins, nuclear receptors, cytochrome P450, and Rab GTPases), we note that most members exhibited the same gene expression behavior along differentiation (being highly expressed in either stem cells or in their differentiated counterparts). However, this is not the general case. If we consider all 49 clusters of protein sequences (Additional data file 3), about half (26 of 49 [53%]) have some family members that are
Table 3
Gene Ontology terms of marker sets
All Selected set High in differentiated GO GOID
N1 N2 P2 N3 P3
7,478 4,449 222 Total
976 727 2.85 × 10⁻²² 81 1.60 × 10⁻¹⁶ Extracellular region GO:0005576
169 131 0.001824 17 0.009344 Extracellular matrix GO:0031012
72 57 >1 12 0.00106 Enzyme inhibitor activity GO:0004857
2,061 1,390 8.07 × 10⁻¹⁵ 73 >1 Membrane GO:0016020
865 618 2.44 × 10⁻¹¹ 25 >1 Signal transducer activity GO:0004871
587 421 4.00 × 10⁻⁷ 15 >1 Receptor activity GO:0004872
925 637 8.62 × 10⁻⁷ 43 >1 Multicellular organismal development GO:0007275
312 235 6.34 × 10⁻⁶ 16 >1 Defense response GO:0006952
911 614 0.000403 32 >1 Cell communication GO:0007154
270 201 0.000485 17 >1 Cell adhesion GO:0007155
436 310 0.000596 18 >1 Organ development GO:0048513
highly expressed in stem cells and others that are highly expressed in the differentiated counterparts; the remaining 23 are highly expressed in stem cells (10) or are highly expressed in differentiated cells (13). An example of the former is given by the two early B-cell factors Ebf2 and Ebf3, which we study here in detail.
The four mouse members of the Ebf family of helix-loop-helix transcription factors have non-redundant adipogenic poten-tial in multiple cellular models [52]. Interestingly, both Ebf2
and Ebf3 are detected in our set, but with opposite effects.
Ebf2 is upregulated in mammospheres and Ebf3 in differen-tiated mammospheres. The other two mouse members of this family, namely Ebf1 and Ebf4, are detected in the selected marker set. Ebf1 (probe set 1416301_a_at) is identified as segregating several bone marrow samples. Ebf4 (probe set
1435044_at) is identified as segregating differentiated V6.5 mESCs [53]. This family constitutes an example of genes aris-ing by duplication of an ancestral gene (represented in Dro-sophila by the Collier/knot transcription factor, which is involved in Hedgehog patterning [54] and control of hematopoiesis [55]), with multiple and varied stem cell related functions arising as the gene duplicates.
Discussion
[image:11.612.56.554.86.421.2]We have developed an unsupervised approach to identifying coordinately acting biomarkers using heterogeneous micro-array data, which can be generalized to any set of gene expres-sion data regardless of the platform on which they were generated. This method is a ground-up approach that first determines the extent of the information available in a set of array data through a discretization step to classify samples Phylogenetic distribution of stem cell markers and their close paralogs in four protein families
Figure 5
Phylogenetic distribution of stem cell markers and their close paralogs in four protein families. Major taxa along the Coelomata lineage are depicted in bold black text with deduced numbers of genes from these families in parentheses. Phylogenetic relations between species were taken from the National Center for Biotechnology Information's Taxonomy Browser, except for the relation between Cephalocordata and Urochordata, which was taken from Vienne and Pontarotti [72]. Species names are given in italic black text. Colored text indicates paralogs for four families: red for cyp1, orange for ebf, blue for nr2f1, and green for rab3. Numbers in parentheses indicate multiple copies of gene (for example, in Actinopterygii genes). Many genes are duplicated in Actinopterygii because of a whole-genome duplication event postulated to have occurred along the ray-finned fish lineage [73]. Most expansion of these four families occurs after divergence of Deuterostomia and before divergence of Teleostei. Underlined genes for mouse indicate genes identified in the selected marker set. The database identifiers of the sequences are given in Additional data file 4. The inset on the lower right corner shows schematic phylogenetic trees for the murine members of the four families. All branches shown had bootstrap values above 0.5. Outlier sequences used for each family (not displayed): D. melanogaster rab3 for rab3, S. purpuratus cytp1 for cytp1, D. melanogaster svp for nrf2f1, and D. melanogaster knot for ebf.
Coelomata (3) De utero stom ia (4) P ro to s to m ia Drosophila Metath eria(13 ) Mo u se/h um a n / co w/d o g Eu the ria Opossum Mamma
lia (12)
Sa uro ps ida Ga llus Amnio
ta (11)
Xe no pu s A mp hib ia Sarcop
terygii (
11) Da nio /Tetraodon Ac tin o pte ryg ii Ch ord ata Ec h ino de rm ata Str on gy loc en tr otu s Cran iata Uro c ho rda ta Cio na Hy p ero art ia P etr om iz on G nath osto m ata Ch on dri ch thy es Te leo ste
i (11)
S cy lio rhin u s Ce ph alo ch ord ata Bra n ch ios to ma rab3b rab3a rab3c rab3d nr2f1 nr2f2 ebf1 ebf3 ebf4 ebf2 cyp1a1 cyp1a2 cyp1b1 nr2f1, nr2f2 nr2f1, nr2f2 nr2f1, nr2f2 nr2f1, nr2f2 nr2f1, nr2f2 COUP COUP svp rab3a, rab3b, rab3c, rab3d rab3a, rab3b, rab3c, rab3d rab3b, rab3c rab3b, rab3c rab3a (2), rab3b,
rab3c?, rab3d (2) ?
rab3 rab3
ebf1, ebf2, ebf3, ebf4 ebf1, ebf2, ebf3
ebf1, ebf2, ebf3 ebf2,
ebf3 ebf1 (2),
and initialize patterns. Genes are then associated with pat-terns based on the presence of a clear demarcation threshold in their expression values, which can reproduce the classifica-tion of samples. These genes can therefore act as markers for the samples segregated in the subset.
Microarray technology has followed a trend toward increased feature density and increased coverage, and is customarily used to address large exploratory questions. Our develop-ment of this method was motivated by the desire to present experimental groups with information that clearly shows which genes differentiate samples of interest within the larger context of many samples in the database (for instance, which genes are upregulated in my samples of interest?), and what other samples are similar to these samples of interest (in which other samples are these genes upregulated?).
By identifying probe sets that exhibit bimodal expression level patterns, we directly cater to researchers wishing to assess the significance of particular genes in conditions of interest through methods such as polymerase chain reaction or northern blotting. The interactive graphical presentation of expression values as distributions is exceptionally effective
for assessing the ease with which a proposed marker gene might be validated, and the samples that it can be used to identify.
[image:12.612.59.560.85.398.2]In the application we present, our approach focuses on probe sets. As genome annotations have changed, probe set annota-tions may be altered, changing the probe set to gene mapping or the annotated gene functions. This is understood to be an intrinsic problem in array design [56], and many probe sets on Affymetrix arrays are of unknown identity or are sparsely annotated. However, these obstacles do not render a probe set useless for the purposes of marker identification, because each probe set has a target sequence that is fixed at the time of array design. This sequence can be used to detect the molecular RNA species that is acting as a marker. Further-more, the obvious inference when using cDNA microarrays is that the associated genes can function as markers at the pro-tein level. Identification of a marker probe set implies the existence of a molecule (mRNA or protein) that can poten-tially be used as a molecular marker to discriminate between cell types. Even if probe set annotations are missing or inaccurate, follow-up experiments can be performed to vali-date or identify the molecules involved and determine Sample segregation for selected markers
Figure 6
whether development of an mRNA or protein molecular marker is feasible.
Our gap method stands apart from existing methods of microarray clustering. Standard clustering algorithms such as hierarchical or k-means clustering have two commonly raised impediments. The first is that both methods group genes based on global similarity of expression patterns. That is a restrictive test, which is not necessarily useful in the search for a marker. Second, and more importantly, both methods assign each gene and condition to a single cluster, which may not always be desirable. Proteins can have multiple functions in different contexts. In general, these clustering methods are best used when trying to identify co-regulation or co-expression of genes in a series of samples that are relatively homogeneous. In contrast, we are striving not to identify strict co-expression of many genes on a global level but, rather, to identify sets of genes with expression level thresholds that demarcate similar sets of samples in a heter-ogeneous microarray dataset. This selection procedure is more appropriate to the selection of markers.
Previously established methods also study gene expression values across sets of samples to identify biomarkers. Our method has some differences from those methods that we believe make it more useful for some applications. The meth-ods from Pepe and coworkers [57], SAM (significance analy-sis of microarrays) [10], and PAM (prediction analyanaly-sis for microarrays) [58] require the investigator to separate the samples into two classes; this might be appropriate for simple situations but it would be cumbersome for a dataset with mul-tiple cell types and conditions, especially if a researcher is exploring novel ways to arrange the data. Our unsupervised classification method is more appropriate for such a case.
Like our method, the method presented by Beattie and Rob-inson [59] can produce patterns in an unsupervised manner. However, the binary patterns are obtained through an analog to digital transformation via a one-dimensional clustering step. We believe that our use of a threshold value to discover binary patterns is more intuitive for experimental biologists, and will simplify the development of following validation studies. As explained above, a clear demarcation of expres-sion level between the two groups influences the deciexpres-sion for follow up more than the overall structure of the data in each state. Ideally, we would like to present candidates that also exhibit large fold changes with high statistical significance. The logic of using a threshold value that is directly related to the relative mRNA concentrations represents a margin of safety for the detection of differential expression, and is com-monly illustrated by the use of a 'twofold rule' in the litera-ture. Put simply, a biologist is more likely to follow up on a candidate marker that has clear separation of expression level, over other candidates that may have better statistical support but would pose a challenge for validation because of a tight range of expression.
Furthermore, the approach of Beattie and Robinson [59] assembles clusters by combining genes that generate identi-cal binary patterns. Our observations indicate that the level of noise in gene expression data must be accounted for and some degree of fuzziness must be allowed in any analysis. Essentially, one stray sample should not ruin the association of two genes across a large number of samples (here, 83). Logically, the possibility that such stray hybridizations are encountered increases with increasing dataset size. One such example is illustrated in Figure 1a. We believe that cluster for-mation by a measure of discrimination that is more resilient to small degrees of overlap in the distributions (caused by experimental error) will yield more fruitful results and that adhering to matches between digital patterns for cluster for-mation may be unnecessarily strict. The original data can be always retrieved and a closer examination can be used to ver-ify whether the classification suggested by each probe set is true. This allows genes to be detected as markers of similar patterns.
To illustrate the usefulness of our methodology in cases in which unsupervised patterns with resilience to noise are needed, we applied the method to a database of 83 samples from a variety of mouse stem cells and derivatives. Our results indicate that this method produced a list of candidate mark-ers (selected marker set) that was fivefold enriched for a set of 71 known stem cell markers; we identified 45 of these while reducing the total number of probe sets under consideration from 45,137 to 5,848.
To verify the performance of our method, we clustered the dataset using k-means, a standard clustering algorithm (see Materials and methods, below), and found the precision and recall values to be similar. The overlap of results with the k-means clusters was appreciable (69.8%). However, our method cannot be considered as simply a duplication of the results of k-means, because our method groups genes by their ability to segregate the database and not by the similarity of their patterns of expression. Another important difference is that our method generates groupings of samples while identi-fying markers - something that k-means lacks. If one were to choose to develop marker genes from the results generated with k-means, a subsequent analysis of the expression profile in each k-means cluster would be required to identify the samples in which the cluster of genes might be more highly expressed. This can be done with a single set of genes but would require an additional automated method to process all k-means clusters if a meta-analysis were desired (such as our identification of genes related to differentiation in multiple cell types). Thus, the gap method presented here provides important additional data that is useful for a variety of subse-quent explorations.
differ-entiation (Table 3). This could be expected because our col-lection of data contains samples from diverse cells and tissues, and cell identity is mostly related to the cell surfaces and to the ways in which cells interact with their environment, including communication with other cells. In addition, because our dataset is enriched for differentiating tissues, a number of major functions related to development appeared in the list.
Although the selected set of markers is somewhat biased toward the objectives of analysis of stem cells, it also includes markers that, for example, distinguish one lineage from another (for instance, adult versus embryonic expressed genes). Our methodology facilitates focusing attention toward markers for samples that one is interested in. Here, we focused a more detailed analysis on markers segregating at least one of a short list of six differentiation lineages from the set of 83 samples. The use of these 83 samples as back-ground increases the likelihood of identifying such specific markers.
A total of 426 genes were identified as stem cell related mark-ers for the six differentiating lineages. Functional analysis revealed fewer statistically over-represented functions than in the selected set of markers. Analysis of the 222 genes seg-regating the differentiated samples (Table 3) revealed that the only over-represented GO annotations also significant for the selected set of markers were the association of genes to the extracellular region and the extracellular matrix. It is known that extracellular interactions are important between stem cells, their progeny, and their immediate environment in the maintenance of the stem cell state, control of stem cell popu-lations, and associated progeny [23]. The one GO annotation over-represented only in this set was enzyme inhibition (for 12 genes). This annotation is represented in the list by five members of the serpin superfamily. A literature search sug-gests that these genes may play a role in suppression of immune system effects against differentiating cells. The absence of other functional enrichments suggests that there may be no specific gene function that endows cells with the property of 'stemness', in the same way that there appears to be no single stemness gene for all stem cells [60].
This set of 426 markers of stem cell differentiation allowed us to make some general observations regarding stem cell func-tion and evolufunc-tion. First, we observe that if a gene is a marker for differentiation in multiple lineages, then it will act the same way in most cases. Of the 17 genes identified as markers in multiple lineages, only two were found to be highly expressed in one differentiated population and in another undifferentiated population.
To examine whether patterns of expression in stem cells were retained for gene homologs, we studied gene families repre-sented in the set of markers. Identification of 49 clusters of related protein sequences indicated that gene expression
behavior was not conserved within those families because more than half of the clusters (26) included genes with con-flicting gene expression segregation properties. However, we also wanted to study how expression patterns in stem cells were conserved with protein sequence identity. For this we looked for the largest families within the set that reflect a large number of gene duplication events and therefore offer multiple levels of sequence identity between their members. We selected four families with two to four true paralogs in the marker set: nuclear receptors, cytochrome P450s, Rab GTPases, and early B-cell factors. These superfamilies share general functional activities, but they have obtained addi-tional funcaddi-tional or tissue specificities through mutation and selection following gene duplication. Phylogenetic analysis of one example from each family (Figure 5) led to the study of the evolution of a total of 13 genes. An ancestral gene existed for each of the four families before divergence of Deuterosto-mia, with three being present in the Protostome D. mela-nogaster (knot, rab3, and svp). The genes svp and knot are involved in stem cell differentiation. The two genes arising from duplication of svp and the four genes arising from dupli-cations of knot are all detected as markers in our selected marker set. Similar observations are made for the gene
Cyp1a/b; this gene underwent two duplications to produce a family of three genes, with two involved in differentiation and identified in our set of markers. We propose that the ancestral versions of this gene (for example, in S. purpuratus) are involved in differentiation. The Rab3 family illustrates a case in which duplication of an ancestral gene (which has synaptic functions in D. melanogaster) produces Rab3d, which plays a role in mast cell development, and Rab3a/Rab3b/Rab3c, which we do not identify as differentiation-related markers. The four murine genes conserve some neural function like that of the ancestral Rab3, but they appear to have obtained other functions and tissues in which they are expressed. Based on the results above we can hypothesize that the dupli-cation of a gene involved in a development related function is likely to result in genes that are also involved in development.
Our second observation is that, in contrast, the range of expression is not necessarily conserved between close para-logs. Ebf2 and Ebf3, for example, are highly expressed in undifferentiated and differentiated mammospheres, respectively. Other cases can be observed in Figure 6. We did not identify redundant markers, that is, paralogous genes with the same segregation properties.
Our third observation is that clusters of genes with stem cell related functions appeared during a window of evolutionary time. Expansion of gene families associated with develop-mental functions is demonstrated by the number of paralogs of each family present in different organisms (Figure 5). Of 13 genes from the four families, three are present in Drosophila
divergence, all 13 genes are present and there are no subse-quent duplications. A substantial portion of gene family expansions was complete by the divergence of Teleostei from Chondrichthyes, which agrees with our previous phylogenetic analysis of genes involved in mESC differentiation [61]. The implication of this is that use of model organisms such as
Danio rerio (zebrafish) and Xenopus in stem cell research may yield insights that can be translated into mammalian sys-tems, provided that the appropriate paralogous genes are chosen for study. Our analysis also suggests that the comple-tion of the genomes of members of the Urochordata, Cepha-lochordata, Hyperoartia, and Chondrichthyes taxa will provide great insight into the evolution of genes that are involved in the regulation of cellular and tissue complexity, in particular of those genes related to stem cell differentiation.
With this analysis we identified many stem cell specific mark-ers in parallel, allowing us to establish some concepts regard-ing the evolution of stem cells. This demonstrates the value of the new tools described in this work. The study of genes from our marker lists will allow identification of mechanisms and cell populations that together contribute to stem cell function in a variety of different tissues.
Conclusion
We have demonstrated a method for detection of markers from heterogeneous collections of samples of DNA microar-ray data of gene expression. We have applied this method to a highly heterogeneous set of stem cell gene expression data, with the objective being to detect markers relevant to stem cells, which a specific contextual question. The gap method detected markers through the unbiased generation of second-ary data, which facilitated directed analysis of the results.
We believe that our method is more appropriate for the iden-tification of targets for biomarker development than standard analytical techniques such as hierarchical clustering, when applied to DNA microarray data. The gap method is generally applicable to other large heterogeneous datasets in which one desires to find markers that act in a small proportion of the samples.
Materials and methods
EnvironmentManipulation of data and statistical calculations were per-formed in the R language (version 2.3.1), available over the internet [62]. Packages implemented for biologic applications are available from the Bioconductor project [63], which runs in the R computing environment.
Source of experimental data
Raw data in the form of Affymetrix CEL files for the appropri-ate samples were obtained from StemBase [64]. A subset of mouse samples based on the MOE430A/B DNA chip set was
selected, encompassing samples from embryonic and adult stem cells and their derivatives. Expression values were gen-erated from .CEL files using the GCRMA package [65] imple-mented in Bioconductor. Initial analyses allowed us to identify some samples whose values were in general outliers (because of nonstandard RNA preparation procedures). These were discarded and the expression values were re-com-puted with GCRMA on the reduced dataset. The data set used here contained 241 replicates (unique chips) derived from 83 different samples (of unique biological origin; Table 1). The expression signals were organized in a matrix with columns for samples and rows for probe sets, with the entries in the matrix representing the hybridization level.
Generation of database partitions
To identify possible permutations of partitions for the expres-sion matrix, we used a strategy to identify individual probe sets whose distribution of expression values appeared to have a break in continuity (a gap). This was motivated by the observation that known marker genes are expressed at two or more obviously distinct levels (see the example for Nestin in Figure 1a).
Briefly, for each probe set in the expression matrix, we ordered the expression values and calculated the differences between consecutive values. Large difference values suggest a demarcation in the expression values for a particular probe set, which may be the result of two underlying subpopulations of samples. If the difference exceeds a cut-off value, samples on either side of the gap are assigned to two groups (low/high expression) and encoded as binary vectors. The cut-off value used in this analysis was 50%, that is, a 1.5-fold difference, which on a log2 scale translates to approximately 0.6 units. This value was chosen to generate a number of partitions that did not produce an excessive rate of false positive clusters (see 'Filtering marker lists by size and number of classified sam-ples', below). Note that we consider the possibility of finding more than one gap.
We used majority voting rules to correct each binary vector so that all replicates of any given sample were either 0 or 1. Ties were assigned a 0. For example, if two out of three replicates were assigned a 1, then the remaining replicate was also assigned a 1. This ensures that database queries corresponded to the underlying vectors used in the analysis. These corrected vectors were used to score probe sets in each cluster, and they were also used to generate visualizations on the web server associated with this work [21].
Identification of markers for each partition
each group designated as highly expressed versus the expres-sion values exceeding the 90th percentile of the group with low
expression. This modified U statistic is linearly correlated to the partial area under the curve described by Pepe and coworkers [57] at a false positive rate of 10% (data not shown). The advantage of using the U-statistic here lies in its decreased computational cost as compared with the calcula-tion and integracalcula-tion of the area under the curve. The U scores were converted into a percentage of their maximum value for each group. Probe sets were ranked by these scores, and those exceeding 90% of the maximum U score were saved as candi-date markers for each binary vector. The choice of this thresh-old was determined to produce satisfactory results according to the precision/recall curves computed below.
For illustrative purposes, this section is the most computa-tionally intensive step and requires approximately 30 CPU hours to complete.
Filtering marker lists by size and number of classified samples
Because our analysis examines thousands of probe sets, the analysis above is likely to identify many non-significant markers by chance. A simple way to eliminate those is to accept only sample partitions that are identified by multiple probe sets. To establish a lower threshold for the length of marker list to be accepted, we generated marker lists using a randomized version of the expression matrix. The expression values for each probe set were randomly reassigned to sam-ples in order to destroy their biologic ordering while individ-ually maintaining their range and distribution. We then generated marker lists for each binary vector as described above. Approximately 98% of patterns formed from the rand-omized matrix were associated with two or fewer probe sets, suggesting that such patterns are likely to arise by chance. Thus, in our analysis of the stem cell dataset we decided to report only patterns associated with three or more probe sets.
We also observed that the patterns with the largest numbers of probe sets identified major groups of tissue specific genes and therefore were not useful because they reproduced obvi-ous sample partitions. For example, a cluster of 242 probe sets was identified that distinguished all blood related sam-ples (hematopoietic and general bone marrow related) from others in the database. We therefore did not report clusters with more than 200 probe sets. This selection resulted in a list of 893 patterns involving a total of 10,401 probe sets for 7,478 genes. We define this as the 'potential marker set' (Additional data file 1).
Calculation of precision/recall curves
In order to assess the method's performance in detecting 71 known stem cell marker genes (Table 2), we gradually decreased the upper limit of allowable cluster size in the data-set and calculated precision/recall values on the data-sets of clus-ters that passed the criteria at each step (Figure 3). This
analysis was used to choose a 90% cut-off for generating clus-ters (used in 'Identification of markers for each partition', above) with the gap method, and to define a smaller set of markers (from the 705 patterns with 63 or fewer markers), the 'selected marker' set (Additional data file 2).
Benchmarking of method with k-means clustering
In order to compare the gap method with an established method of grouping genes, we identified clusters of probe sets with k-means clustering according to their patterns of gene expression. We specified 1,000 clusters, which is similar to the number of clusters generated by the protocol described above, and selected the genes classified in those groups. The default algorithm for the 'kmeans' function in R was used. We computed the precision/recall values for k-means clustering by gradually decreasing the maximum allowable cluster size, as above. Because the k-means algorithm is not deterministic, to estimate the expected precision/recall we generated a mean precision/recall curve from 100 repetitions of k-means clustering. This curve is compared with curves generated using our clustering method in Figure 3.
We compared the overlap between the sets of genes selected using the gap method and k-means. For each of the k-means control runs, we selected the genes from the set of clusters that produced a recall of at least 45 known stem cell markers (this is the approximate recall level in Figure 3). The overlap between that k-means iteration and the gap method was com-puted as the fraction of genes selected by both methods divided by the total number of genes selected by either method. The mean overlap between the gap method and all k-means iterations was 69.8%.
Enrichment of Gene Ontology annotations