How does the zoo soundscape affect the zoo
experience for animals and visitors?
Marina Bonde de Queiroz
This thesis is presented to the School of Computing Sciences and Engineering, University of
Salford, in fulfilment of the requirements for the degree of PhD.
Supervised by Prof. William J. Davies and Prof. Robert J. Young
i
Abstract
This project aims to evaluate the zoo soundscape from the animals and visitors perspective. A complete acoustic environment study in zoological parks should involve these two different, but equally important, characters. This thesis presents the results of the influence of the sound components of the zoo environment in the welfare and behaviour of mammals and in the visitors’ experience.
Firstly, a critical literature review was made concerning the impact of noise on wildlife. Several papers were evaluated regarding some topics such as the target species, the sound source studied, and the methodology applied. The aim was to assess the reliability of the articles and to propose a guideline for future studies in this area. The results of the literature review have shown that only seven per cent of the published papers used suitable equipment and acoustic metrics to investigate the sound effect on wildlife and confirmed the importance of a complete and well-described methodology for studies replicability.
The influence of sound on zoo mammals was explored by direct recordings of animal behaviour and sound measurements, and by the collection of faecal samples for
glucocorticoid metabolites analysis in two zoos, Chester Zoo and Twycross Zoo. The results show that animals express some behavioural and hormonal responses to different
environmental sound amplitudes. Therefore, zoos could use these findings for a better animal management and enclosures planning.
The zoo soundscape perception by the public was investigated by the application of questionnaires with the soundwalk methodology around Chester Zoo. The objective of this part of the study is to understand how the zoo visitors perceive the environmental sound around the zoo and how different aspects of an area can influence the individual perception of the sound. The results show, among other important variables, that technological sounds can have a negative on the visitors’ perception and evaluation of the soundscape. For this reason, zoos should be more careful about the environmental sound of places with predominant technological sounds.
ii
Table of Contents
Section 1. General introduction ... 1
1.1. General methodology ... 3
Section 2. Evaluating the impact of noise on wildlife: a methodological literature review ... 5
2.1. Publications overview ... 7
2.2. Acoustic metrics applied ... 10
2.3. Animal groups studied ... 13
2.4. Are the acoustic metrics used with the animal groups appropriate to evaluate them?.. 14
2.5. Authors’ expertise ... 17
2.6. Review papers already published ... 19
2.7. Relevant standards and guidance ... 24
2.8. Conclusions ... 25
Section 3. Effect of noise on zoo mammals’ behaviour and enclosures soundscapes ... 28
The zoo visitors effect ... 28
Minimizing the zoo visitor effect ... 29
The sound effect ... 30
Objectives ... 31
3.1. Subjects of study ... 31
3.1.1. Aye-aye (Daubentonia madagascariensis) ... 31
3.1.2. Black rhinos (Diceros bicornis) ... 32
3.1.3. Okapi (Okapia johnstoni) ... 33
3.1.4. Two-toed sloths (Choloepus didactylus) ... 34
3.2. Data collection... 35
iii
3.4. Results ... 39
General sound pressure levels ... 39
3.4.1. Aye-aye ... 55
3.4.2. Black rhinos ... 57
3.4.3. Okapi ... 59
3.4.4. Two-toed sloths ... 62
3.5. Discussion ... 67
General sound pressure levels ... 67
3.5.1. Aye-aye ... 69
3.5.2. Black rhinos ... 70
3.5.3. Okapi ... 71
3.5.4. Two-toed sloths ... 72
3.6. Conclusions ... 73
Section 4. Effect of noise on zoo mammals’ glucocorticoid metabolites (GCM) levels ... 76
4.1. Subjects of study ... 77
4.1.1. Okapi (Okapia johnstoni) ... 78
4.1.2. Bornean orang-utans (Pongo pygmaeus) ... 78
4.2. Data collection... 78
4.2.1. Okapi ... 78
4.2.2. Orang-utans ... 79
4.3. Extraction of GCM ... 80
iv
4.3.1. Okapi ... 81
4.3.2. Orang-utans ... 81
4.4. Results ... 82
4.4.1. Okapi ... 82
4.4.2. Orang-utans ... 84
4.5. Discussion ... 90
4.6. Conclusions ... 91
Section 5. Soundscape perception by zoo visitors ... 93
5.1. Data collection... 95
5.1.1. Participants ... 95
5.1.2. Soundwalks ... 96
5.2. Statistical analyses... 100
5.3. Results ... 105
Overall evaluation of the zoo soundscape ... 107
5.3.1. Location 1 (Main entrance) ... 114
5.3.2. Location 2 (Tropical Realm) ... 116
5.3.3. Location 3 (Aye-ayes’ enclosure) ... 117
5.3.4. Location 4 (Spirit of the jaguar – Sloths’ area) ... 119
5.3.5. Location 5 (Madagascar play area) ... 120
5.3.6. Location 6 (Lions’ enclosure) ... 122
5.3.7. Location 7 (Capybaras’ enclosure) ... 124
v
5.3.9. Location 9 (Okapi’s enclosure) ... 128
5.4. Discussion ... 130
5.5. Conclusion ... 133
Section 6. Conclusions ... 135
6.1. Discussion ... 135
6.2. Recommendations for each studied species ... 138
6.2.1. Aye-aye ... 138
6.2.2. Black rhinos ... 139
6.2.3. Okapi ... 139
6.2.4. Two-toed sloths ... 140
6.2.5. Orang-utans ... 140
6.3. Recommendations for further work ... 140
6.4. Final conclusion ... 143
References ... 145
Appendices ... 159
Appendix 1. Overview of the literature evaluated in the review paper reported in Section 2. ... 159
Appendix 2. Invitation letter ... 175
Appendix 3. Information sheet ... 176
Appendix 4. Concepts list ... 178
Appendix 5. Consent form ... 179
vi
List of Tables
Table 1. Comparison of the weighting frequency filter according to the animal group
(percentage of studies found in the literature; N = 112) ... 16
Table 2. Wildlife species audiograms found in the literature. ... 17 Table 3. Comparison of the use of equipment by authors’ expertise (percentage of studies
found in the literature; N = 108) ... 18 Table 4. Comparison of the noise measurement equipment calibration by authors’ expertise
(percentage of studies found in the literature; N = 79) ... 18 Table 5. Comparison of the acoustic metrics used by authors’ expertise (percentage of studies
found in the literature; N = 86) ... 19
Table 6. Number of papers used in each review article cited (based on the number of papers
referenced, because not all articles are systematic reviews mentioning the number of papers
used) ... 22
Table 7. Comparison of the use of equipment before and after 2009 (percentage of studies
found in the literature; Before N = 60, After N = 48) ... 23
Table 8. Comparison of the noise measurement equipment calibration before and after 2009
(percentage of studies found in the literature; Before N = 43, After N = 36) ... 23
Table 9. Comparison of the acoustic metrics used before and after 2009 (percentage of
studies found in the literature; Before N = 43, After N = 43) ... 24
Table 10. List of important standards and guidance for use in biological and acoustics related
studies planning and development. ... 25
Table 11. General ethogram used to study the responses of mammals to visitor noise at
vii
Table 12. GLM results for the optimal models describing the relationship between the aye-aye’s behaviours and the independent variable (visitors count) during high and low seasons in
Chester Zoo, UK. ... 55
Table 13. GLM results for the optimal models describing the relationship between black rhinos’ behaviours and the independent variables (LAeq,10min, LA90,10min, visitors count,
individual, and weather) during low season in Chester Zoo, UK. ... 58 Table 14. GLM results for the optimal models describing the relationship between the okapi’s
behaviours and the independent variables (LZeq,10min, visitors, and weather), during high and
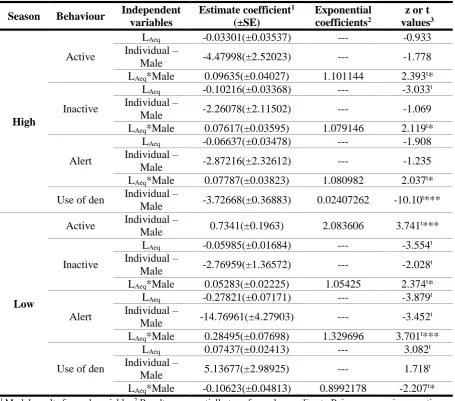
low seasons in Chester Zoo, UK. ... 60 Table 15. GLM results for the optimal models describing the relationship between the sloths’
behaviours and the independent variables (LAeq,10min and individuals), during the high and low
seasons in Chester Zoo, UK. ... 63
Table 16. Multiple linear regression results relating the okapi’s glucocorticoid metabolites
(GCM) using 72T enzyme immunoassay to equivalent sound levels (LZeq,open zoo) during the
opening hours and daily total number of visitors in Chester Zoo, UK. ... 83
Table 17. Linear regressions results relating the orang-utans’ glucocorticoid metabolites
(GCM) to the averaged equivalent sound levels (LAeq,open zoo) during opening hours in
Twycross Zoo, UK. ... 85
Table 18. Description of the location of the locations used in the soundwalks at Chester Zoo,
UK. ... 97 Table 19. Pearson’s coefficient of correlation among the principal component scores (C1 and
C2), soundscape attributes (eventful/uneventful, pleasant/unpleasant, exciting/monotonous,
and calm/chaotic), acoustics measures (LAeq and sound level perception), sound source
viii
Table 20. Stepwise multiple linear regression relating Eventfulness attribute to acoustics
measures (sound level perception) and sound source categories (natural and technological).
... 113
Table 21. Stepwise multiple linear regression relating Calmness attribute to acoustics
measures (LAeq and sound level perception), sound source categories (human, natural, and
technological), and enclosure area (indoor). ... 113
Table 22. Stepwise multiple linear regression relating Pleasantness attribute to sound source
category (human and technological). ... 113 Table 23. Pearson’s coefficient of correlation among the soundscape attributes
(eventful/uneventful, pleasant/unpleasant, exciting/monotonous, and calm/chaotic), acoustics
measures (LAeq and sound level perception), and sound source categories (human, natural,
and technological) for location 1 (Main entrance) in Chester Zoo, UK. ... 115 Table 24. Pearson’s coefficient of correlation among soundscape attributes
(eventful/uneventful, pleasant/unpleasant, exciting/monotonous, and calm/chaotic), and
acoustics measures (LAeq) for location 2 (Tropical Realm) in Chester Zoo, UK. ... 116 Table 25. Pearson’s coefficient of correlation among soundscape attributes
(eventful/uneventful, pleasant/unpleasant, exciting/monotonous, and calm/chaotic), acoustics
measures (LAeq and sound level perception), and sound source categories (human and
technological) for location 3 (Aye-ayes’ enclosure) in Chester Zoo, UK. ... 118 Table 26. Pearson’s coefficient of correlation among soundscape attributes
(eventful/uneventful, pleasant/unpleasant, exciting/monotonous, and calm/chaotic), acoustics
measures (LAeq and sound level perception), and sound source categories (human and
technological) for location 4 (Sloths’ area) in Chester Zoo, UK. ... 119
Table 27. Pearson’s coefficient of correlation among soundscape attributes
ix
measures (LAeq and sound level perception), and sound source categories (human and
technological) for location 5 (Madagascar play area) in Chester Zoo, UK. ... 121 Table 28. Pearson’s coefficient of correlation among soundscape attributes
(eventful/uneventful, pleasant/unpleasant, exciting/monotonous, and calm/chaotic), acoustics
measures (LAeq and sound level perception), and sound source categories (human, natural, and technological) for location 6 (Lions’ enclosure) in Chester Zoo, UK. ... 123
Table 29. Pearson’s coefficient of correlation among soundscape attributes
(eventful/uneventful, pleasant/unpleasant, exciting/monotonous, and calm/chaotic), acoustics
measures (LAeq and sound level perception), and sound source categories (human, natural, and technological) for location 7 (Capybaras’ enclosure) in Chester Zoo, UK. ... 125
Table 30. Pearson’s coefficient of correlation among soundscape attributes
(eventful/uneventful, pleasant/unpleasant, exciting/monotonous, and calm/chaotic), acoustics
measures (LAeq and sound level perception), and sound source categories (human and
technological) for location 8 (Tsavo black rhino reserve) in Chester Zoo, UK. ... 127
Table 31. Pearson’s coefficient of correlation among soundscape attributes
(eventful/uneventful, pleasant/unpleasant, exciting/monotonous, and calm/chaotic), acoustics
measures (LAeq and sound level perception), and sound source categories (natural and
x
List of figures
Figure 1. Visitors’ area of the aye-aye’s enclosure at Chester Zoo, UK. ... 32
Figure 2. Visitors viewing perspective in the black rhinos’ paddock at Chester Zoo, UK. .... 33
Figure 3. Visitors’ area of the okapi’s enclosure at Chester Zoo, UK. ... 34
Figure 4. Visitors viewing perspective in the two-toed sloths’ area at Chester Zoo, UK. ... 35
Figure 5. Sound pressure levels (LAeq,1hour, LA10,1hour, and LA90,1hour) in the aye-aye’s enclosure.
Comparisons between high and low seasons and times when Chester Zoo, UK, is open and
closed to the public. High season public opening times: from 10:00 to 17:00. Low season
public opening times: from 10:00 to 16:00. ... 43
Figure 6. Aye-aye’s enclosure sound pressure levels on the busiest visitor day during the high
season data collection at Chester Zoo, UK. Hours when the zoo was open to the public are
represented in white background (from 10:00 to 17:00) and hours when the zoo was closed to
the public are represented in grey background. Average equivalent sound levels (LAeq): for
the day 55.3 dB, open zoo 56.9 dB, closed zoo 54.6 dB. ... 44
Figure 7. Aye-aye’s enclosure sound pressure levels on the busiest visitor day during the low
season data collection at Chester Zoo, UK. Hours when the zoo was open to the public are
represented in white background (from 10:00 to 16:00) and hours when the zoo was closed to
the public are represented in grey background. Average equivalent sound levels (LAeq): for
the day 56.9 dB, open zoo 56.7 dB, closed zoo 56.9 dB. ... 45
Figure 8. Sound pressure levels (LAeq,1hour, LA10,1hour, and LA90,1hour) in the black rhinos’
enclosure. Comparisons between high and low seasons and times when Chester Zoo, UK, is
open and closed to the public. High season public opening times: from 10:00 to 18:00. Low
season public opening times: from 10:00 to 16:00. ... 46
Figure 9. Black rhinos’ enclosure sound pressure levels on the busiest visitor day during the
xi
are represented in white background (from 10:00 to 18:00) and hours when the zoo was
closed to the public are represented in grey background. Average equivalent sound levels
(LAeq): for the day 57.2 dB, open zoo 58.8 dB, closed zoo 56.1 dB. ... 47 Figure 10. Black rhinos’ enclosure sound pressure levels on the busiest visitor day during the
low season data collection at Chester Zoo, UK. Hours when the zoo was open to the public
are represented in white background (from 10:00 to 16:00) and hours when the zoo was
closed to the public are represented in grey background. Average equivalent sound levels
(LAeq): for the day 59.0 dB, open zoo 59.2 dB, closed zoo 58.9 dB. ... 48
Figure 11. Sound pressure levels (LAeq,1hour, LA10,1hour, and LA90,1hour) in the okapi’s enclosure.
Comparisons between high and low seasons and times when Chester Zoo, UK, is open and
closed to the public. High season public opening times: from 10:00 to 17:00. Low season
public opening times: from 10:00 to 16:00. ... 49
Figure 12. Okapi’s enclosure sound pressure levels on the busiest visitor day during the high
season data collection at Chester Zoo, UK. Hours when the zoo was open to the public are
represented in white background (from 10:00 to 17:00) and hours when the zoo was closed to
the public are represented in grey background. Average equivalent sound levels (LAeq): for
the day 52.1 dB, open zoo 56.6 dB, closed zoo 46.0 dB. ... 50 Figure 13. Okapi’s enclosure sound pressure levels on the busiest visitor day during the low
season data collection at Chester Zoo, UK. Hours when the zoo was open to the public are
represented in white background (from 10:00 to 16:00) and hours when the zoo was closed to
the public are represented in grey background. Average equivalent sound levels (LAeq): for
the day 53.9 dB, open zoo 58.1 dB, closed zoo 50.6 dB. ... 51
Figure 14. Sound pressure levels (LAeq,1hour, LA10,1hour, and LA90,1hour) in the two-toed sloths’
xii
open and closed to the public. High season public opening times: from 10:00 to 18:00. Low
season public opening times: from 10:00 to 16:00. ... 52
Figure 15. Two-toed sloths’ enclosure sound pressure levels on the busiest visitor day during
the high season data collection at Chester Zoo, UK. Hours when the zoo was open to the
public are represented in white background (from 10:00 to 18:00) and hours when the zoo
was closed to the public are represented in grey background. Average equivalent sound levels
(LAeq): for the day 61.6 dB, open zoo 66.9 dB, closed zoo 43.8 dB. ... 53
Figure 16. Two-toed sloths’ enclosure sound pressure levels on the busiest visitor day during
the low season data collection at Chester Zoo, UK. Hours when the zoo was open to the
public are represented in white background (from 10:00 to 16:00) and hours when the zoo
was closed to the public are represented in grey background. Average equivalent sound levels
(LAeq): for the day 59.3 dB, open zoo 65.1 dB, closed zoo 46.5 dB. ... 54 Figure 17. Aye aye’s behaviours and visitors count during high season data collection at
Chester Zoo, UK. ... 56 Figure 18. Aye aye’s behaviours and visitors count during low season data collection at
Chester Zoo, UK. ... 56 Figure 19. Black rhinos’ behaviours and visitor count, and decibels levels (LAeq,10min and
LA90,10min) during the low season data collection at Chester Zoo, UK. ... 58 Figure 20. Black rhinos’ alert behaviour response to LAeq,10min by individual, during low
season in Chester Zoo, UK. Trend curves based on GLM result: Female 1 – Alert behaviour
= e^(-6.669857+0.120936*LAeq); Calf – Alert behaviour = e^(0.415033-0.00691*LAeq);
Female 2 – Alert behaviour = e^(-4.156295+0.063673*LAeq)... 59 Figure 21. Okapi’s behaviours and visitor count, and decibels levels (LZeq,10min) during the
xiii
Figure 22. Okapi’s behaviours and visitor count, and decibels levels (LZeq,10min) during the
low season data collection at Chester Zoo, UK. ... 61 Figure 23. Sloths’ active behaviour response to LAeq,10min by individual, during high season in
Chester Zoo, UK. Trend curves based on GLM result: Female – Active behaviour =
e^(2.15242-0.03301*LAeq); Male – Active behaviour = e^(-2.32756+0.06334*LAeq). ... 64 Figure 24. Sloths’ inactive behaviour response to LAeq,10min by individual, during high season
in Chester Zoo, UK. Trend curves based on GLM result: Female – Inactive behaviour =
e^(6.41371-0.10216*LAeq); Male – Inactive behaviour = e^(4.15293-0.02599*LAeq). ... 64 Figure 25. Sloths’ alert behaviour response to LAeq,10min by individual, during high season in
Chester Zoo, UK. Trend curves based on GLM result: Female – Alert behaviour =
e^(1.83739-0.06637*LAeq); Male – Alert behaviour = e^(-1.03477+0.0115*LAeq). ... 65 Figure 26. Sloths’ inactive behaviour response to LAeq,10min by individual, during low season
in Chester Zoo, UK. Trend curves based on GLM result: Female – Inactive behaviour =
e^(5.65154-0.05985*LAeq); Male – Inactive behaviour = e^(2.88195-0.00702*LAeq). ... 65 Figure 27. Sloths’ alert behaviour response to LAeq,10min by individual, during low season in
Chester Zoo, UK. Trend curves based on GLM result: Female – Alert behaviour =
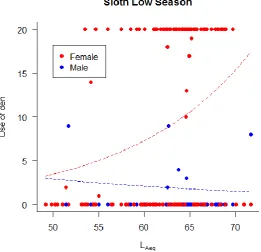
e^(13.38498-0.27821*LAeq); Male – Alert behaviour = e^(-1.38463+0.00674*LAeq). ... 66 Figure 28. Sloths’ use of den response to LAeq,10min by individual, during low season in
Chester Zoo, UK. Trend curves based on GLM result: Female – Use of den =
e^(-2.47372+0.07437*LAeq); Male – Use of den = e^(2.66305-0.03186*LAeq). ... 66
Figure 29. Summer event in Twycross Zoo, UK. Stage concert located next to the orang-utans’ enclosure (light-orange building). ... 80
Figure 30. Background noise levels (LZ90,open zoo) during zoo opening times of the high and the
low seasons at the okapi enclosure in Chester Zoo, UK. Red dots represent the mean values
xiv
Figure 31. Okapi’s glucocorticoid metabolites (GCM) levels in two different enzyme
immunoassay (72a and 72T) for the five days of data collection during high season in Chester
Zoo, UK. The orange line represents the equivalent sound levels (LZeq,open zoo) during opening
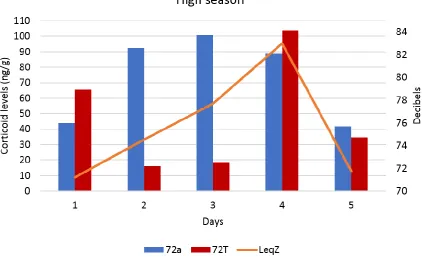
times of the zoo. ... 83 Figure 32. Okapi’s glucocorticoid metabolites (GCM) levels in two different enzyme
immunoassay (72a and 72T) for the five days of data collection during low season in Chester
Zoo, UK. The orange line represents the equivalent sound levels (LZeq,open zoo) during opening
times of the zoo. ... 84
Figure 33. Orang-utans’ enclosure sound pressure levels during a summer event day in
Twycross Zoo, UK. Hours when the zoo was open to the public are represented in white
background (from 10:00 to 20:30) and hours when the zoo was closed to the public are
represented in grey background. ... 86
Figure 34. Equivalent sound levels (LAeq,open zoo) during opening times of the zoo in non-event
and event days at the orang-utan enclosure in Twycross Zoo, UK. Red dots represent the
mean values and the red arrows represent the standard deviation values. ... 87
Figure 35. Orang-utans’ glucocorticoid metabolites (GCM) levels for non-event and event
days in Twycross Zoo, UK. Red dots represent the mean values and the red arrows represent
the standard deviation values. ... 87
Figure 36. Glucocorticoid metabolites (GCM) levels for each individual orang-utan and for
the group average during the four studied weekends in Twycross Zoo, UK. The orange line
represents the equivalent sound levels (LAeq,open zoo) during opening times of the zoo. ... 88 Figure 37. Batu’s (adult male orang-utan) glucocorticoid metabolites responses (GCM)
according to equivalent sound levels (LAeq,open zoo) in Twycross Zoo, UK. Trendline based on
xv
Figure 38. Kibriah’s (adult female orang-utan) glucocorticoid metabolites responses (GCM)
according to equivalent sound levels (LAeq,open zoo) in Twycross Zoo, UK. Trendline based on
linear regression result: GCM = -1249.52+35.38*LAeq. ... 89
Figure 39. Soundwalk questionnaire used in Chester Zoo, UK. ... 98
Figure 40. Soundwalks route and locations in Chester Zoo, UK. The black line represents the
route and the white numbers represent the locations where the participants filled each
questionnaire. ... 99
Figure 41. Photographs of the soundwalk locations at Chester Zoo, UK. Location 1 (Main
entrance of the zoo), location 2 (Tropical Realm), location 3 (Aye-ayes’ enclosure), location
4 (Spirit of the jaguar – Sloths’ area), location 5 (Madagascar play area), location 6 (Lions’ enclosure), location 7 (Capybaras’ enclosure), location 8 (Tsavo black rhino reserve),
location 9 (Okapi’s enclosure). ... 100
Figure 42. Soundwalks participants’ responses for the four scale attributes by locations in
Chester Zoo, UK. The circled locations are the attributes evaluations that were significantly
different among soundwalks. ... 102 Figure 43. Participants’ responses to the Pleasant/Unpleasant attribute by each of the nine
soundwalk days at location 1 (Main entrance) in Chester Zoo, UK. ... 103 Figure 44. Participants’ responses to the Pleasant/Unpleasant attribute by each of the nine
soundwalk days at location 6 (Lions’ enclosure) in Chester Zoo, UK. ... 103 Figure 45. Participants’ responses to the Pleasant/Unpleasant attribute by each of the nine
soundwalk days at location 7 (Capybaras’ enclosure) in Chester Zoo, UK. ... 104
Figure 46. Participants’ responses to the Calm/Chaotic attribute by each of the nine
soundwalk days at location 1 (Main entrance) in Chester Zoo, UK. ... 104
Figure 47. Equivalent sound levels in the nine locations over the conducted soundwalks in
xvi
Figure 48. Sound level perception by the participants in the nine locations during the
soundwalks in Chester Zoo, UK (none of the locations was classified as very loud). ... 106
Figure 49. Main source of sound perceived by the participants in the nine locations during the
soundwalks in Chester Zoo, UK. ... 106
Figure 50. Soundscape evaluation ratings for Chester Zoo, UK (all locations together). ... 107
Figure 51. Principal component analysis result for the soundscape evaluation of Chester Zoo,
UK. Component 1 eigenvalue: 2.73. Component 2 eigenvalue: 1.22... 108
Figure 52. Principal component analysis result by locations for the soundscape evaluation of
Chester Zoo, UK. Component 1 eigenvalue: 2.73. Component 2 eigenvalue: 1.22. ... 109
Figure 53. Soundscape evaluation ratings for location 1 (Main entrance) in Chester Zoo, UK.
... 114
Figure 54. Soundscape evaluation ratings for location 2 (Tropical Realm) in Chester Zoo,
UK. ... 116
Figure 55. Soundscape evaluation ratings for location 3 (Aye-ayes’ enclosure) in Chester
Zoo, UK. ... 117
Figure 56. Soundscape evaluation ratings for location 4 (Sloths’ area) in Chester Zoo, UK.
... 119
Figure 57. Soundscape evaluation ratings for location 5 (Madagascar play area) in Chester
Zoo, UK. ... 120 Figure 58. Soundscape evaluation ratings for location 6 (Lions’ enclosure) in Chester Zoo,
UK. ... 122 Figure 59. Soundscape evaluation ratings for location 7 (Capybaras’ enclosure) in Chester
Zoo, UK. ... 124
Figure 60. Soundscape evaluation ratings for location 8 (Tsavo black rhino reserve) in
xvii
Figure 61. Soundscape evaluation ratings for location 9 (Okapi’s enclosure) in Chester Zoo,
xviii
Glossary
Acoustics-related terms (Howard and Angus (2009) and IEC (2018))
Acoustic masking: is caused by a noise intense enough to render inaudible or unintelligible another sound that is also present.
Audiogram: agraph showing hearing perception as a function of frequency, measured with an audiometer.
Background noise: is the sound level at a given location and time, measured in the absence of intermittent noises, any other extraneous or alleged noise nuisance sources (i.e. baseline noise level).
Decibels: alogarithmic unit used to describe the ratio between the measured sound level and the reference level, widely used in acoustics, electronics, and communications.
Equivalent sound levels: is the sound level in decibels equivalent to the total sound energy measured over a stated period of time.
Frequency weightings: is a way to correlate the measured sound pressure levels with the subjective human response.
Infrasound: acoustic oscillation whose frequency is below the low-frequency limit of audible sound (about 16 Hz).
Integration period: is the time histories measured and recorded in the sound level meters. Octave frequency bands: range of frequencies whose upper-frequency limit is twice that of its lower frequency limit. Sound pressure level is often measured in octave bands.
Peak sound level: is the greatest instantaneous value of a standard-frequency-weighted sound pressure level, within a stated time interval.
Sound pressure level: uses a logarithmic scale to represent the sound pressure of a sound relative to a reference pressure. The reference sound pressure is typically the threshold of human hearing.
Soundscape: is the component of the acoustic environment that can be perceived by humans. Soundwalk: theacoustic method used to investigate individual's perception of the
xix
Statistical noise levels (Ln): is the level exceeded by the chosen percentage of the time
(widely used in 10%, 90% and 95%).
Ultrasound: acoustic oscillation whose frequency is above the high-frequency limit of human audible sound (about 16 kHz).
Biological-related terms (Mills (2010))
Animal welfare: how an animal is coping with the conditions in which it lives or its quality of life.
Abnormal behaviour: is defined as an untypical behavioural reaction to a particular combination of motivational factors and stimuli. It is often considered to be an indicator of poor animal welfare.
Cortisone enzyme immunoassay: is a kit designed to quantitatively measure cortisone present in extracted dried faecal samples, urine, saliva, plasma, etc. This is often used to assess physiological stress levels.
Ethogram: a catalogue or table of all the different kinds of behaviour or activity with their description observed in an animal.
Focal sampling: is a sampling method in which all of the actions of one animal are recorded for a specified time period.
Foraging behaviour: is the act of searching for food resources.
Metabolite: is a substance produced during or taking part in metabolic processes.
Phylogenetics: is the study of the evolutionary history and relationships among individuals or groups of organisms.
Scan sampling: is a sampling method in which the behaviours of all the individuals in a group of animals are recorded at predetermined time intervals.
xx
Acknowledgement
I would like to thank both of my supervisors Bill Davies and Rob Young for giving me this great opportunity of doing my PhD at the University of Salford. Since my undergraduate final project and my master’s dissertation, Rob, with his passion for the research in animal
behaviour, has encouraged me to follow an academic career. I am deeply grateful to him for inviting me to come to the UK, for the talks, the learning, the example as a professional. I am also grateful to Bill, who, without even knowing me before, accepted to supervise me, taught me a completely new subject, and trusted that my background in biology would not be an obstacle in learning acoustic engineering. It has been a unique experience to combine my background knowledge in biology and the acoustics with the supervision of these two highly qualified professors.
I am grateful to the program Science without Borders and to the Coordination for the Improvement of Higher Educational Personnel (CAPES) for the financial support of my studies.
Chester Zoo, represented by Leah Williams, Lisa Holmes, and Victoria Davis, and Twycross Zoo, represented by Clare Ellis, who accepted the idea of my project being
developed in their facilities; and the keepers from both zoos, who without their time and help in installing the sound equipment and collecting the faecal sample this research would not be possible. The University of Vienna’s School of Veterinary Medicine, represented by Rupert Palme, who kindly performed the measurements of the glucocorticoid metabolites from the collected faecal samples.
Chiara Benvenuto, David Waddington, Jean Boubli, Paul Kendrick, Geoff Hosey, James Woodcock, and Angelica Vasconcellos for the advice throughout the development of my PhD.
I am thankful to Luiza Passos, who have received me here with a place to live and a comforting friendship. Luiza, Lu, and Ju, for being such good companies as kind flatmates. For the talks, “therapies”, drinks and meals together, trips, and affection.
xxi
I am always grateful to my favourite girls in Brazil who even with an ocean apart were permanently by my side. Thank you for the love and for being my soul sisters (Nani, Rapha, Sarinha, Drica, Lala, Lu, Flavinha, Mari, and Nay).
My family Bonde, Queiroz, and Figueiredo Coelho, for the love and care, especially my mother who was always there for me, who believed in me since the beginning. I am grateful for the endless and patient talks on Skype, for the love, and for being an example of a woman for me.
Last but definitely not least, I am eternally grateful to my partner in life, Helder. For understanding since the beginning my choice of moving to the UK, for passing through the long-distance relationship, for crossing the ocean and leave his life behind to live by my side, for helping me overcome with dignity one of the biggest challenges in my life, for the
1
Section 1. General introduction
Environmental noise can affect human well-being adversely and this effect has been
extensively investigated (see Basner and McGuire (2018), Clark and Paunovic (2018), Guski
et al. (2017), Marquis-Favre et al. (2005a), Marquis-Favre et al. (2005b), Nieuwenhuijsen et
al. (2017), Sliwinska-Kowalska and Zaborowski (2017), and van Kempen et al. (2018), for
review). Thus, human studies can provide baseline information about this effect in other
mammals, especially as the mammalian auditory system morphology is broadly similar
across species (Fay, 1994), despite species having different sensitivities to different sound
frequencies, due to differences in the scale and forms of the middle and external ear
structures (Fay, 1994). However, even in humans, it is difficult to measure the impact caused
by noise because tolerance levels differ between populations. Singh and Davar (2004) state
that noise may result in the loss of hearing, stress, high blood pressure, loss of sleep,
distraction, and a reduction in the quality of life. In the same study, the authors concluded
that noise could interfere with interpersonal communication.
Several studies have investigated what is the relationship between the quantitative
measurement and the human perception of the sound (Axelsson et al., 2010, Chau et al.,
2010, Nilsson and Berglund, 2006, Park and Siebein, 2015, Raimbault, 2006, Vianna et al.,
2015). Research made in various ambient (e.g. urban, city parks, green areas, rural,
countryside) explored the effects of noise on people and some subjective scales and concepts
of the acoustic environments. Moreover, one common conclusion in these aforementioned
studies is the relevance of the acoustic comfort or annoyance knowledge in the fields of noise
pollution or soundscape planning.
The perception of the sound can be influenced by the individual sensitivity to noise,
by the different environment, and by the activity undertaken. A study has shown that in a
non-2
natural (aircraft and road noise) sounds than people that go to the same place for hiking or
scenery appreciation (Chau et al., 2010). The same study revealed that visitors can express
dislike and annoyance for human-caused noise, such as conversation, for example.
This concept of sound effect and human annoyance to noise can be applied to a zoo
environment, where people go for diverse activities and could be impacted in any way by the
acoustic environment of the place. For instance, if an animal enclosure causes echoes or
reverberation of the sound, this could make people speak louder and, consequently, it can result in a negative effect on the visitors’ perception of the venue. Furthermore, if the inside
area of the same enclosure (the animal area) is also reverberant, this may have a reflection of
the animals and cause an impact on their well-being.
In humans, the study of the effects of noise on health and how the noise can cause
different levels of annoyance is possible to perform (Floud et al., 2013, Jarup et al., 2008,
Nivison and Endresen, 1993, Sorensen et al., 2011, Sorensen et al., 2014). In wild animals,
there is still the possibility of using behavioural and physiological aspects to investigate the
noise effect on health (Blickley et al., 2012, Derose-Wilson et al., 2015, Hayward and
Hayward, 2009). However, the wild animals’ annoyance to noise could be much more
difficult to measure, because this would require an individual assessment. In humans, the
stressful effects caused by noise may be reduced if people feel that they can control or escape
from the noise (Payne et al., 2009). In most zoo environments, such control is possible for
visitors, who can easily leave an uncomfortable area, but this control is not possible for the
animals. This reinforces some findings supporting that the opportunity to escape from
aversive stimulus would be beneficial for animals (Fernandez et al., 2009, Kuhar, 2008).
Zoos have been trying to make animal enclosures visibly more natural from the
visitor’s perspective, but it is hard to create a realistic environment from the animals’
3
with environmental sound in forests and savannahs; however, there are few cases where the
natural sound is compared with the noise in zoos (Morgan and Tromborg, 2007). The mean
sound pressure levels (SPL) during open days at the zoo can be more than 60 dB(A) (Quadros
et al., 2014), while in the wild, Atlantic Forest, for example, it is normally around 38 dB(A)
(Santos, 2012).
Presently, around ten per cent of the world’s human population visits zoos every year,
and, consequently, many zoo animals are exposed to large numbers of visitors (Gusset and
Dick, 2011). This number of visitors in zoos has led to a variety of studies, many of them
related to the impact of visitors presence on animal welfare--the zoo visitor effect (Davey,
2006b, Davey, 2007, Hosey, 2000). Modern zoos have important goals such as conservation,
public education, research, and entertainment (Fernandez et al., 2009) and the UK visitors
perceive zoos in this manner (Reade and Waran, 1996). Despite this, in the same study,
people said that the major reason for a visit to a zoo is for their entertainment.
1.1. General methodology
This research is divided into three main topics: an evaluation of the literature regarding the
methods applied when the impact of sound pollution on wildlife was investigated (Section 2); the zoo animals’ perspective of the environmental sound and how they can be influenced by
it (Section 3 and 4); and the zoo visitors’ perspective about the soundscape of this venue
(Section 5). All the research reported here was approved by the Chester Zoo and Twycross Zoo’s Ethics Committee and by the University of Salford Science and Technology Ethics
Panel (ethics application ST1617-46).
The extensive systematic literature review was made with the intent to discuss the
4
acoustic knowledge has been applied in studies involving biological topics. The outcomes
from this critical review are found in the next section (Section 2).
The investigation of the mammals’ response to noise (behavioural and physiological)
was made by the observation of five different species in two different zoos in the UK,
Chester Zoo (aye-aye - Daubentonia madagascariensis, black rhinos - Diceros bicornis, okapi - Okapia johnstoni, and two-toed sloths - Choloepus didactylus) and Twycross Zoo (Bornean orang-utans - Pongo pygmaeus). The choice of the species was based on species that the zoos are more concerned about their welfare and mammal enclosures that receive
larger audiences, which would help in analysing different characteristics of the sound
produced. The data collection applied to each zoo and the results will be described in more
details in the sections regarding this subject (Sections 3 and 4).
The zoo visitors’ perception of the acoustic environment was made by the soundwalks
methodology in Chester Zoo. The participants, zoo members and volunteers recruited with
the help of the Chester Zoo staff, answered questionnaires that helped to get an on-site
response about the zoo soundscape. Details about the participants’ recruitment, the
soundwalks practice, and the results can be found in Section 5.
The three main topics of the present study, mentioned above, are being developed
with the aim to contribute to zoos around the world and their role in animal conservation.
There are some factors that are crucial for the zoos: the number of visitors and the duration of
their visit (Fernandez et al., 2009). Active and healthy animals (Johnston, 1998, Moss and
Esson, 2010) and enclosures that simulate a natural environment (Davey, 2006a, Johnston,
1998) increase the number of visitors and the duration of a visit. Large crowds and longer
visits are important because they increase the profits from sales of food and souvenirs, for
5
Section 2. Evaluating the impact of noise on wildlife: a
methodological literature review
Sound pollution is recognised as a critical environmental problem, alongside water and air
pollution, and in urban areas, it is considered a serious threat to human quality of life
(Rossing, 2007, WHO, 1999). The effect of noise on animals has been studied for more than
fifty years, when several papers were published covering a variety of subjects concerning the
different sources of sound pollution, especially anthropogenic noise (Chen and Koprowski,
2015, Delaney et al., 2011, Grubb et al., 2013, Quadros et al., 2014, Shannon et al., 2014).
Anthropogenic noise has greater acoustic energy at low frequencies (Katti and Warren,
2004), which permits this kind of noise to propagate for longer distances since low-frequency
waves attenuate more gradually by distance than sound at higher frequencies (Kinsler et al.,
2000).
For a long time, research on the impacts of sound was only in relation to human health
(Azrin, 1958, Fausti et al., 1981, Jerison, 1959, Nowak et al., 2016, Smith, 1989, Szalma and
Hancock, 2011). Thereafter, following the worldwide concern about environment
conservation, this topic has now been more commonly shared with non-human animals
(Andersen et al., 1989, Brewer, 1974, Conomy et al., 1998, Crino et al., 2013, Lengagne,
2008). Most of the studies about the impact of sound on animals has had laboratory animals
as their subjects (Heffner and Heffner, 2007, Lauer et al., 2009, Liu et al., 2016, Longenecker
et al., 2014, Milligan et al., 1993, Sales et al., 1999, Turner et al., 2005, Turner et al., 2012,
Voipio, 1997); however, the impact of noise on wildlife, as a research topic, has recently
become more popular with scientists (Chen and Koprowski, 2015, Derose-Wilson et al.,
2015, Ditmer et al., 2015, Duarte et al., 2015, Hillman et al., 2015, LaZerte et al., 2015).
The influence of sound on wildlife is largely assessed by how it modifies animal
6
behaviours can be an indicator of stress (Barnett and Hemsworth, 1990). For vocal animals,
such as birds, calling behaviour plays an essential role in their survival (Hollen and Radford,
2009). These animals are constantly affected by acoustic interference (masking) when the
background noise reduces the active space of the signal they produce (Marten and Marler,
1977). Despite the majority of the studies evaluating animals’ responses to noise by
behavioural analysis, physiological responses can also show stress-related outcomes (Barnett
and Hemsworth, 1990) and should be applied more in studies related to stress. Exposure to a
brief but loud noise event can result in an acute stress response, increasing the secretion of
glucocorticoids (a hormone associated with stress); in contrast, long-term exposure to a
chronic noise stressor can result in reduced glucocorticoid levels (Romero, 2004, Wikelski
and Cooke, 2006).
All of these responses that animals can make to noise may be triggered by different
sound sources, such as traffic, machines, conversation, guns, compressors, chainsaws,
aircraft, environmental sound (rain, wind, and other animal vocalisations), and others (Chen
and Koprowski, 2015, Cote et al., 2013, Duarte et al., 2015, LaZerte et al., 2015). These
different kinds of sounds, each one with different acoustic characteristics, require different
acoustic evaluations (see examples in Pater et al. (2009) and Delaney et al. (1999)). However,
these specific measurements have not always been done using appropriate methods, and this
will be discussed further below.
An overview of what is found in the present literature about the impact of noise on
wildlife is presented. It includes a selection of studies on vertebrates, though some vertebrates
were not included due to differences in sound perception and emission, which demand a
different kind of evaluation (they are elephants which involve infrasound – sounds between 1
Hz and 20 Hz – and vibration, bats which involve ultrasound – sounds over 20 kHz –, and
7
keywords “noise, noise pollution, noise exposure, ambient noise, aircraft noise,
anthropogenic noise, environmental noise, traffic noise, urban noise, acoustic adaptation,
acoustic communication, acoustic interference, acoustic stress, aircraft disturbance, human disturbance” combined with the following keywords “animal behav*, animal communication,
animal welfare, wildlife, zoo*, captive animal”. The initial search found 1421 articles, which
were filtered by reading the abstracts to confirm that they fell within the subject of this
review. The discussion will refer to 121 articles (Appendix 1), from 1974 to 2015, which
were evaluated according to sources of noise and the procedures used to measure the noise
effect on wildlife (e.g. kind of equipment used, the acoustic metric described, how the
animals were evaluated, and others). The aim is to assess the methodologies described in
these studies and to propose a practical guideline for future research in this multidisciplinary
area.
2.1. Publications overview
Acoustic interference on wildlife can be caused by diverse sources of sound. Until 1999, the
most studied source of noise (84% of papers) was that produced by aircraft, such as
helicopters or aeroplanes, even though many other sources of noise can affect animals. After
the year 2000, the concern about noise impact in wildlife changed to the investigation of
anthropogenic and, specifically, traffic noise (64% of papers). Traffic noise was considered
as a separate category from other sources of anthropogenic noise because of the significant
number of papers that have evaluated this specific kind of disturbance. As anthropogenic
noise, it was considered sounds generated by machines, conversations, guns, explosions, oil
and natural gas drilling and compressors, chainsaws, and mining. Environmental noise, such
as background noise in nature, and some experiments using white noise are also found in the
8
The methodologies applied in the papers reviewed here differ significantly between
them, which makes comparison difficult to perform. Some studies did not use any equipment
to measure or record the sound (19% of papers). These studies have evaluated noise in a
subjective manner, considering only the presence or absence of noise, or the proximity to the
noise source. The evaluation of animal response to noise without quantifying the noise
appropriately restricts the usability of the results (Pater et al., 2009) because the perception of
noise varies and it depends on the receptor. The use of noise meters or sound level meters
(SLM) is an easy way to work around this lack of information about the amplitude of the
sound. Many authors have used this methodology (62% of papers) and have applied the
objective measurement of sound; however, to improve the reliability of the acoustic data, this
equipment needs to be calibrated before and after use, and only 15% of the cited studies have
mentioned the calibration of the devices. Calibration is important to ensure that the
measurements are consistent and accurate against a consistent noise source. Failure in doing
the calibration can cause bias in the results leading to an error of a few decibels. When
purchasing a sound level meter, the kit normally includes a portable calibrator that is
adequate for daily calibration. Nevertheless, all equipment, including the calibrator, need to
be checked regularly (every two years) (IEC 61672-3, 2013, Talbot-Smith, 1999). The sound
level meters can be classified as class 1 or class 2. Class 1 sound level meters present a lower
tolerance for errors and provide frequency-weightings A, C, and Z, that will be described
below (IEC 61672-1, 2013). For these higher specifications, class 1 sound level meters are
indicated for environmental field use. Sound pressure levels can also be extracted from sound
recordings using computers and specific software, but this method was used only by 15% of
the examined studies. When this method is used, the computer system should be acoustically
9
When recording or measuring noise, the frequency range of the microphone needs to
be checked to make sure that it specifications will reach the requirements of the study. For
example, a microphone suitable for the human hearing range (20-20000 Hz) might not record
the lower frequencies of an elephant vocalisation (normally around 14-35 Hz; Payne et al.
(1986); Poole et al. (1988)), and this could cause an underestimation of the effect of noise on
its callings. Equally important, to help increase the accuracy of the field measurements, a
windshield should be used over the microphones to avoid an interference of wind noise in the
lower frequencies of the measurement (Lin et al., 2014).
Although field studies often do not mention equipment calibration, studies using the
playback of sound to animals were more aware of calibration. Eighty-four per cent of these
playback studies mentioned calibration of the sound before the animals were exposed to it.
This calibration in playback experiments is important, as it is known that the animals can
express a response to the reproduction of sound (Hanna et al., 2014, Meillere et al., 2015,
Shannon et al., 2014): if the sound is played at a high amplitude, the animal can respond due
to the intensity of the recording and not due to a specific frequency or specific type of noise,
or the opposite situation can happen if the sound amplitude is too low. There is another point
that the researchers should take into account when developing this kind of experiments; the
response to the playback can happen due to the sudden increase of sound pressure levels,
when the sound source is turned on, and may not express a direct response to the kind of
noise or loudness of the noise. A study made with humans has shown that people tend to
respond to an in-situ soundscape differently from a soundscape reproduction (Sudarsono et al., 2016). It has been discussed that soundscape reproduction by speakers (2D ambisonic
system), possibly, causes a different perception of the sound between the reproduction
10
2.2. Acoustic metrics applied
Regarding the acoustic metrics used by the researchers, it is possible to notice a lack of
consistency: 31% of them have only presented the results in decibels, not specifying which
kind of metric was used, 30% have used sound pressure levels (SPL), and 23% have used
equivalent sound level (Leq). The absence of description when mentioning the acoustic
metrics applied during the study can cause an impediment if a researcher wants to replicate
the experiment. Leq is a metric frequently used as a noise index because it calculates the
average equivalent sound level experienced over a period of time (Howard and Angus, 2009).
It is based on the mean acoustic energy over time of a varying sound, and it gives a
convenient single-figure average of a noisy environment, which may be varying over a wide
range of amplitudes at a variable rate. Leq has been shown to be a suitable basis for predicting
human response to noise both at high levels (e.g. hearing loss; Howard and Angus (2009))
and more moderate exposure (e.g. annoyance; Miedema and Vos (2004)). There is no
evidence that it is the best predictor for non-human animals. Nevertheless, it is possible to use
this metric for mammals, assuming that their hearing systems are similar among the group,
and it is probably better to use it than SPL or an unspecified decibel metric. It is important to
state that Leq is not a simple mean of the SPL over a period of time, but rather the average of
the underlying sound energy. Obtaining Leq needs either an integrating sound level meter to
measure it directly or a calculation by an equation as found in Howard and Angus (2009) and
Pater et al. (2009), for example. Leq is a good measure of the total acoustic environment but it
does not discriminate between components of the sound field. If it is suspected that the
observed response to the sound depends on either the background sound or conversely on the
highest amplitudes, then percentile levels can be used. L10 is the SPL exceeded 10% of the
monitoring time and is often used as a more stable and representative measure than the
11
the monitoring time and is often used to represent the background underlying or ambient
SPL. None of the evaluated papers has used this last metric when analysing the effect of
environmental noise. If transient noise sound levels caused by specific events, such as an
aircraft flyover, are important, these can be assessed with the sound exposure level (SEL).
SEL can be defined as the constant sound pressure levels that have the same amount of
energy in one second as the original noise event (Pater et al., 2009). One SEL should be
measured for each event when using this metric. Although this acoustic metric is ideal for
analysis of transient noise events, only 21% of the evaluated papers have used it to express
the disturbance caused by aircraft.
Another type of acoustic metric that represents an important modifying role in
acoustic measurements is the frequency response filter. This filter is generally used to
simulate the response of the ear system to acoustic signals. The human ear does not respond
to different sound amplitude at different frequencies in the same manner: it is frequency
selective. Hearing sensitivity varies as the frequency varies; it is not flat, and it is dependent
on the sound pressure levels. During sound measurements, a way to compensate these
differences in the sensibility to sounds is the use of correct frequency weighting filters
(Howard and Angus, 2009). In the reviewed literature, 49% of the studies have used
A-weighted filter, 20% have used flat, linear, unA-weighted, or z-A-weighted filters, 14% have used
C-weighted filter, 4% have used a species-specific frequency curve, and 22% have not
described the filter used. As was pointed out previously, methodologies should always be
adequately described, and the mention of the frequency filter used during the noise
measurements is an essential requirement. A-weighting is a standard filter used in acoustics
that approximates human hearing and it was introduced as an attempt to assess noise in the
same way that the human ear perceives it (IEC 61672-1, 2013, Talbot-Smith, 1999). The
12
its use, depending on the circumstances, may lead to an underestimation of the annoyance
caused by low-frequency dominant noise (Persson and Bjorkman, 1988). In some cases, this
is the most appropriate weighting filter when investigating the effect of low-level sounds on
mammals since the hearing structures among mammals are similar (Krausman et al., 2004).
According to the selected literature, authors often used A-weighting filter in studies with
birds (Table 1), which is not proven an effective measurement for this group of animals, as
they have a hearing structure different from humans. The C-weighted frequency filter is used
to estimate the human hearing response to loud and transient noise and for peak sound level
analysis (IEC 61672-1, 2013), also it could be appropriately used in the analysis of military
training noises or aircraft noise. This filter is more suitable for higher sound pressure levels
sounds, and it is more sensitive to the lower frequencies of the noise (Howard and Angus,
2009). The papers published that have used this “C” curve filter mostly did experiments using
white noise (Appendix 1), which does not seem to be justified for this kind of noise source.
The impediments of using these human-derived metrics to analyse non-human response will
be discussed throughout the next sub-sections.
When reporting the sound data, it is important to state the time of exposure to noise
that was used in the data collection. The most common ones are the day equivalent level
(Lday) when measurements are made over 12 hours from 7 am to 9 pm using A-weighted
equivalent sound levels, and day-evening-night equivalent level (Lden) when A-weighted
equivalent sound level measurements are made over a 24 hours period. Specific periods of
measurements should also be reported. For example, if the measurements are made during a
period of one hour using A-weighted equivalent sound levels, the sound data should be
13
2.3. Animal groups studied
Almost all papers published regarding the impact of noise on wildlife were focused on a
specific animal group. The majority of these studies were made with birds; possibly, for the
reason that these animals frequently express vocal related behaviours, and, because of that,
they could be more likely to suffer from acoustic interferences, such as acoustic masking that
is considered a major disturbance factor (Brumm, 2004, Nemeth and Brumm, 2009, Rheindt,
2003). The second most studied animal group was mammals, followed by amphibians. There
were no studies found in the literature with reptiles, and fish were not included in this
literature review because of the specificities on the underwater acoustic topics, as previously
mentioned in the introduction.
The aforementioned animal groups have been well evaluated by the analysis of
behavioural and physiological responses (Appendix 1). Behavioural responses were
investigated by changes in vocalisation, behaviour, group structure, reproductive success, use
of habit, and population size (some of the newest studies on these topics: Payne et al. (2012),
Cote et al. (2013), Chen and Koprowski (2015), Derose-Wilson et al. (2015), and LaZerte et
al. (2015)). Physiological responses were assessed by metabolite tests and measurements
involving body condition, body temperature, and cardiac response (some of the newest
studies on these topics: Derose-Wilson et al. (2015), Potvin and MacDougall-Shackleton
(2015), and Ware et al. (2015)). The outcomes of these studies have shown that animals are
often affected by noise (78% of the studies came to this conclusion), showing variations in
common behaviours, vocalization frequencies, body condition, reproductive success, among
others (some of the newest studies: Chen and Koprowski (2015), Derose-Wilson et al. (2015),
Ditmer et al. (2015), LaZerte et al. (2015), and Leonard et al. (2015)).
For humans, annoyance is the adverse attitude, which is formed against sounds that
14
relaxation, and sleep. The annoyance caused by noise depends on acoustical aspects of the
sound but also depends on non-acoustical aspects, including biological, psychological, and
sociological factors (Crocker, 2007, Fidell, 2007). Individual noise sensitivity can explain
variations in noise-annoyance reactions towards a given sound source, as much as noise
exposure measures (Ellermeier et al., 2001). Non-human animals are able to express
individual differences between their behaviours depending on the context – the animal
personality (Dingemanse et al., 2010). This suggests that individual animals may perceive
noise and the annoyance caused by it in different manners, depending on their personality. A
study made with great tits (Parus major) found that animals with different personalities do not express the same behaviours in the presence of noise (Naguib et al., 2013). Some
individuals can be severely impacted by sound pollution while others can be slightly affected
or be able to habituate to it. These variations should be taken into consideration when evaluating animals’ response to noise.
2.4. Are the acoustic metrics used with the animal groups
appropriate to evaluate them?
As discussed previously, A-weighted and C-weighted frequency filters represent the human
hearing response to acoustic signals. Consequently, the use of these metrics is not indicated in
studies with non-human animals. Mammals have a hearing system similar across the group,
especially in the middle ear area, which reflects in a similar threshold at low sound pressure
levels (Fay, 1994). However, the frequency hearing range has a great variation among the
group (Fay, 1994). In fact, several mammal species are capable of hearing frequencies above
that perceived by humans, such as mice, rats, hamsters, rabbits, guinea pigs, dogs, cats, pigs,
and Japanese macaques (Heffner and Heffner, 2007). Thus, the use of the frequency filters
cited before could restrict the assessment of animal responses to sound when studying these
15
a low-frequency sensitivity species, it can cause an underestimation of animal response to this
frequency range because this filter is less sensitive to low-frequency signals. Furthermore,
when studying animals that are sensitive to high frequencies, as an illustration, a mistake can
also happen as the A-weighting filter was defined for a maximum frequency of 20 kHz,
which is equivalent to the upper limit of the human frequency hearing and cannot express the
actual response to higher frequencies.
Although there are limitations in the use of the frequency filters as previously
mentioned, these metrics are being widely applied in amphibian, bird, and mammal studies
(Table 1). It is unlikely that these filters work with these animal groups since their hearing
systems are different from humans. Birds, for example, have a different frequency perception.
The frequency range within avian species is narrower than in mammals (Beason, 2004,
Sturkie, 1986), which suggests a mistake in using the same acoustic metrics when studying
both groups. Using this method could cause the results to contain some frequencies, which
are not perceived by birds and are perceived by humans, and could, therefore, cause
misinterpretation of the data. There are no studies with amphibians that have analysed the
frequency range heard by this group; however, if the frequency range of their vocalisation
(between 0.5-9 kHz) is considered (Hanna et al., 2014, Parris et al., 2009, Sun and Narins,
2005), which is also narrower than humans, as a rule of thumb it can be assumed that they
can hear the frequencies of their vocalisations, so it can be accepted that the same mistake
16
Table 1. Comparison of the weighting frequency filter according to the animal group (percentage of studies found in the literature; N = 112)
Groups ND1 Z2 A3 C4 SS5
Amphibians (%) 18 18 27 37 0
Birds (%) 15 17 58 14 4
Mammals (%) 43 19 38 5 5
1 not described. 2 Z-weighted filter (including flat, linear, and unweighted). 3 A-weighted filter. 4 C-weighted
filter. 5 Species-specific weighted filter. The exceed 100% in some cases, is due to the use of more than one
filter in the same study.
Seeking a better understanding of animal response to noise, authors have developed
species-specific weightings for some species, such as Mexican spotted owls (Strix occidentalis lucida) (Delaney et al., 1999), red-cockaded woodpeckers (Picoides borealis) (Delaney et al., 2011), and Sonoran pronghorn (Antilocapra americana sonoriensis) (Krausman et al., 2004), which is an adequate solution to ideally assess the animal’s perception and reaction to noise.
The species-specific weighting can be created based on audiograms. The aim of the
audiograms is to understand, correctly, which frequency range and sound amplitudes the
species respond to in terms of noise. There are numerous wildlife species audiograms in the
literature, which could help to develop these specific weightings (Table 2). However, it will
not be possible to produce an audiogram of all species to develop the species-specific
weightings, due to the endangered status of some species or for ethical reasons to manipulate
the animals (it is usually necessary to maintain animals in captivity to produce audiograms;
Heffner and Heffner (2007)). In these cases, an alternative could be the use of Z-weighting
filters. This metric includes all frequencies in the range of the sound level meter, not
including any weighting in any frequency (IEC 61672-1, 2013). The Z-weighting filter was
yielded to represent a flat response between 8 Hz and 20 kHz, so it is still not a good tool
17
Table 2. Wildlife species audiograms found in the literature.
Animal (scientific name) Reference
Hedgehog (Hemiechinus auritus) Ravizza et al. (1969)
Primates (Pan troglodytes) (Macaca fascicularis) (Macaca nemestrina) (Galago senegalensis) (Nycticebus coucang) (Perodicticus potto) (Lemur catta) (Aotus trivirgatus) (Saimiri sciureus) (Macaca mulatta) (Papio cynocephalus) (Cercopithecus mitis) (Cercopithecus aethiops) (Cercopithecus neglectus) (Macaca fuscata)
Elder (1934) and Kojima (1990)
Stebbins et al. (1966) Stebbins et al. (1966)
Heffner et al. (1969)
Heffner and Masterton (1970)
Heffner and Masterton (1970)
Gillette et al. (1973) Beecher (1974a)
Beecher (1974b) and Green (1975)
Pfingst et al. (1975), Pfingst et al. (1978), Lonsbury-Martin and Martin (1981), and Bennett et al. (1983)
Hienz et al. (1982)
Brown and Waser (1984) Owren et al. (1988)
Owren et al. (1988)
Owren et al. (1988) and Jackson et al. (1999)
Racoon (Procyon lotor) Wollack (1965)
Weasel (Mustela nivalis) Heffner and Heffner (1985)
Reindeer (Rangifer tarandus) Flydal et al. (2001)
2.5. Authors’ expertise
In the literature, most published papers about the influence of noise on wildlife were
published by authors associated with biological-related areas (according to the authors’
contact address in the papers). Biological-related authors wrote more than 84% of the papers,
and authors with multidisciplinary expertise areas published only 11% of the studies. Sound
analysis involves a specific knowledge that is not commonly covered in biological courses.
Thus, it is important to include professionals with particular skills in the area to improve the
methods and to achieve high-quality results.
The improvement that partnership between different study areas brings to the studies
is visible. Papers published by authors of multidisciplinary areas are often more descriptive
regarding the methodologies applied (see Tables 2, 3, and 4). Some studies found in the
18
wildlife and some did not mention which device was used to measure the noise. This lack of
information reduces the applicability of the results because they cannot be compared or
reproduced correctly. Confidence of the results is of major importance for science, and the
reproducibility is a current concern by researchers (Baker, 2016) since it is an important way
to achieve confidence in results. Another important information that is often omitted in
studies is the mention of the calibration of the equipment. As discussed before, sound
measurement equipment, such as sound level meters, need to be calibrated before and after
every measurement, which can influence the quality of the data produced. The absence of
routine when checking the equipment calibration could lead to inaccurate and unreliable
measurement data (Beyers, 2014). Concerning these topics, there are clear dissimilarities
between papers produced by authors with only biological expertise and papers produced by
multidisciplinary expertise authors (Table 3 and 4) with the latter producing more
scientifically robust results.
Table 3. Comparison of the use of equipment by authors’ expertise (percentage of studies found in the literature; N = 108)
Authors expertise NA1 ND2 NM3 OT4
Biological (%) 20 3 62 15
Multidisciplinary (%) 0 0 78 22
1 subjective evaluation of noise. 2 not described. 3 use of noise meters. 4 use of another kind of equipment and/or
software to measure noise.
Table 4. Comparison of the noise measurement equipment calibration by authors’ expertise (percentage of studies found in the literature; N = 79)
Authors expertise YES1 ND2
Biological (%) 7 93
Multidisciplinary (%) 75 25
1 authors have mentioned the calibration of the noise measurement equipment. 2 authors have not mentioned the
calibration of the noise measurement equipment.
The same pattern of variation in methodology can also be seen when evaluating the