comment
reviews
reports
deposited research
interactions
information
refereed research
MAPPFinder: using Gene Ontology and GenMAPP to create a
global gene-expression profile from microarray data
Scott W Doniger*, Nathan Salomonis*, Kam D Dahlquist*
†
, Karen
Vranizan*
‡
, Steven C Lawlor* and Bruce R Conklin*
†§
Addresses: *Gladstone Institute of Cardiovascular Disease, University of California, San Francisco, CA 94141-9100, USA. †Cardiovascular Research Institute, and §Departments of Medicine and Cellular and Molecular Pharmacology, University of California, San Francisco, CA 94143, USA. ‡Functional Genomics Lab, University of California, Berkeley, CA 94720, USA.
Correspondence: Bruce R Conklin. E-mail: [email protected]
Abstract
MAPPFinder is a tool that creates a global gene-expression profile across all areas of biology by integrating the annotations of the Gene Ontology (GO) Project with the free software package GenMAPP (http://www.GenMAPP.org). The results are displayed in a searchable browser, allowing the user to rapidly identify GO terms with over-represented numbers of gene-expression changes. Clicking on GO terms generates GenMAPP graphical files where gene relationships can be explored, annotated, and files can be freely exchanged.
Published: 6 January 2003 GenomeBiology2003, 4:R7
The electronic version of this article is the complete one and can be found online at http://genomebiology.com/2003/4/1/R7
Received: 11 September 2002 Revised: 8 October 2002 Accepted: 8 November 2002
Background
DNA microarray experiments simultaneously measure the expression levels of thousands of genes, generating huge amounts of data. The analysis of these data presents a tremendous challenge to biologists and new tools are needed to help gain biological insights from these experiments. Although the data are generated for individual genes, exam-ining a dataset on a gene-by-gene basis is time consuming and difficult to carry out across an entire dataset. One way of accelerating the pace of data analysis is to approach the data from a higher level of organization. This can be done using data-driven methods, such as hierarchical clustering and self-organizing maps [1,2], which identify groups of genes with similar expression patterns. A complementary approach is to view the data at the level of known biological processes or pathways. Identifying those groups of biologically related genes that are showing a large number of gene-expression changes will create an informative description of the biology that is occurring in a particular dataset, making it possible to generate new hypotheses and identify those specific areas of biology that warrant more detailed investigation.
One tool that assists in the identification of important bio-logical processes is GenMAPP (Gene MicroArray Pathway Profiler) [3], a program for viewing and analyzing microar-ray data on microarmicroar-ray pathway profiles (MAPPs) represent-ing biological pathways or any other functional grouprepresent-ing of genes. When a MAPP is linked to a gene-expression dataset, GenMAPP automatically and dynamically color codes the genes on the MAPP according to criteria supplied by the user. GenMAPP is a useful starting point for pathway-based analysis of gene-expression data, but there are several criti-cal requirements to be met before this tool can be used to identify correlated gene-expression changes across all biology. On a practical level, pathway-based analysis of microarray data needs to be automated, so that all possible pathways can be explored. Identifying correlated gene-expression changes in an individual pathway is often inter-esting, but it is necessary to know if the gene-expression changes seen on a particular pathway are unique to this pathway or are occurring in many other pathways. Equally important to automation is expanding the pathway informa-tion that is digitally represented. GenMAPP currently has
over 50 MAPP files depicting various biological pathways and gene families, but this is still only a small fraction of all known biology [3]. Several other pathway programs such as KEGG [4], EcoCyc/MetaCyc [5], Pathway Processor (which uses KEGG) [6] and ViMAc [7] are available for integration with microarray data analysis, but these programs focus on well-defined metabolic pathways, and like GenMAPP, would benefit from a broader base of pathway information.
To address this issue, we have used information available from the Gene Ontology (GO) Consortium [8]. The GO Con-sortium is creating a defined vocabulary of terms describing the biological processes, cellular components and molecular functions of all genes. The GO is built in a hierarchical manner, with a parent-child relationship existing between GO terms. Curators at the public gene databases are assign-ing genes to GO terms to provide annotation and a biological context for individual genes. In addition to providing gene annotation, GO also provides a structure for organizing genes into biologically relevant groupings. These groupings can serve as the basis for identifying those areas of biology showing correlated gene-expression changes in a microarray experiment. While GO has been used to annotate microarray data both by hand and by some software packages [9-11], there has been no automated way to use it for pathway-based analysis.
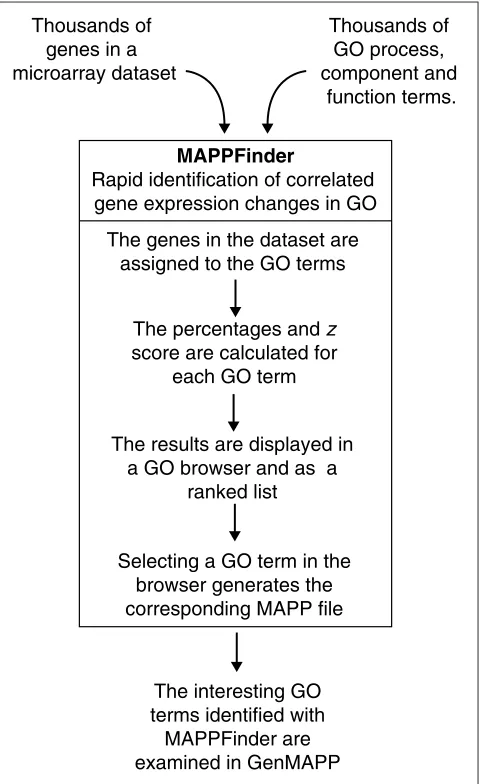
We have developed a tool called MAPPFinder that dynami-cally links gene-expression data to the GO hierarchy. For each of the 11,239 ([12]; as of May 6, 2002]) GO biological process, cellular component and molecular function terms, MAPPFinder calculates the percentage of the genes mea-sured that meet a user-defined criterion. This is done for each specific GO node, and for the cumulative total of the number of genes meeting the criterion in a parent GO term combined with all of its children, giving a complete picture of the number of genes associated with a particular GO term. Using this percentage and a z score (see Materials and methods), the user can rank the GO terms by their relative amounts of gene-expression changes. MAPPFinder therefore generates a gene-expression profile at the level of biological processes, cellular components and molecular functions, rapidly identifying those areas of biology that warrant further study (Figure 1).
MAPPFinder and GenMAPP are both available free-of-charge at [13].
Results and discussion
To demonstrate the utility of MAPPFinder, we used the program to analyze the publicly available mouse microarray dataset, the FVB benchmark set for cardiac development, maturation and aging [14]. This dataset measures gene-expression levels in the hearts of 12.5-day embryos and adult mice. We have used the 12.5-day embryonic time point to
[image:2.609.315.555.87.479.2]identify those biological processes that show differentially expressed genes between embryonic and adult hearts. We ran the MAPPFinder analysis on this dataset using two crite-ria, either an increase (fold change > 1.2 and p< 0.05) or decrease (fold change < -1.2 and p< 0.05) in gene expres-sion for the 12.5-day embryo. We chose this dataset for demonstration because of the large number of differences in gene expression observed in the 12.5-day embryo compared to the adult mouse heart tissue.
Figure 1
How MAPPFinder works. Microarray data is imported into MAPPFinder as a GenMAPP gene-expression dataset. Using a relational database and the gene-association files from GO, MAPPFinder assigns the thousands of genes in the dataset to the thousands of GO terms. Using a user-defined criterion for a significant gene-expression change, MAPPFinder calculates the percentage of genes meeting the criterion and a statistical score for each GO term. Using the ranked list and GO browser generated by MAPPFinder the user can quickly identify interesting GO terms with high levels of gene-expression changes. The specific genes involved in these GO terms can be examined on automatically generated MAPPs using GenMAPP.
Thousands of genes in a microarray dataset
Thousands of GO process, component and
function terms.
The percentages and
z
score are calculated foreach GO term
The results are displayed in a GO browser and as a
ranked list
The interesting GO terms identified with MAPPFinder are examined in GenMAPP The genes in the dataset are
assigned to the GO terms
MAPPFinder
Rapid identification of correlated gene expression changes in GO
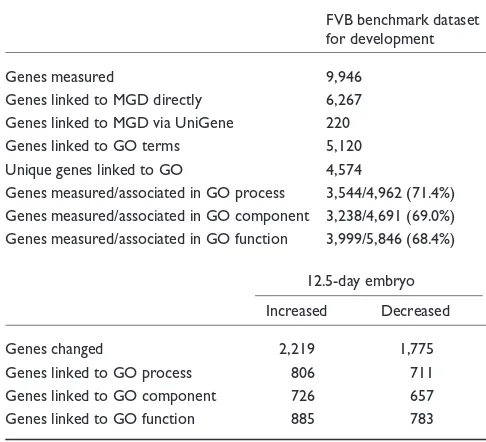
MAPPFinder linked the 9,946 probe sets measured in this experiment to the 11,239 GO terms [12] in the hierarchy and calculated the percentage of genes meeting the criterion and a z score for each GO term. Table 1 gives an overall summary of the linkages made between the dataset and GO and calculations carried out by MAPPFinder. Nearly half of the 9,946 probe sets measured in the FVB benchmark dataset were connected to a GO term, representing approxi-mately 70% of the mouse genes associated with GO terms [15] and covering a good portion of what is currently known about mouse biology. The proportion of genes in the microarray dataset that link to GO terms will increase as more GO terms and gene associations are added by the Mouse Genome Database (MGD) [16].
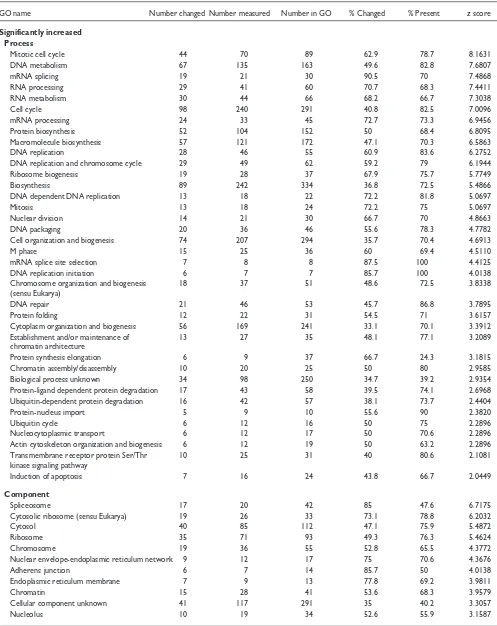
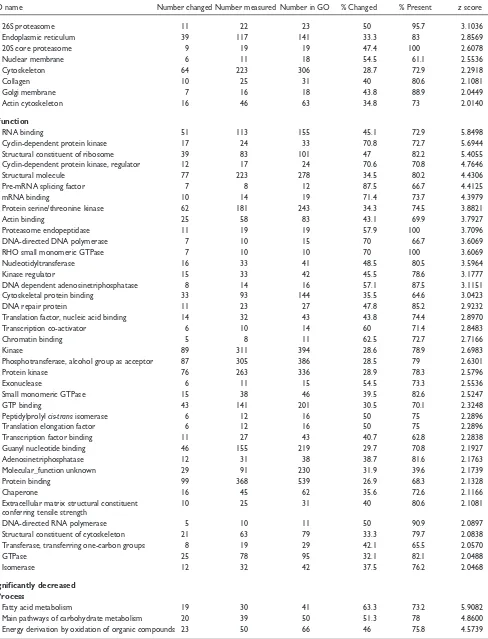
After MAPPFinder assigns the genes in the microarray dataset to the GO structure, it calculates for each GO term the percentage and zscore (see Materials and methods) for the genes that meet the user’s criterion. These two values can be used to identify GO terms with an over- (or under-) represented number of gene-expression changes. The MAPPFinder results are displayed in two forms. The first is a GO browser that graphically displays the MAPPFinder results in the structure of the GO hierarchy (Figures 2a,3a). The second is a text file listing all the GO terms measured, ranked by the zscore. The number of genes meeting the cri-terion, the number of genes measured in the experiment, and the number of genes assigned to each GO term by MGD are given, along with the respective percentages and zscore, in the text file and GO browser (Figure 2b). Table 2 shows the list of process, component and function terms with a z score greater than 2 for the significantly increased and decreased criteria at the 12.5-day embryonic time point. GO terms that had fewer than 5 or more than 100 genes changed were removed from the list because these terms were either too specific or too general for our data analysis. This filter identified the top 108 (8.0%) GO terms for the significantly increased criterion and the top 63 (4.8%) GO terms for the significantly decreased criterion. The stringency of this filter can be increased or decreased by raising or lowering thez score cutoff, or by including terms with larger or smaller numbers of genes. The filtered list was then pruned by hand for related GO terms to remove any over-represented branches of the GO hierarchy (for the complete results, see Additional data files). When both a parent and a child term were present in the list, the parent term was removed if its presence was due entirely to genes meeting the criterion for the child term. The remaining terms on the list still have a large degree of interrelatedness, but have been retained here for completeness.
The MAPPFinder results present a global picture of the bio-logical processes, cellular components and molecular func-tions that are increased and decreased in the 12.5-day embryo compared with the adult mouse (Table 2). Using the criterion for a significantly increased gene-expression change,
MAPPFinder primarily identified GO terms involved in cell division and growth. Notable GO terms include the processes ‘mitotic cell cycle’ (62.9% of 70 genes,z score of 8.1), ‘mRNA splicing’ (90.5% of 21 genes, z score of 7.5), and ‘protein biosynthesis’ (50% of 104 genes, z score of 6.8). The top-ranked component and function terms reflected the same bio-logical processes. For example, the component term ‘spliceosome’ shows that 17 out of 20 genes (85%,z score of 6.7) were upregulated. The upregulation of these processes is consistent with the fact that cardiomyocytes remain mitoti-cally active throughout embryonic development [17]. Apart from processes involved in cell division and growth, the MAPPFinder results indicate that the processes ‘transmem-brane receptor protein serine/threonine kinase signaling pathway’ and ‘induction of apoptosis’ are upregulated, with a z score of approximately 2. The presence of the term ‘trans-membrane receptor protein serine/threonine kinase signaling pathway’ is due to the upregulation of genes involved in trans-forming growth factor-(TGF) receptor signaling, which is thought to regulate the induction of apoptosis required for morphogenesis during heart development [18,19].
comment
reviews
reports
deposited research
interactions
information
[image:3.609.311.554.119.340.2]refereed research
Table 1
Numbers of genes used in the MAPPFinder calculations
FVB benchmark dataset for development
Genes measured 9,946
Genes linked to MGD directly 6,267 Genes linked to MGD via UniGene 220 Genes linked to GO terms 5,120 Unique genes linked to GO 4,574
Genes measured/associated in GO process 3,544/4,962 (71.4%) Genes measured/associated in GO component 3,238/4,691 (69.0%) Genes measured/associated in GO function 3,999/5,846 (68.4%)
12.5-day embryo Increased Decreased
Genes changed 2,219 1,775
Genes linked to GO process 806 711
Genes linked to GO component 726 657 Genes linked to GO function 885 783 Of the 9,946 genes measured by this array, 6,267 were linked to the MGD database via the GenBank accession numbers referenced by MGD. An additional 220 genes were linked to MGD using UniGene as an intermediate step (see Materials and methods). Of these 6,487 genes, 5,120 were found in the mouse GO gene-association files. Once duplicate probes were removed, 4,574 unique genes were used for the
Genes involved in energy metabolism showed the highest levels of downregulation in the 12.5-day embryo heart versus the adult heart. In particular, the process terms ‘fatty acid metabolism’ (63.3% of 30 genes,z score of 5.9) and ‘main
[image:4.609.54.557.85.568.2]pathways of carbohydrate metabolism’ (51.3% of 39 genes,z score 4.8), which is the parent of the terms ‘glycolysis’ and ‘tricarboxylic acid cycle’, indicate that metabolic genes as a whole are downregulated in an embryo when compared to Figure 2
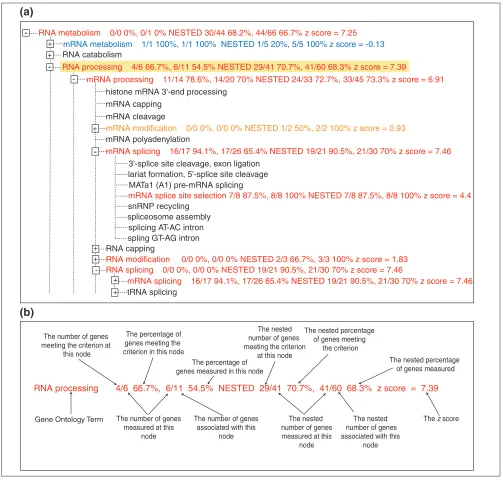
The MAPPFinder browser. (a)The branch of the GO hierarchy rooted at the biological process term ‘RNA processing’ is shown. The terms are colored with the MAPPFinder results for genes significantly increased in the 12.5-day embryo versus the adult mice. Terms with 0-5% of genes changed are colored black, 5-15% purple, 15-25% dark blue, 25-35% light blue, 35-45% green, 45-55% orange, and greater than 55% red. The term RNA processing is highlighted in yellow, indicating that it meets the search or filter requirements. (b)The MAPPFinder results. The term RNA processing is shown with the various MAPPFinder results labeled. The percentage of genes meeting the criterion and the percentage of genes in GO measured in this experiment are calculated. The results are calculated for both this node individually and in combination with all of its child nodes (that is, nested results). Thez score indicates whether the number of genes meeting the criterion is higher or lower than expected. A positive score indicates that more genes are changed than expected; a negative score means fewer genes are changed than expected, and a score near 0 indicates that the number of changes approximates to the expected value for that GO term.
-mRNA modification 0/0 0%, 0/0 0% NESTED 1/2 50%, 2/2 100% z score = 0.93 histone mRNA 3'-end processing
mRNA processing 11/14 78.6%, 14/20 70% NESTED 24/33 72.7%, 33/45 73.3% z score = 6.91 RNA processing 4/6 66.7%, 6/11 54.5% NESTED 29/41 70.7%, 41/60 68.3% z score = 7.39
mRNA splicing 16/17 94.1%, 17/26 65.4% NESTED 19/21 90.5%, 21/30 70% z score = 7.46
-+
3'-splice site cleavage, exon ligation lariat formation, 5'-splice site cleavage RNA catabolism
mRNA metabolism 1/1 100%, 1/1 100% NESTED 1/5 20%, 5/5 100% z score = -0.13
+
RNA metabolism 0/0 0%, 0/1 0% NESTED 30/44 68.2%, 44/66 66.7% z score = 7.25
-RNA processing 4/6 66.7%, 6/11 54.5% NESTED 29/41 70.7%, 41/60 68.3% z score = 7.39
Gene Ontology Term The number of genes meeting the criterion at
this node
The number of genes measured at this
node The percentage of genes meeting the criterion in this node
The percentage of genes measured in this node
The number of genes associated with this
node
The nested number of genes meeting the criterion
at this node
The nested number of genes measured at this
node
The nested number of genes associated with this
node The nested percentage
of genes meeting the criterion
The nested percentage of genes measured
The z score +
mRNA capping mRNA cleavage
mRNA polyadenylation
MATa1 (A1) pre-mRNA splicing
mRNA splice site selection 7/8 87.5%, 8/8 100% NESTED 7/8 87.5%, 8/8 100% z score = 4.4
snRNP recycling spliceosome assembly splicing AT-AC intron spling GT-AG intron RNA capping
RNA modification 0/0 0%, 0/0 0% NESTED 2/3 66.7%, 3/3 100% z score = 1.83 RNA splicing 0/0 0%, 0/0 0% NESTED 19/21 90.5%, 21/30 70% z score = 7.46
tRNA splicing
mRNA splicing 16/17 94.1%, 17/26 65.4% NESTED 19/21 90.5%, 21/30 70% z score = 7.46 +
+
-+
+
(a)
an adult mouse. In addition, the component term ‘mitochon-drion’ shows that 88 out of 187 genes (47.1%,z score of 9.1) are downregulated. The downregulation of genes involved in fatty-acid metabolism is consistent with research that has shown that the developing heart, unlike the adult heart, does not derive its energy from fatty acids [20].
Overall, the MAPPFinder results provide a global perspec-tive of the processes that are up- and down-regulated in the 12.5-day embryonic heart compared to an adult heart. The results confirmed what was expected: when compared to the adult heart, the embryonic heart is undergoing increased cell division and growth and has decreased energy metabolism. In addition, the global gene-expression profile presented by MAPPFinder allows the gene-expression changes observed for cell division and growth and energy metabolism to be put in the context of other regulatory and developmental processes such as TGFsignaling and apoptosis.
The MAPPFinder browser
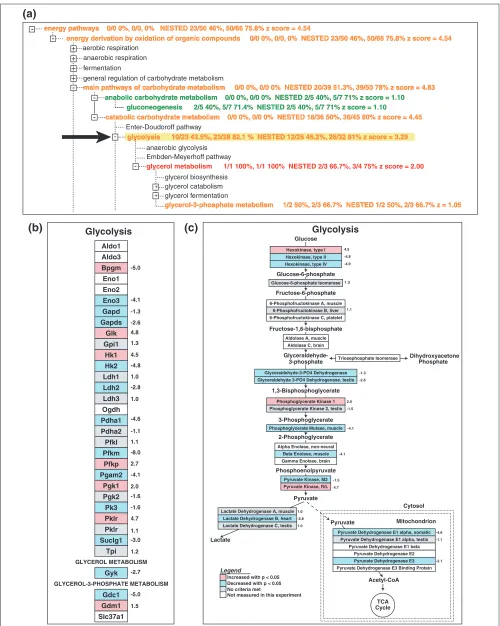
Viewing the MAPPFinder results as a ranked list is informa-tive, but it does not take full advantage of the fact that GO is arranged in a hierarchy. MAPPFinder also presents the results in the context of the GO hierarchy (Figures 2a,3a) showing the entire hierarchy, color-coded by the percentage of genes changed. Users can step through the hierarchy, expanding those branches of the tree that are showing gene expression changes, moving from broad terms to more spe-cific categories. Often the ranked list of terms will show many interrelated terms, and it is necessary to view the results in the hierarchy to identify the relationships among them. For example, the terms ‘RNA metabolism’, ‘RNA processing’, ‘mRNA processing’, and ‘mRNA splicing’ appear as upregu-lated in Table 2. However, the tree view (Figure 2a) clearly shows that mRNA splicing is a child term of both RNA splic-ing and mRNA processsplic-ing, which are in turn child terms of RNA metabolism. Similarly, the terms ‘main pathways of car-bohydrate metabolism’, ‘catabolic carcar-bohydrate metabolism’, and ‘glycolysis’ also appear as downregulated in Table 2. The MAPPFinder browser (Figure 3a) shows that ‘glycolysis’ is related to ‘main pathways of carboyhydrate metabolism’ through the hierarchical relationship between these terms.
The MAPPFinder browser also provides three search and nav-igation functions. First, the user can search by a keyword or an exact GO term name. Second, the user can search by a gene identifier to find which GO term(s) the gene is associated
with. For example, searching for the gene alpha-myosin heavy chain using its SWISS-PROT identifier MYH6_MOUSE or its MGD identifier MGI:97255 finds the GO process terms ‘striated muscle contraction’, ‘cytoskele-ton organization and biogenesis’, ‘protein modification’, and ‘muscle development’. Third, the user can expand the GO tree automatically to show all nodes with a minimum number of genes or minimum percentage of genes meeting the criterion or with a minimumz score. The terms meeting the filter are highlighted in yellow to clearly indicate the results of the search.
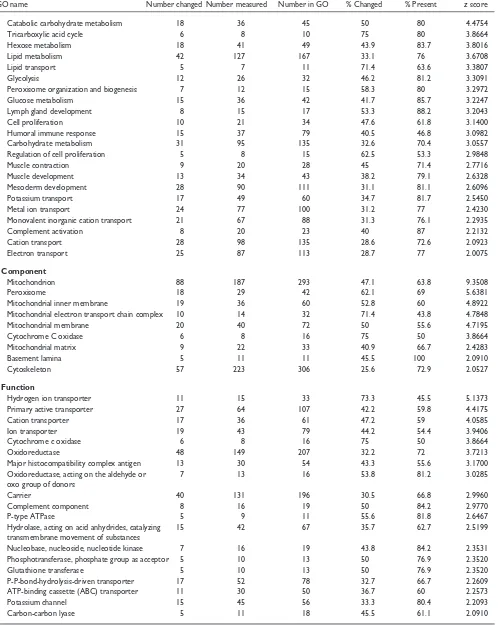
Once the GO terms of interest have been identified with MAPPFinder, the user will want to know exactly which genes are associated with these terms and exactly which genes are being differentially expressed. This can be accomplished using GenMAPP. Selecting a GO term in the MAPPFinder browser automatically builds a MAPP containing the genes associated with that GO term and all of its children, and opens this MAPP in GenMAPP. Figure 3b shows the MAPP generated by selecting the GO term ‘glycolysis’ in the MAPPFinder browser. The genes on the MAPP are color-coded with the same criteria used to calculate the MAPPFinder results, significantly increased and decreased at the 12.5-day embryo time point. Clicking on a gene on the MAPP opens a ‘back page’ containing annotations, gene-expression data and hyperlinks to that gene’s page in the public databases. By integrating GenMAPP and MAPPFinder, it is possible to seamlessly move from a global gene-expres-sion profile at the level of all biological processes, compo-nents and functions to a detailed description of the gene-expression levels for the specific genes involved. For example, a closer examination of the glycolysis MAPP indi-cates that hexokinase I is upregulated in the 12.5-day embryo and isoforms II and IV are downregulated, as compared with the adult heart. This is consistent with hexokinase I being the predominant isoform in the embryonic heart [21].
Expanding MAPPFinder beyond GO
GO is a good starting point for analyzing microarray data in the context of biological pathways, but this is by no means the only way to group related genes. Instead of representing each GO process as an alphabetical list on a MAPP, it would be more useful to represent the relationships between these genes as a fully delineated pathway. As a start in this direction, GenMAPP.org [13] has created over 50 MAPPs depicting metabolic pathways, signaling pathways and gene families.
comment
reviews
reports
deposited research
interactions
information
refereed research
Figure 3(see figure on the next page)
Figure 3 (see legend on the previous page)
energy derivation by oxidation of organic compounds 0/0 0%, 0/0, 0% NESTED 23/50 46%, 50/66 75.8% z score = 4.54 energy derivation by oxidation of organic compounds 0/0 0%, 0/0, 0% NESTED 23/50 46%, 50/66 75.8% z score = 4.54
glycolysis 10/23 43.5%, 23/28 82.1 % NESTED 12/26 46.2%, 26/32 81% z score = 3.29 glycolysis 10/23 43.5%, 23/28 82.1 % NESTED 12/26 46.2%, 26/32 81% z score = 3.29
Enter-Doudoroff pathway
catabolic carbohydrate metabolism 0/0 0%, 0/0 0% NESTED 18/36 50%, 36/45 80% z score = 4.45 catabolic carbohydrate metabolism 0/0 0%, 0/0 0% NESTED 18/36 50%, 36/45 80% z score = 4.45
gluconeogenesis 2/5 40%, 5/7 71.4% NESTED 2/5 40%, 5/7 71% z score = 1.10 gluconeogenesis 2/5 40%, 5/7 71.4% NESTED 2/5 40%, 5/7 71% z score = 1.10 anabolic carbohydrate metabolism 0/0 0%, 0/0 0% NESTED 2/5 40%, 5/7 71% z score = 1.10 anabolic carbohydrate metabolism 0/0 0%, 0/0 0% NESTED 2/5 40%, 5/7 71% z score = 1.10 main pathways of carbohydrate metabolism 0/0 0%, 0/0 0% NESTED 20/39 51.3%, 39/50 78% z score = 4.83 main pathways of carbohydrate metabolism 0/0 0%, 0/0 0% NESTED 20/39 51.3%, 39/50 78% z score = 4.83
anaerobic glycolysis Embden-Meyerhoff pathway
glycerol metabolism 1/1 100%, 1/1 100% NESTED 2/3 66.7%, 3/4 75% z score = 2.00
glycerol biosynthesis glycerol catabolism glycerol fermentation
glycerol-3-phosphate metabolism 1/2 50%, 2/3 66.7% NESTED 1/2 50%, 2/3 66.7% z = 1.05 glycerol-3-phosphate metabolism 1/2 50%, 2/3 66.7% NESTED 1/2 50%, 2/3 66.7% z = 1.05 energy pathways 0/0 0%, 0/0, 0% NESTED 23/50 46%, 50/66 75.8% z score = 4.54
energy pathways 0/0 0%, 0/0, 0% NESTED 23/50 46%, 50/66 75.8% z score = 4.54
-+ + + + -aerobic respiration anaerobic respiration fermentation
general regulation of carbohydrate metabolism
-+ + Aldo1 Aldo3 Bpgm Eno1 Eno2 Eno3 Gapd Gapds -2.6 Glk Gpi1 Hk1 Hk2 Ldh1 Ldh2 Ldh3 Ogdh Pdha1 Pdha2 Pfkl Pfkm Pfkp Pgam2 Pgk1 Pgk2 Pk3 Pklr Pklr Suclg1 Tpi GLYCEROL METABOLISM Gyk GLYCEROL-3-PHOSPHATE METABOLISM Gdc1 Gdm1 Slc37a1 Glycolysis Glycolysis 3-Phosphoglycerate 2-Phosphoglycerate Lactate Fructose-1,6-bisphosphate Glucose-6-phosphate 1,3-Bisphosphoglycerate Phosphoenolpyruvate 3-phosphate TCA Phosphoglycerate Kinase 2, testis -1.5
Phosphoglycerate Kinase 1 2.0
6-Phosphofructokinase B, liver
Glyceraldehyde-3-PO4 Dehydrogenase -1.3
Glyceraldehyde 3-PO4 Dehydrogenase, testis -2.6
Phosphoglycerate Mutase, muscle -4.1
Beta Enolase, muscle -4.1
Pyruvate Kinase, M2 Pyruvate Kinase, R/L
Lactate Dehydrogenase A, muscle1.0
Lactate Dehydrogenase B, heart -2.8
Lactate Dehydrogenase C, testis 1.0
Pyruvate Dehydrogenase E1 alpha, somatic -4.6
Pyruvate Dehydrogenase E1 alpha, testis -1.1
Hexokinase, type IV
Pyruvate Dehydrogenase E3 -2.1
Fructose-6-phosphate Glyceraldehyde- Dihydroxyacetone Phosphate Cycle Acetyl-CoA Glucose
Hexokinase, type I Hexokinase, type II
Pyruvate
Pyruvate
Cytosol
Mitochondrion Alpha Enolase, non-neural
Gamma Enolase, brain
Triosephosphate Isomerase
Pyruvate Dehydrogenase E1 beta Pyruvate Dehydrogenase E2
Pyruvate Dehydrogenase E3 Binding Protein Aldolase A, muscle
Aldolase C, brain 6-Phosphofructokinase A, muscle
6-Phosphofructokinase C, platelet Glucose-6-phosphate Isomerase
Legend
Increased with p < 0.05 Decreased with p < 0.05 No criteria met
comment
reviews
reports
deposited research
interactions
information
[image:7.609.57.554.115.741.2]refereed research
Table 2
MAPPFinder results for genes significantly increased and significantly decreased in 12.5-day embryos versus adult mice
GO name Number changed Number measured Number in GO % Changed % Present zscore
Significantly increased Process
Mitotic cell cycle 44 70 89 62.9 78.7 8.1631
DNA metabolism 67 135 163 49.6 82.8 7.6807
mRNA splicing 19 21 30 90.5 70 7.4868
RNA processing 29 41 60 70.7 68.3 7.4411
RNA metabolism 30 44 66 68.2 66.7 7.3038
Cell cycle 98 240 291 40.8 82.5 7.0096
mRNA processing 24 33 45 72.7 73.3 6.9456
Protein biosynthesis 52 104 152 50 68.4 6.8095
Macromolecule biosynthesis 57 121 172 47.1 70.3 6.5863
DNA replication 28 46 55 60.9 83.6 6.2752
DNA replication and chromosome cycle 29 49 62 59.2 79 6.1944
Ribosome biogenesis 19 28 37 67.9 75.7 5.7749
Biosynthesis 89 242 334 36.8 72.5 5.4866
DNA dependent DNA replication 13 18 22 72.2 81.8 5.0697
Mitosis 13 18 24 72.2 75 5.0697
Nuclear division 14 21 30 66.7 70 4.8663
DNA packaging 20 36 46 55.6 78.3 4.7782
Cell organization and biogenesis 74 207 294 35.7 70.4 4.6913
M phase 15 25 36 60 69.4 4.5110
mRNA splice site selection 7 8 8 87.5 100 4.4125
DNA replication initiation 6 7 7 85.7 100 4.0138
Chromosome organization and biogenesis 18 37 51 48.6 72.5 3.8338
(sensu Eukarya)
DNA repair 21 46 53 45.7 86.8 3.7895
Protein folding 12 22 31 54.5 71 3.6157
Cytoplasm organization and biogenesis 56 169 241 33.1 70.1 3.3912
Establishment and/or maintenance of 13 27 35 48.1 77.1 3.2089
chromatin architecture
Protein synthesis elongation 6 9 37 66.7 24.3 3.1815
Chromatin assembly/disassembly 10 20 25 50 80 2.9585
Biological process unknown 34 98 250 34.7 39.2 2.9354
Protein-ligand dependent protein degradation 17 43 58 39.5 74.1 2.6968
Ubiquitin-dependent protein degradation 16 42 57 38.1 73.7 2.4404
Protein-nucleus import 5 9 10 55.6 90 2.3820
Ubiquitin cycle 6 12 16 50 75 2.2896
Nucleocytoplasmic transport 6 12 17 50 70.6 2.2896
Actin cytoskeleton organization and biogenesis 6 12 19 50 63.2 2.2896
Transmembrane receptor protein Ser/Thr 10 25 31 40 80.6 2.1081
kinase signaling pathway
Induction of apoptosis 7 16 24 43.8 66.7 2.0449
Component
Spliceosome 17 20 42 85 47.6 6.7175
Cytosolic ribosome (sensu Eukarya) 19 26 33 73.1 78.8 6.2032
Cytosol 40 85 112 47.1 75.9 5.4872
Ribosome 35 71 93 49.3 76.3 5.4624
Chromosome 19 36 55 52.8 65.5 4.3772
Nuclear envelope-endoplasmic reticulum network 9 12 17 75 70.6 4.3676
Adherens junction 6 7 14 85.7 50 4.0138
Endoplasmic reticulum membrane 7 9 13 77.8 69.2 3.9811
Chromatin 15 28 41 53.6 68.3 3.9579
Cellular component unknown 41 117 291 35 40.2 3.3057
Table 2(continued)
GO name Number changed Number measured Number in GO % Changed % Present zscore
26S proteasome 11 22 23 50 95.7 3.1036
Endoplasmic reticulum 39 117 141 33.3 83 2.8569
20S core proteasome 9 19 19 47.4 100 2.6078
Nuclear membrane 6 11 18 54.5 61.1 2.5536
Cytoskeleton 64 223 306 28.7 72.9 2.2918
Collagen 10 25 31 40 80.6 2.1081
Golgi membrane 7 16 18 43.8 88.9 2.0449
Actin cytoskeleton 16 46 63 34.8 73 2.0140
Function
RNA binding 51 113 155 45.1 72.9 5.8498
Cyclin-dependent protein kinase 17 24 33 70.8 72.7 5.6944
Structural constituent of ribosome 39 83 101 47 82.2 5.4055
Cyclin-dependent protein kinase, regulator 12 17 24 70.6 70.8 4.7646
Structural molecule 77 223 278 34.5 80.2 4.4306
Pre-mRNA splicing factor 7 8 12 87.5 66.7 4.4125
mRNA binding 10 14 19 71.4 73.7 4.3979
Protein serine/threonine kinase 62 181 243 34.3 74.5 3.8821
Actin binding 25 58 83 43.1 69.9 3.7927
Proteasome endopeptidase 11 19 19 57.9 100 3.7096
DNA-directed DNA polymerase 7 10 15 70 66.7 3.6069
RHO small monomeric GTPase 7 10 10 70 100 3.6069
Nucleotidyltransferase 16 33 41 48.5 80.5 3.5964
Kinase regulator 15 33 42 45.5 78.6 3.1777
DNA dependent adenosinetriphosphatase 8 14 16 57.1 87.5 3.1151
Cytoskeletal protein binding 33 93 144 35.5 64.6 3.0423
DNA repair protein 11 23 27 47.8 85.2 2.9232
Translation factor, nucleic acid binding 14 32 43 43.8 74.4 2.8970
Transcription co-activator 6 10 14 60 71.4 2.8483
Chromatin binding 5 8 11 62.5 72.7 2.7166
Kinase 89 311 394 28.6 78.9 2.6983
Phosphotransferase, alcohol group as acceptor 87 305 386 28.5 79 2.6301
Protein kinase 76 263 336 28.9 78.3 2.5796
Exonuclease 6 11 15 54.5 73.3 2.5536
Small monomeric GTPase 15 38 46 39.5 82.6 2.5247
GTP binding 43 141 201 30.5 70.1 2.3248
Peptidylprolyl cis-transisomerase 6 12 16 50 75 2.2896
Translation elongation factor 6 12 16 50 75 2.2896
Transcription factor binding 11 27 43 40.7 62.8 2.2838
Guanyl nucleotide binding 46 155 219 29.7 70.8 2.1927
Adenosinetriphosphatase 12 31 38 38.7 81.6 2.1763
Molecular_function unknown 29 91 230 31.9 39.6 2.1739
Protein binding 99 368 539 26.9 68.3 2.1328
Chaperone 16 45 62 35.6 72.6 2.1166
Extracellular matrix structural constituent 10 25 31 40 80.6 2.1081
conferring tensile strength
DNA-directed RNA polymerase 5 10 11 50 90.9 2.0897
Structural constituent of cytoskeleton 21 63 79 33.3 79.7 2.0838
Transferase, transferring one-carbon groups 8 19 29 42.1 65.5 2.0570
GTPase 25 78 95 32.1 82.1 2.0488
Isomerase 12 32 42 37.5 76.2 2.0468
Significantly decreased Process
Fatty acid metabolism 19 30 41 63.3 73.2 5.9082
Main pathways of carbohydrate metabolism 20 39 50 51.3 78 4.8600
comment
reviews
reports
deposited research
interactions
information
[image:9.609.60.558.105.731.2]refereed research
Table 2 (continued)
GO name Number changed Number measured Number in GO % Changed % Present zscore
Catabolic carbohydrate metabolism 18 36 45 50 80 4.4754
Tricarboxylic acid cycle 6 8 10 75 80 3.8664
Hexose metabolism 18 41 49 43.9 83.7 3.8016
Lipid metabolism 42 127 167 33.1 76 3.6708
Lipid transport 5 7 11 71.4 63.6 3.3807
Glycolysis 12 26 32 46.2 81.2 3.3091
Peroxisome organization and biogenesis 7 12 15 58.3 80 3.2972
Glucose metabolism 15 36 42 41.7 85.7 3.2247
Lymph gland development 8 15 17 53.3 88.2 3.2043
Cell proliferation 10 21 34 47.6 61.8 3.1400
Humoral immune response 15 37 79 40.5 46.8 3.0982
Carbohydrate metabolism 31 95 135 32.6 70.4 3.0557
Regulation of cell proliferation 5 8 15 62.5 53.3 2.9848
Muscle contraction 9 20 28 45 71.4 2.7716
Muscle development 13 34 43 38.2 79.1 2.6328
Mesoderm development 28 90 111 31.1 81.1 2.6096
Potassium transport 17 49 60 34.7 81.7 2.5450
Metal ion transport 24 77 100 31.2 77 2.4230
Monovalent inorganic cation transport 21 67 88 31.3 76.1 2.2935
Complement activation 8 20 23 40 87 2.2132
Cation transport 28 98 135 28.6 72.6 2.0923
Electron transport 25 87 113 28.7 77 2.0075
Component
Mitochondrion 88 187 293 47.1 63.8 9.3508
Peroxisome 18 29 42 62.1 69 5.6381
Mitochondrial inner membrane 19 36 60 52.8 60 4.8922
Mitochondrial electron transport chain complex 10 14 32 71.4 43.8 4.7848
Mitochondrial membrane 20 40 72 50 55.6 4.7195
Cytochrome C oxidase 6 8 16 75 50 3.8664
Mitochondrial matrix 9 22 33 40.9 66.7 2.4283
Basement lamina 5 11 11 45.5 100 2.0910
Cytoskeleton 57 223 306 25.6 72.9 2.0527
Function
Hydrogen ion transporter 11 15 33 73.3 45.5 5.1373
Primary active transporter 27 64 107 42.2 59.8 4.4175
Cation transporter 17 36 61 47.2 59 4.0585
Ion transporter 19 43 79 44.2 54.4 3.9406
Cytochrome c oxidase 6 8 16 75 50 3.8664
Oxidoreductase 48 149 207 32.2 72 3.7213
Major histocompatibility complex antigen 13 30 54 43.3 55.6 3.1700
Oxidoreductase, acting on the aldehyde or 7 13 16 53.8 81.2 3.0285
oxo group of donors
Carrier 40 131 196 30.5 66.8 2.9960
Complement component 8 16 19 50 84.2 2.9770
P-type ATPase 5 9 11 55.6 81.8 2.6467
Hydrolase, acting on acid anhydrides, catalyzing 15 42 67 35.7 62.7 2.5199
transmembrane movement of substances
Nucleobase, nucleoside, nucleotide kinase 7 16 19 43.8 84.2 2.3531
Phosphotransferase, phosphate group as acceptor 5 10 13 50 76.9 2.3520
Glutathione transferase 5 10 13 50 76.9 2.3520
P-P-bond-hydrolysis-driven transporter 17 52 78 32.7 66.7 2.2609
ATP-binding cassette (ABC) transporter 11 30 50 36.7 60 2.2573
Potassium channel 15 45 56 33.3 80.4 2.2093
Carbon-carbon lyase 5 11 18 45.5 61.1 2.0910
MAPPFinder can incorporate any MAPP file into its analysis to augment the GO hierarchy. For the FVB benchmark devel-opmental dataset, we have run MAPPFinder on an archive of 54 mouse MAPPs available from [13] (see Additional data files for the complete results). These results for the 12.5-day embryonic time point agree with the GO results, showing that the expression of genes involved in the metabolic path-ways ‘tricarboxylic acid cycle’ (83.3% of 12 genes measured, z score of 5.91) and ‘fatty acid degradation’ (69.2% of 13 genes measured,z score 4.82) is significantly decreased. In addition, the significantly increased criterion identified genes encoding ribosomal proteins (71.1% of 45 genes, z score 6.75) and genes involved in the cell cycle (53.3% of 15 genes,z score 2.4).
The archive of MAPPs provided by GenMAPP is in no way comprehensive. The growth of this archive depends on assis-tance from the entire biological community. Our hope is that, as MAPPFinder users see the added utility of viewing the GO biological processes as fully delineated pathways, they will use GenMAPP to organize the gene lists into more descriptive biological pathways. Figure 3c gives an example of how the genes from the GO term ‘glycolysis’ can be rearranged using the tools in GenMAPP to depict the full pathway showing the direction of the enzymatic cascade, metabolic intermediates and cellular compartments. GenMAPP.org is currently accepting submissions of new MAPP files. MAPPs contributed by the community will be included in the downloadable MAPP archive.
MAPPFinder is a necessary complement to current analysis tools
By approaching large datasets from a higher level or organi-zation, MAPPFinder helps to ease the data analysis and shorten the time necessary to gain a biological understand-ing of the microarray data. MAPPFinder has greatly expanded current pathway-based tools by using the large amount of annotations available from the GO. This broad analysis will help identify biological processes that have not yet been implicated in a particular experimental condition and begin to make connections between biological processes previously thought to be unrelated.
MAPPFinder is available for yeast, mouse and human data. We plan to extend the program to many of the other species that are in GO and updates will be available at [13].
Materials and methods
Gene-expression data
The publicly available mouse microarray dataset, the FVB benchmark set for cardiac development, maturation and aging, was obtained from the CardioGenomics Program for Genomics Applications [14]. These data compare healthy mouse hearts at different time points during development, using male and female FVB/N mice. Specifically, this dataset
examines heart tissue from 12.5-day embryos, 1-day neona-tal mice, 1-week mice, 4-week mice, and adult mice at 5 months and 1 year. Our analysis focused on the 12.5-day embryonic time point and the control adult mice. Three Affymetrix U74A version 1 arrays were used for each time point. For the embryonic time point, three hearts were pooled for each array because of their small size. To improve the statistical power in our analysis, the 5-month and the 1-year mice were combined into a single group of normal adult mice. Signal intensity values were obtained with Affymetrix MAS 5.0 software. Signal values less than 20 were raised to 20 and the log base 2 was taken. Log folds were determined from the average of each time point when compared with the average of the combined control group. Pvalues were calculated with a permutation ttest. The sta-tistical analysis was done using the multest package of the R statistical programming language [22]. These data were imported into GenMAPP, and the resulting GenMAPP Expression Dataset file (.gex) was exported to MAPPFinder.
MAPPFinder requires a user-defined criterion for a mean-ingful gene-expression change. In this case we combined a fold change with a statistical filter to determine significance. We are using a fold change of greater than 1.2 with a pvalue of less than 0.05 to define a significant gene-expression increase, and a fold change of less than -1.2 with a p-value of less than 0.05 to define a significant gene-expression decrease. To determine the overall number of gene-expres-sion changes in each GO term, an additional criterion of a fold change greater than 1.2 or less than -1.2 and a pvalue of less than 0.05 is used (data not shown).
It is important to note that while we have used gene-expres-sion data generated from Affymetrix GeneChips, data from other microarray platforms and other techniques such as SAGE (serial analysis of gene expression) can be used equally easily.
Linking the expression data to Gene Ontology
The links between the GO terms and the genes in the expres-sion dataset are made with the gene-association files [15]. These associations are taken from the European Bioinfor-matics Institute [24] for human genes, the Mouse Genome Database (MGD) [16] for mouse genes, and the Saccha-romycesGenome Database (SGD) [25] for yeast genes. Cur-rently, the genes in the input data must be identified with GenBank, SWISS-PROT or SGD identifiers.
[image:11.609.319.491.614.711.2]MAPPFinder uses a relational database to link the expres-sion dataset to the gene-association files. The MAPPFinder database relates gene-expression data to the appropriate gene-identification systems for each species (Figure 1). For human data, the gene-association files use SWISS-PROT identifiers, requiring a SWISS-PROT-to-GenBank relational table to link datasets using GenBank accession numbers to the GO annotations. For yeast data, the gene-association files use SGD identifiers. A SWISS-PROT-to-SGD relational table is also included for expression datasets using SWISS-PROT identifiers. For mouse data, the GO gene-association files use MGD identifiers, requiring a GenBank-to-MGD relational table, and a SWISS-PROT-to-MGD relational table. MAPPFinder takes advantage of the fact that MGD is also related to UniGene, allowing additional ESTs that are not in the MGD-GenBank relational table to be used as gene identifiers. With this intermediate step, many more GenBank identifiers can be linked to GO annotations. Cur-rently, there is no direct relationship between SWISS-PROT and UniGene, so a similar intermediate step was not used for human data.
Calculating the MAPPFinder results
MAPPFinder calculates the percentage of genes measured within each GO term that meet a user-defined criterion, and this measurement is known as the ‘percent changed’. MAPPFinder also calculates the percentage of the genes associated with a GO term that are measured in the experi-ment, and this measurement is known as the ‘percent present’. Calculating the percent present is necessary to determine how well represented a GO term is in the dataset.
The GO gene-association files [17] are potentially problem-atic, because they treat each GO term independently, remov-ing the implicit parent-child relationship. As a result, looking at the GO terms individually is often uninformative because the number of genes associated with any one term is smaller than the actual number of genes involved in that process, component, or function. To address this issue, we calculate the nested percentage for a parent term with all its children below it in the hierarchy. By combining the child terms with their parent, the results incorporate genes associ-ated with the entire branch of the hierarchy, providing a much more accurate representation of the number of genes involved in that process, component or function. As more specific branches of the GO are examined, the denominator of the two equations will become smaller and the user can
find their desired level of specificity. One complication that arises from this method is that in some cases a gene is asso-ciated with both the parent and child terms or multiple child terms. When the percentages are calculated for the sub-tree, we ensure that each gene is only counted once, so that genes with multiple annotations are not weighted more heavily.
Another complication that arises while calculating the MAPPFinder results is the issue of multiple probes of the same gene on the array. In this case, the features or dupli-cate genes are clustered to one unique gene. If any of the instances of this gene on the array meet the user-defined cri-terion, then that gene meets the user-defined criterion. The number of unique genes is also used to calculate thez score, meaning that the statistics are based only on a single occur-rence of each gene in the dataset.
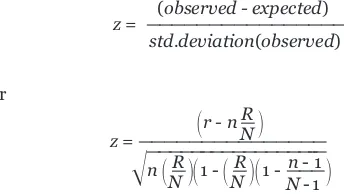
A statistical rating of the relative gene-expression activity in each MAPP and GO term is also provided. It is a standardized difference score (zscore) using the expected value and stan-dard deviation of the number of genes meeting the criterion on a GO term under a hypergeometric distribution. The z score is useful for ranking GO terms by their relative amounts of gene expression changes. Positive z scores indicate GO terms with a greater number of genes meeting the criterion than is expected by chance. Negative z scores indicate GO terms with fewer genes meeting the criterion than expected by chance. Az score near zero indicates that the number of genes meeting the criterion approximates the expected number. Extreme positive scores suggest GO terms with the greatest confidence that the correlation between the expres-sion changes of the genes in this grouping are not occurring by chance alone. Pvalues are not assigned to the GO terms or MAPPs because, while such a standardized difference score could approximate a normalz score for an individual MAPP, the lack of independence between GO terms and the multiple testing occurring among them most certainly makes the normal pvalue for such az score unreliable. As a result, p values are not assigned to the GO terms and MAPPs.
Thez score is calculated by subtracting the expected number of genes in a GO term (or MAPP) meeting the criterion from the observed number of genes, and dividing by the standard devia-tion of the observed number of genes. The equadevia-tion used is
(observed - expected)
z= ————————————————
std.deviation(observed)
or
冢
r - n R— N冣
z= ——————————————————————————————–—冑
n冢
—R N冣冢
1 -冢
R — N
冣冢
1-n- 1 ——— N- 1
冣
where Nis the total number of genes measured, Ris the total number of genes meeting the criterion, nis the total number
comment
reviews
reports
deposited research
interactions
information
of genes in this specific MAPP, and ris the number of genes meeting the criterion in this specific MAPP.
Therefore, if two GO terms contain the same number of genes, the term with the greater number of genes meeting the criterion will receive a higher score. Dividing by the stan-dard deviation adjusts for the size of the GO term, ranking a GO term (or MAPP) with a large number of genes meeting the criterion higher than a GO term (or MAPP) with the same percentage of genes changed, but fewer total genes.
The MAPPFinder results are generated in the GO browser for analysis in the context of the GO hierarchy and as tab-delimited text files that can be used for sorting and filtering the data in a spreadsheet program.
Additional data files
The following additional data files are available with the online version of this paper.
The FVBN developmental data in the form of a GenMAPP expression dataset file (.gex). It contains the microarray dataset and the criteria used to define increased and decreased gene-expression change. It can be opened for editing in GenMAPP and is the appropriate data type for use with MAPPFinder.
The FVBN developmental data as a database file generated by MAPPFinder (.gdb). It contains the relationships between the genes in the dataset and the GO hierarchy. The file can be opened for viewing in Microsoft Access. This file must be present to build GenMAPP MAPPs from existing MAPPFinder results.
The MAPPFinder results for the 12.5-day embryos versus the adult mice are contained in text files: 12.5-day Embryo - sig-nificantly increased - Gene Ontology results, 12.5-day Embryo - significantly increased - Local results, 12.5-day Embryo - significantly decreased - Gene Ontology results, 12.5-day Embryo - significantly decreased - Local results, day Embryo - All Changes - Gene Ontology results, 12.5-day Embryo - All Changes - Local Results. These text files contain the MAPPFinder results for both criteria and both the GO hierarchy and the GenMAPP.org MAPPs. These files can be loaded into MAPPFinder for view in the MAPPFinder GO browser. These files are tab-delimited and can also be viewed as tables in Microsoft Excel. The ‘All Changes’ files contain the results for a criteria looking for either increased or decreased gene expression changes.
Acknowledgements
We thank A. Zambon, W. Tingley, T. Speed, P. Bacchetti and J. Myers for helpful conversations about the design and implementation of MAPPFinder, B. Taylor for help with the preparation of this manuscript, and S. Izumo and CardioGenomics for making the microarray dataset pub-licly available. This work is supported by the J. David Gladstone Institutes,
the San Francisco General Hospital General Clinical Research Center, the National Heart, Lung, and Blood Institute, San Francisco General Hospital General Clinical Research Center MO1RR00083 (B.R.C.) and the NHLBI Programs for Genomic Applications (BayGenomics).
References
1. Eisen MB, Spellman PT, Brown PO, Botstein D: Cluster analysis and display of genome-wide expression patterns. Proc Natl Acad Sci USA1998, 95:14863-14868.
2. Tamayo P, Slonim D, Mesirov J, Zhu Q, Dmitrovsky E, Lander ES, Golub, TR: Interpreting gene expression with self-organizing maps: methods and application to hematopoeitic differenti-ation.Proc Natl Acad Sci USA 1999, 96:2907-2912.
3. Dahlquist KD, Salomonis N, Vranizan K, Lawlor SC, Conklin BR: GenMAPP, a new tool for viewing and analyzing microarray data on biological pathways.Nat Genet 2002, 31:19-20. 4. Nakao M, Bono H, Kawashima S, Kamiya T, Sato K, Goto S,
Kane-hisa M: Genome-scale gene expression analysis and pathway reconstruction in KEGG. Genome Inform Ser WorkShop Genome Inform 1999,10:94-103.
5. Karp PD, Riley M, Paley SM, Pellegrini-Toole A: The MetaCyc Database. Nucleic Acids Res2002, 30:59-61.
6. Grosu P, Townsend J, Hartl D, Cavalieri D: Pathway processor: a tool for integrating whole-genome expression results into metabolic networks. Genome Res2002, 12:1121-1126.
7. Luyf A, de Gast J, van Kampen A: Visualizing metabolic activity on a genome-wide scale.Bioinformatics2002, 18:813-818. 8. Ashburner M, Ball CA, Blake JA, Botstein D, Butler H, Cherry JM,
Davis AP, Dolinski K, Dwight SS, Eppig JT, et al.: Gene Ontology: tool for the unification of biology. Nat Genet 2000, 25:25-29. 9. Pletcher SD, MacDonald SJ, Marguerie R, Certa U, Stearns SC,
Gold-stein DB, Partridge L: Genome-wide transcript profiles in aging and calorically restricted Drosophila melanogaster. Curr Biol 2002, 12:712-723.
10. Silcon Genetics Products: Gene Spring [http://www.silicon-genetics.com/cgi/SiG.cgi/Products/GeneSpring/index.smf]
11. Affymetrix - NetAffx Analysis Center [http://www.affymetrix.com/analysis/index.affx] 12. The Gene Ontology Project Ontology Files
[ftp://ftp.geneontology.org/go/ontology/] 13. GenMAPP [http://www.GenMAPP.org]
14. CardioGenomics: FVB benchmark data set for cardiac development, maturation, and aging [http://www.cardio-genomics.org:1550/groups/proj1/pages/fvb_home.html]
15. The Gene Ontology Project Gene Association Files [ftp://ftp.geneontology.org/go/gene-associations]
16. Blake JA, Richardson JE, Bult CJ, Kadin JA, Eppig JT and the Mouse Genome Database Group: The Mouse Genome Database (MGD): the model organism database for the laboratory mouse.Nucleic Acids Res2002, 30:113-115.
17. Zhu H: Myocardial cellular development and morphogenesis. In The Myocardium. Edited by Langer GA. San Diego, CA: Academic Press; 1997: 33-80.
18. Poelmann R, Molin D, Wisse L, Gittenberger-de Groot A: Apopto-sis in cardiac development. Cell Tissue Res2000, 301:43-52. 19. Kubalak S, Hutson D, Scott K, Shannon R: Elevated transforming
growth factor 2 enhances apoptosis and contributes to abnormal outflow tract and aortic sac development in retinoic X receptor ␣␣knockout embryos.Development2002, 129:733-746.
20. Lopaschuk G, Collins-Nakai R, Itoi T: Developmental changes in energy substrate use by the heart. Cardiovasc Res 1992, 26:1172-1180.
21. Fritz H, Smoak I, Branch S: Hexokinase I expression and activity in embryonic mouse heart during early and late organogen-esis.Histochem Cell Biol1999, 112:359-365.
22. Statistical methods for identifying differentially expressed genes in replicated cDNA microarray experiments [http://www.stat.berkeley.edu/users/terry/zarray/TechReport/578.pdf] 23. The Gene Ontology Consortium: Creating the Gene Ontology resource: design and implementation. Genome Res 2001, 11:1425-1433.
24. EMBL-EBI: GOA project online [http://www.ebi.ac.uk/GOA/project.html]