KEGG spider: interpretation of genomics data in the context of the
global gene metabolic network
Alexey V Antonov
*
, Sabine Dietmann
*
and Hans W Mewes
*†
Addresses: *GSF National Research Centre for Environment and Health, Institute for Bioinformatics, Ingolstädter Landstraße 1, D-85764
Neuherberg, Germany. †Department of Genome-Oriented Bioinformatics, Wissenschaftszentrum Weihenstephan, Technische Universität
München, 85350 Freising, Germany.
Correspondence: Alexey V Antonov. Email: [email protected]
© 2009 Antonov et al.; licensee BioMed Central Ltd.
This is an open access article distributed under the terms of the Creative Commons Attribution License (http://creativecommons.org/licenses/by/2.0), which permits unrestricted use, distribution, and reproduction in any medium, provided the original work is properly cited.
KEGG spider
<p>A web-based tool for interpretation of experimentally-derived gene lists that provides global models uniting genes from different met-abolic pathways.</p>
Abstract
KEGG spider is a web-based tool for interpretation of experimentally derived gene lists in order to gain understanding of metabolism variations at a genomic level. KEGG spider implements a 'pathway-free' framework that overcomes a major bottleneck of enrichment analyses: it provides global models uniting genes from different metabolic pathways. Analyzing a number of experimentally derived gene lists, we demonstrate that KEGG spider provides deeper insights into metabolism variations in comparison to existing methods.
Background
In the post-genomic era the targets of many experimental studies are complex cell disorders [1-6]. A standard experi-mental strategy is to compare the genetic/proteomics signa-tures of cells in normal and anomalous states. As a result, a set of genes with differential activity is delivered. In the next step, the interpretation of identified genes in a model context is required. A widely accepted strategy is to infer biological processes that are most relevant to the analyzed gene list. The inference is based on prior knowledge of individual gene properties, such as gene biological functions or interactions. This common approach is usually referred to as enrichment analysis [7-16].
The Kyoto Encyclopedia of Genes and Genomes (KEGG) is a knowledge base for the networks of genes and metabolic com-pounds. The major component of KEGG is the PATHWAY database, which consists of graphical diagrams of biochemi-cal pathways, including most of the known metabolic path-ways. Several available public tools, such as GenMAPP/
[18], make use of standard enrichment analysis to find over-represented global pathways within a gene list. However, for statistical evaluation these tools use only information about gene pathway membership, while information about pathway topology is largely discarded. Additionally, several tools pro-vide visualizations of pathways reported to be enriched [19-21]. Some tools provide visualizations of a gene list in the con-text of the global metabolic network [22,23], providing, how-ever, no quantitative or statistical analyses. Visual analyses of the graphical representation of the genes on the global meta-bolic network give only an intuitive feeling that genes are related. Taking into account the density of metabolic net-works, one must not underestimate the value of a statistical treatment. Even for randomly generated gene lists, it is possi-ble to connect many of the genes into a metabolic subnetwork through one or two intermediate partners. A graphical repre-sentation may have low scientific value without providing a quantitative estimate of the model quality.
More complex statistical methods have been proposed to take Published: 18 December 2008
Genome Biology 2008, 9:R179 (doi:10.1186/gb-2008-9-12-r179)
Received: 7 August 2008 Revised: 28 October 2008 Accepted: 18 December 2008 The electronic version of this article is the complete one and can be
scoring functions. For example, in the ScorePAGE method the distance between genes within the metabolic pathway is included into the scoring function [24]. In this case, the impact of a pair of genes is weighted with respect to the dis-tance between genes within the metabolic pathway. Another recently proposed procedure (impact analyses) [25] exploits the hierarchical structure of signaling pathways and weights the impact of genes with respect to their position in the path-way hierarchy. Genes at the top of the signaling cascade receive higher impact in comparison to downstream genes.
We propose a novel statistical approach for the analysis of gene lists in the context of gene metabolic pathways that uses network topology to make knowledge inference. Our approach does not evaluate each individual KEGG metabolic pathway separately, but uses a global gene metabolic network that integrates all KEGG metabolic pathways together. The input gene list is translated into a network model, e.g. edges connect genes that most probably affect the state of each other. We also proposed a robust statistical treatment of the inferred network. As an output, our procedure provides a graphical model as well as statistical significance of the inferred network computed by a Monte-Carlo simulation pro-cedure. We show on several real data sets that our approach
provides deeper insight into variations of metabolic pathways covered by the given gene list in comparison to currently available methods.
Results and discussion
Let us start from consideration of an illustrative example to highlight the weaknesses of existing analytical methods. Assume that as a result of some experiment one gets a list of nine human genes, ME1, MDH1, FH, ASL, ASS1, CTH, CDO1,
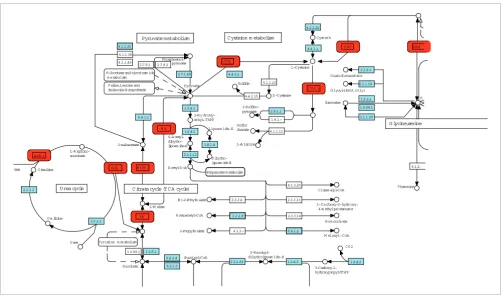
CBS, SHMT1. These genes are related to metabolism, and an enrichment analysis would identify several overrepresented metabolic pathways. Three genes (CTH, SHMT1, CBS) are mapped to 'glycine, serine and threonine metabolism'. Two genes (ASL, ASS1) are mapped to 'urea cycle' and two genes (ME1, MDH1) are mapped to 'citrate cycle'. No functional model that unites all nine genes together would be supplied by standard enrichment analysis. However, according to the KEGG pathway wiring diagrams shown in Figure 1, all nine genes are consecutively connected via metabolites and form a non-interrupted network that runs through five canonical KEGG metabolic pathways, namely 'urea cycle', 'citrate cycle', 'pyruvate metabolism', 'cysteine metabolism', and 'glycine, serine and threonine metabolism'. This illustrative example
[image:2.612.54.555.383.679.2]Artificial example
Figure 1
Artificial example. The genes ME1, MDH1, FH, ASL, ASS1, CTH, CDO1, CBS and SHMT1 are presented as red boxes. Five KEGG pathway ('urea cycle', 'citrate cycle', 'pyruvate metabolism', 'cysteine metabolism', 'glycine, serine and threonine metabolism') wiring diagrams are manually linked together to demonstrate that all nine genes form a non-interrupted metabolic network.
Pyruvate metabolism C ysteine m etabolism
4.1.1.32
4.1.1.38
4.1.1.49 2.7.9.1 2.7.9.2Phosphoenol−pyruvate
2.7.1.40 N ikotinate and nicotinam ide
m e tabolism
V aline,Leucine and Isoleucine Biosynthesis Pyruvate CTH Cystath 4.4.1.1 4.2.1.22 SH M CBS L−Cysteine 5.1.1.10 6.4.1.1
M D H 1 O xaloacetate
A SL
C itrate cycle (TC A cycle)
FE L−M alate M E 4.4.1.1 4.4.1.15 Sulfide D −Cysteine CD O 1
2.6.1.1 1.4.1.− 4.1.1.12 3−Sulfino− pyruvate Sulfur dioxide L−A lanine 2−H y droxy−
ethyl−ThPP 1.2.4.1 1.2.4.1 2.3.1.12 S−A cetyl− dihydro− lipoam ide−E 1.8.1.4
Lipoam ide−E
D ihydro− lipoam ide−E A cetyl−CoA
Propanoate m etabolism
4.1.3.25 2.3.3.13 6.4.1.2 2.3.3.14 2.3.3.6 2.3.1.9 4.1.3.− Citram alyl−CoA 3−Ca rboxy−3−hydroxy− 4−m ethylpe ntanoate
H om ocitrate
M elonyl−CoA (R)−2−Ethylm alate
A cetoacetyl−CoA
2−Propylm alate
Tyrosine m etabolism
1.3.5.1 1.3.99.1
Succinate
6.2.1.4
6.2.1.5
2.3.1.61 1.2.4.2 1.2.4.2
CO 2 Succinyl−CoA S−Succinyl− dihydrolipoam ide−E 3−Carboxy−1− hydroxypropyl−ThPP 2.1.3.3 3.5.3.1
U rea cycle
A SS 1
tate Citrulline
O m ithine
U rea L−A rginino− succinate G lycine,serine 4.1.2. Threonine G G uanidinoacetate
G lycyl−tRN A (G ly)
demonstrates that, in many cases, the knowledge of enriched pathways may be insufficient to get a complete understanding of the relationship between genes from the supplied list. Con-sideration of the topology of the global gene metabolic net-work for the interpretation of gene lists may be much more informative.
We assume that the closer the genes on the global gene meta-bolic network, the greater the probability that the change in the state of one gene will affect the state of the other. In the considered illustrative example in Figure 1, ASS1 and ASL are both associated with L-argininosuccinate. Thus, the change in the state of ASS1 (for example, overexpression) most prob-ably affects the amount of L-argininosuccinate in the cell (Figure 1). There are probably many ways the cell can handle extra amounts of L-argininosuccinate. One of them is to increase the efficiency of its utilization through possible met-abolic reactions. The cell response can be the increased level of ASL expression. The ASL overexpression will speed up L-argininosuccinate transformation into fumarate and arginine. Thus, even if two genes are not directly involved in regulatory relationships, but catalyze close reactions on the global network, they can affect the state of each other through auto-regulatory mechanisms switched up by abnormal amounts of common metabolites.
KEGG spider
KEGG spider [26] is a freely available web-based tool that implements a global metabolic network framework for the interpretation of gene lists. It has a simple interface: as input it accepts several types of gene or protein identifiers. For example, for the human genome, KEGG spider supports iden-tifiers from 'Entrez Gene'[27], 'UniProt/Swiss-Prot', 'Gene Symbol' [27,28], 'UniGene' [27], Ensembl' [29], 'RefSeq Pro-tein ID', 'RefSeq Transcript ID' [30], and'Affymetrix probe codes' [31]. As output, the user gets a report on the statistical significance of the inferred network models (D1, D2,..), as well as a catalog of enriched KEGG pathways and Gene Ontology terms. For each model (D1, D2,..), a link is provided to obtain a graphical visualization. The visualization is performed by the Medusa package [32]. In addition, the user can highlight genes from the model according to KEGG canonical path-ways. The inferred network models can be downloaded as a text file and used with freely available packages for network analyses and visualization [32,33].
Here, we present several examples of analysis of published experimental data by KEGG spider. To illustrate the advan-tages experimental researchers would get by using KEGG spi-der in comparison to commonly used pathway enrichment analyses, we provide a comparison between KEGG spider and GENECODIS [34], a tool recently published in Genome Biol-ogy that implements a possibility to perform enrichment analysis of KEGG pathways. The choice of GENECODIS was casual, as the results of enrichment analyses of KEGG path-ways by other tools would be similar.
We also provide a comparison (Additional data file 1) of KEGG spider to KEGG atlas [23]. KEGG atlas is a web tool that provides visualization of a gene list (converted into KEGG KO identifiers) in the context of the global metabolic network. As has been discussed above, KEGG atlas provides no quantitative or statistical analyses and, thus, supplies no criteria for the evaluation of the quality of provided graphical output. As demonstrated, the output of KEGG atlas for a ran-dom gene list looks similar to the experimentally derived gene lists.
Identification of genes commonly up- or downregulated in diffuse-type gastric cancers
In [35] a comparison of the expression profiles of cell popula-tions from 20 diffuse-type gastric cancers with their corre-sponding non-cancerous mucosae was performed. The authors report in the paper the top 75 up- regulated and top 75 down-regulated genes. The 150 differentially expressed genes represent a variety of functions, including genes involved in various metabolic pathways. In total, 28 genes map to KEGG metabolic pathways. Enrichment analysis (Table 1) identified three pathways that are significantly over-represented. For example, nine genes are from the 'metabo-lism of xenobiotics by cytochrome P450' pathway and five are involved in 'bile acid biosynthesis'.
The model D1, containing directly connected genes, provided by KEGG spider covers 14 genes (p-value < 0.001). The model
[image:3.612.53.555.662.732.2]D2, in which one intermediate gene is allowed, covers 24 genes (p-value < 0.001). Figure 2 presents a graphical visual-ization of the inferred D2 model, which spreads through five canonical KEGG pathways.
Table 1
KEGG metabolic pathways enriched in the list of 150 genes (28 genes map to KEGG metabolic pathways) commonly up- or down-reg-ulated in diffuse-type gastric cancers [35] (reported by GENECODIS)
Number of genes P-value (not corrected for multiple testing) KEGG pathway
9 4.42E-18 (KEGG) Metabolism of xenobiotics by cytochrome P450
5 2.20E-10 (KEGG) Bile acid biosynthesis
Therefore, in comparison to available analytical procedures, KEGG spider enhances our understanding of metabolism var-iation in gastric cancers. First, it demonstrates that deregu-lated genes do not split into independent groups (pathways) as may be concluded from standard enrichment analyses: almost all 24 (out of 28) genes form a non-interrupted (a maximum of one missing gene is allowed) network. Second, it provides not only information that 24 genes are mapped close to each other on the global metabolic network but also esti-mates the confidence of this event: the p-value reflects the probability of getting a non-interruptedly connected network that covers at least the same number of genes for a randomly sampled list of 28 genes (only genes mapped to KEGG meta-bolic pathways are used to generate the random lists).
Proteomic analysis of livers of patients with primary hepatolithiasis
Primary hepatolithiasis or intrahepatic calculi, which is char-acterized by the formation of gallstones in the intrahepatic bile duct, is an intractable liver disease and suspected to be one of the causes of cholangiocellular carcinoma. To obtain an insight into the disease, the proteomic analysis of liver tis-sue specimens was done (affected and unaffected hepatic
seg-ments from patients with primary hepatolithiasis) [36]. For the specimens from the unaffected segments, 83 unique pro-teins were reported. For the specimens from the affected seg-ments, 74 unique proteins were reported. Consequently, 12 up-regulated proteins and 21 down-regulated proteins were identified in affected versus unaffected hepatic segments.
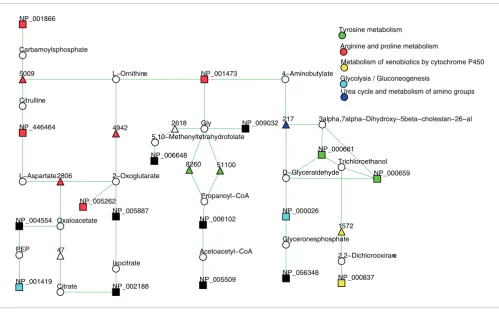
For example, 17 out of 21 down-regulated proteins (unaf-fected versus af(unaf-fected hepatic segments) map to KEGG path-ways. A standard enrichment analysis for the 21 down-regulated proteins found two pathways 'urea cycle' (five pro-teins) and 'glycolysis' (four propro-teins) to be enriched (Table 2). These results enable the conclusion that some characteristic metabolic pathways are violated in affected hepatic cells. Analysis with KEGG spider provides a comprehensive picture of the characteristic metabolic perturbations between normal and diseased cells. The model D2, in which proteins are con-nected via one intermediate protein, covers all 17 proteins (p -value < 0.001) that are mapped to KEGG metabolic pathways. The model D2 is presented in Figure 3. The KEGG spider model retrieves a comprehensive picture of the genetic basis of metabolic variations in comparison to standard enrich-ment analyses. As in the previous example, it demonstrates Network model D2 of 150 commonly up- or down-regulated genes in diffuse-type gastric cancers [35]
Figure 2
Network model D2 of 150 commonly up- or down-regulated genes in diffuse-type gastric cancers [35]. Twenty-eight genes can be mapped to KEGG metabolic pathways; the model D2 covers 24 genes (p-value < 0.001). Genes from the input list are presented as rectangles, intermediate genes as
triangles and chemical compounds as circles. Different colors are used to specify different KEGG canonical pathways.
Arachidonic acid metabolism
Acetoacetyl−CoA CYP3A7
ADH1C
34
D−Glyceraldehyde
UTP AKR1C3
AKR1C2
GPX1
AKR1C4
GPX4
D−Fructoses1,6−bisphosphate 3alpha−Hydroxyetiocholan−17−one
4860
DNTP
1−Methylnicotinamide
1562
IMPDH2
Linoleate 246
BACH
ACAA2
2−Methoxyestradiol−17bet a
230
GNPI Chloralshydrate
FBP1
56953 60487
Palmitoyl−CoA
beta−D−Fructoses1,6−bisphosphate
30
NME1 (4Z,7Z,10Z,13Z,16Z,19Z)−Docosahexaenoyl−CoA
AKR1B10
VitaminsPP
Acetate 1557
Metabolism of xenobiotics by cytochrome P450
Xanthosines5’−phosphate Adenosine
R07015
Propanoyl−CoA
AHCY
318 15(S)−HPETE
51102 316
PPT1
Methylmalonate
ALDH3A1
5211
Valine, leucine and isoleucine degradation Glycolysis / Gluconeogenesis
CDP UGT1A4
Se−Adenosylselenohomocysteine GSTA1
3alpha,7alpha−Dihydroxy−5beta−24−oxocholestanoyl−CoA
Bile acid biosynthesis
Trichloroethanol GSTA3 Benzo[a]pyrene−4,5−oxide
beta−D−Fructoses6−phosphate ACAS2HMGCS2
PON2
Myristoyl−CoA
that deregulated genes are not independent (or split to inde-pendent pathways) and all 17 metabolism related proteins form non-interrupted (a maximum of one missing gene is allowed) network.
Large scale benchmark of KEGG spider
To support the practical significance of KEGG spider, we col-lected dozens of recently published experimental studies that reported lists of genes/proteins in various biological contexts. We reanalyzed them using KEGG spider and demonstrated that, in most cases, the models provided by KEGG spider improve our understanding of the genetic basis of
metabo-lism variations. These results can be found at the KEGG spi-der web site [37].
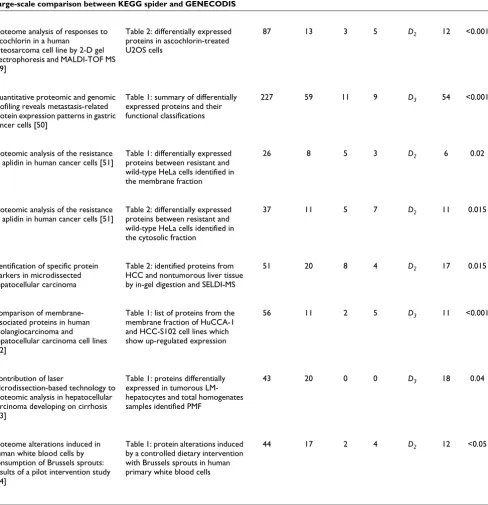
[image:5.612.55.554.84.397.2]Of particular interest are the studies that report differentially expressed genes/proteins between normal/disease cell states or treated/untreated cell states. We selected 17 such studies, which report at least eight genes/proteins that can be mapped to KEGG metabolic pathways and analyzed these genes/pro-teins using KEGG spider and GENECODIS. The comparative statistics is provided in Table 3. The 'GENECODIS' column reports results provided by GENECODIS, the 'k' column reports the number of pathways found to be enriched at a p -Network model D2 of 21 down-regulated proteins in a comparison of unaffected versus affected hepatic segments [36]
Figure 3
Network model D2 of 21 down-regulated proteins in a comparison of unaffected versus affected hepatic segments [36]. The network model D2 covers 17 proteins (p-value < 0.001). Proteins from the input list are indicated by rectangles, intermediate proteins by triangles, and chemical
compounds by circles. The colors are used to specify KEGG canonical pathways.
Acetoacetyl−CoA
1572 D−Glyceraldehyde
NP_000661 NP_006648
Oxaloacetate
8260
NP_000026
NP_000659
NP_001419 Citrulline
NP_006102
NP_000837 4−Aminobutylate
L−Ornithine
NP_446464
L−Aspartate
2618
2806 2−Oxoglutarate
Glyceronesphosphate 5,10−Methenyltetrahydrofolate
NP_005262 Carbamoylsphosphate
2,2−Dichlorooxirane
NP_056348 Gly
Metabolism of xenobiotics by cytochrome P450
Propanoyl−CoA
NP_002188
51100
217 NP_009032 5009
PEP
Glycolysis / Gluconeogenesis NP_001866
4942
Urea cycle and metabolism of amino groups
Trichloroethanol
Arginine and proline metabolism
NP_005509 47
NP_005887
Citrate NP_004554
3alpha,7alpha−Dihydroxy−5beta−cholestan−26−al Tyrosine metabolism
Isocitrate
NP_001473
Table 2
KEGG metabolic pathways enriched in the list of 21 down-regulated proteins [36] (affected versus unaffected hepatic segments) reported by GENECODIS
Number of genes P-value (not corrected for multiple testing) KEGG pathway
5 4.98E-12 (KEGG) Urea cycle and metabolism of amino groups
[image:5.612.55.550.671.728.2]Table 3
Large-scale comparison between KEGG spider and GENECODIS
Input proteins/genes GENECODIS KEGG spider
Paper Table All KEGG k max Model n P-value
Proteomic analysis of primary cell lines identifies protein changes present in renal cell carcinoma [40]
Table 1: proteins found to be differentially expressed between matched normal and RCC primary lines
62 23 5 10 D3 22 <0.01
Proteomic analysis of anaplastic lymphoma cell lines: identification of potential tumour markers [41]
Table 2: proteins overexpressed in FE-PD cells compared to SU-DHL-1 cells
41 13 3 3 D2 12 0.015
Differential expression profiling of human pancreatic adenocarcinoma and healthy pancreatic tissue [42]
Table 3: proteins at higher levels in normal pancreas compared to pancreatic cancer
40 12 2 5 D3 12 0.015
Proteomic search for potential diagnostic markers and therapeutic targets for ovarian clear cell adenocarcinoma [43]
Table 1: differentially expressed proteins in human ovarian cancer cells
36 17 3 4 D2 13 0.025
Quantitative proteomic analysis to discover potential diagnostic markers and therapeutic targets in human renal cell carcinoma [44]
Table 3: differentially expressed proteins in RCC patients
91 36 12 14 D2 33 <0.001
Protein profile changes in the human breast cancer cell line MCF-7 in response to SEL1L [45]
Table 4: MCF7-SEL1L differentially expressed genes identified by microarray analysis
60 9 1 4 D2 7 0.03
Protein dysregulation in mouse hippocampus polytransgenic for chromosome 21 structures in the Down syndrome critical region [46]
Table 2: list of proteins dysregulated in hippocampus of polytransgenic micea
42 14 2 5 D2 12 0.015
Differential expression of proteins in response to ceramide-mediated stress signal in colon cancer cells by 2-D gel electrophoresis and MALDI-TOF-MS [47]
Table 1: list of identified proteins on HCT116 2-DE gels
82 16 2 4 D3 15 0.02
Subcellular proteome analysis of camptothecin analogue NSC606985-treated acute myeloid leukemic cells [48]
Table 2: functional classifications of the deregulated proteins in NSC606985-induced apoptotic NB4 Cellsa
Proteome analysis of responses to ascochlorin in a human
[image:7.612.62.550.97.601.2]osteosarcoma cell line by 2-D gel electrophoresis and MALDI-TOF MS [49]
Table 2: differentially expressed proteins in ascochlorin-treated U2OS cells
87 13 3 5 D2 12 <0.001
Quantitative proteomic and genomic profiling reveals metastasis-related protein expression patterns in gastric cancer cells [50]
Table 1: summary of differentially expressed proteins and their functional classifications
227 59 11 9 D3 54 <0.001
Proteomic analysis of the resistance to aplidin in human cancer cells [51]
Table 1: differentially expressed proteins between resistant and wild-type HeLa cells identified in the membrane fraction
26 8 5 3 D2 6 0.02
Proteomic analysis of the resistance to aplidin in human cancer cells [51]
Table 2: differentially expressed proteins between resistant and wild-type HeLa cells identified in the cytosolic fraction
37 11 5 7 D2 11 0.015
Identification of specific protein markers in microdissected hepatocellular carcinoma
Table 2: identified proteins from HCC and nontumorous liver tissue by in-gel digestion and SELDI-MS
51 20 8 4 D2 17 0.015
Comparison of membrane-associated proteins in human cholangiocarcinoma and
hepatocellular carcinoma cell lines [52]
Table 1: list of proteins from the membrane fraction of HuCCA-1 and HCC-S102 cell lines which show up-regulated expression
56 11 2 5 D3 11 <0.001
Contribution of laser
microdissection-based technology to proteomic analysis in hepatocellular carcinoma developing on cirrhosis [53]
Table 1: proteins differentially expressed in tumorous LM-hepatocytes and total homogenates samples identified PMF
43 20 0 0 D3 18 0.04
Proteome alterations induced in human white blood cells by consumption of Brussels sprouts: results of a pilot intervention study [54]
Table 1: protein alterations induced by a controlled dietary intervention with Brussels sprouts in human primary white blood cells
44 17 2 4 D2 12 <0.05
The 'Paper' column reports the title of the paper that reported a list of differentially expressed proteins/genes related to different diseases or treated/untreated cell states. The 'Table' column reports the table number and legend from the paper. The 'Input proteins/genes' section reports the total number of proteins/genes (All) and the number (KEGG) that mapped to KEGG pathways. The 'GENECODIS' section reports results provided by GENECODIS; the 'k' column reports the number of pathways found to be enriched (p-value < 0.05); the 'max' column reports the number of input genes covered by the largest pathway. The 'KEGG spider' section reports results provided by KEGG spider; the 'Model' column specifies the most significant model (D2 or D3); the 'n' column reports the number of input proteins/genes covered by the model; the p-value column reports significance estimated by a Monte Carlo simulation procedure.
Table 3 (Continued)
value < 0.05, and the 'max' column reports the number of input genes covered by the largest pathway. As can be seen, in all cases the interpretational power of enrichment analyses was quite limited. On average, from 10% to 40% of the input genes mapped to KEGG pathways could be interpreted by one canonical pathway. As can be seen, in all cases KEGG spider provided statistically valid models.
Conclusion
Recent advances in genomics technologies allow for the detection of genes with differential activities between various cell states. Since metabolic processes are at the heart of the cell, they are often subjected to variations in disease cell states. Complete understanding of metabolism variations can give clues to possible metabolism-related treatment of the studied cell disorders. As has been demonstrated, KEGG spi-der provides a comprehensive interpretation of genomics data related to metabolism variations. In addition, the KEGG spider network models incorporate not only genomics infor-mation, but also specify small molecules whose metabolism might be affected. This feature provides a link between genomics and rapidly developing high-throughput metabo-lomics technologies. It is obvious that experimental studies utilizing both techniques in parallel will become popular in the near future. For such studies, the interpretational models provided by KEGG spider are a useful link between genomics and metabolomics data.
We would like to point out that the idea to infer the network model from a gene list based on external knowledge is not completely new; for example, there are commercial packages available, such as Ingenuity Pathway Analysis software [38], which transforms a list of genes into a set of networks accord-ing to internal database information of gene pairwise rela-tionships. As we already mentioned, some free online tools exist [18-21] that allow one to visualize several metabolic pathways together that are related to the input gene list. How-ever, visual analyses of graphical representations of genes on metabolic pathways gives only an intuitive feeling that discov-ered genes are related. Taking into account the density of the global gene metabolic network, one must not underestimate the value of the statistical treatment. Even for randomly gen-erated gene lists, it is possible to connect many of genes into a subnetwork through one or two intermediate partners. A beautiful looking figure may have low scientific value without statistical treatment of the presented network model.
To our knowledge not one of the currently existing tools that infer network models from gene lists provides robust statisti-cal treatment of the inferred network models. For example, the statistical scores provided by Ingenuity Pathway Analysis do not take into account the topology of the reference network and provide statistically significant scores even for random gene lists. In contrast, KEGG spider implements a robust sta-tistical treatment of the inferred network models, based on
the topology of the global metabolic network, and provides a valid estimate of the p-values by a Monte Carlo simulation procedure. The p-values provided by KEGG spider actually reflect the probability of getting the same size network model for a random gene list.
Examples of analysis of disease-specific genes by KEGG spi-der suggest that the separation of metabolic reactions into canonical pathways is, to some degree, artificial. In most cases, metabolism-related genes were from several KEGG canonical pathways. However, the analysis with KEGG spider reveals that, if one considers the topology of the global gene metabolic network, these genes form a non-interrupted (a maximum of one or two genes are missing) disease-specific pathway that runs through several canonical pathways. These results also support a hypothesis that disease-specific metab-olism variations in most cases are not independent, for exam-ple, deregulated genes from different pathways are linked to each other via consecutive one- or two-step metabolic reac-tions. The examples of analysis of disease-specific genes by KEGG spider presented in Table 3 may serve as support for this hypothesis.
Finally, we would like to summarize the power and limita-tions of KEGG spider. In comparison to other tools, KEGG spider provides a robust analytical framework for interpreta-tion of gene lists in the context of a global gene metabolic net-work. The information of gene pairwise relationships is widely exploited (gene A is related to gene B via metabolite C) and the inferred network model is not limited to the size of one metabolic pathway. In the current form, KEGG spider computes the minimal distance between any two genes as a minimal number of steps required to get from one gene to another. A more realistic way to model distance between genes will be a weighted approach where one would consider not only the number of steps but also the impact of each step. This methodological extension can be considered as a possi-bility for future improvement of KEGG spider. We also would like to point out that the produced output models are limited by the available information on cell metabolism from the KEGG database.
Materials and methods
A global gene metabolic network
In KEGG, reactions are linked to orthologous groups of enzymes (KEGG ORTHOLOGY database) and orthologous groups are mapped to the genes (in most cases each ortholo-gous group corresponds to ortholog genes from different genomes). Thus, reactions can be mapped to genes from a given genome, and the reaction network can be transformed into a global organism-specific gene metabolic network, where genes are nodes and compounds are edges, respec-tively. Some reactions are organism specific or are not anno-tated by an orthologous group. In this case, they are not present in the corresponding organism-specific gene net-work. Therefore, the resulting global gene metabolic network links by edges any two genes that are associated with reac-tions sharing common compounds (from the main reaction pair).
Network inference procedure
The distance between two arbitrary genes is computed as the minimum number of consecutive steps required to get from one gene to another by working through existing paths on the global gene metabolic network. Distance 1 means that two genes are directly connected. Distance 2 means that two genes are connected via one intermediate gene, distance 3 means that two genes are connected via two intermediate genes, and so on. Given a gene list, our purpose is to infer the network model that minimizes the distance between each connected gene pair according to pairwise distances between genes.
Initially, we map genes from the input list onto the global gene metabolic network. At this point all genes from the input list are disconnected. In the first step, we connect by edges gene pairs with distance 1 and look for connected subnet-works. The subnetwork with the maximal number of genes is referred to as an inferred network model D1. We also refer to the number of genes in the maximal subnetwork as the size of the inferred model. In the second step, genes (from the input list) with distance 2 are connected by edges. The subnetwork with the maximal number of genes is inferred and is referred to as network model D2. In a similar way, network models D3,
D4,..., are inferred. Models D2, D3,..., incorporate genes that are not from the input list but are added to connect input genes in the network model. We refer to these added genes as intermediate genes.
Statistical treatment
The null hypothesis is that the input gene list has no bias in relation to the topology of the global gene metabolic network. A quality measure of the inferred network model can be its size, that is, the number of genes from the input list in the model. We have to estimate the probability to infer models with the same or bigger size from randomly generated gene lists of size N, where N is the number of input genes.
Let us assume that we have N genes in the input list. Using the network inference procedure described above, we infer the
network models D1, D2, D3. Let us denote S1, S2, S3 to be the number of input genes in the inferred network models D1, D2,
D3. The values S1, S2, S3 are used as statistics. To estimate the significance of the inferred model D1, we compare the value S1
with a distribution R1j. In the same way, we estimate the sig-nificance of the inferred models D2, D3 by comparing the val-ues S2, S3with distributions R2j, R3j, respectively.
The distributions R1j, R2j, R3j are computed by a random sim-ulation procedure [39]. To generate the background distribu-tions R1j, R2j, R3j, we repeat the following simulation procedure k times. Index j = 1..k specifies the random simula-tion. Each time the random gene list Bj of size N (equal to the size of the input list) is generated. The network inference pro-cedure described above is applied to the list Bj and the net-work models D1j, D2j, D3j are inferred. Let us denote the number of genes from the random list Bj in the inferred net-work models D1j, D2j, D3j as R1j, R2j, R3j. Thus, after repeating
k times the simulation procedure, we get the background dis-tribution R1j(j = 1..k) for model D1, the background distribu-tion R2j(j = 1..k) for model D2 and the background distribution R3j(j = 1..k) for model D3.
To estimate the significance of the inferred network model D1
for the input gene list, the value S1 is compared to the distri-bution R1j. Let n be the number of values from the distribution
R1j that are equal or greater than S1. The estimate of the p -value p of the inferred network model D1 is computed as p = (n + 1)/k. In the same way, the p-values for models D2 and D3
are computed using values S2 and S3 and background distri-butions R2j and R3j. In other words, the p-value is estimated as a share of random simulations where the size of the inferred models for a random gene list (size N) are equal to or greater than the size (S1, S2, S3) of the inferred models for input gene list (size N).
Abbreviations
KEGG: Kyoto Encyclopedia of Genes and Genomes.
Authors' contributions
AAV conceived of the study and developed software, analyzed the data and drafted the manuscript. SD developed a web tool, analyzed the data and drafted the manuscript. HWM conceived of the study, and participated in its design and coordination. All the authors read and approved the final manuscript.
Additional data files
The following additional data files are available with the online version of this paper. Additional data file 1 is a full comparison of KEGG spider to KEGG atlas.
Additional data file 1
Acknowledgements
We thank Philip Wong for helpful discussions.
References
1. Shi Q, Bao S, Song L, Wu Q, Bigner DD, Hjelmeland AB, Rich JN: Targeting SPARC expression decreases glioma cellular sur-vival and invasion associated with reduced activities of FAK and ILK kinases. Oncogene 2007, 26:4084-4094.
2. Perroud B, Lee J, Valkova N, Dhirapong A, Lin PY, Fiehn O, Kultz D, Weiss RH: Pathway analysis of kidney cancer using proteom-ics and metabolic profiling. Mol Cancer 2006, 5:64.
3. Marquez RT, Baggerly KA, Patterson AP, Liu J, Broaddus R, Frumovitz M, Atkinson EN, Smith DI, Hartmann L, Fishman D, Berchuck A, Whitaker R, Gershenson DM, Mills GB, Bast RC Jr, Lu KH: Patterns of gene expression in different histotypes of epithelial ovar-ian cancer correlate with those in normal fallopovar-ian tube, endometrium, and colon. Clin Cancer Res 2005, 11:6116-6126. 4. Loscalzo J, Kohane I, Barabasi AL: Human disease classification in
the postgenomic era: a complex systems approach to human pathobiology. Mol Syst Biol 2007, 3:124.
5. Liu N, Song W, Wang P, Lee K, Chan W, Chen H, Cai Z: Proteom-ics analysis of differential expression of cellular proteins in response to avian H9N2 virus infection in human cells. Pro-teomics 2008, 8:1851-1858.
6. Beer DG, Kardia SL, Huang CC, Giordano TJ, Levin AM, Misek DE, Lin L, Chen G, Gharib TG, Thomas DG, Lizyness ML, Kuick R, Haya-saka S, Taylor JM, Iannettoni MD, Orringer MB, Hanash S: Gene-expression profiles predict survival of patients with lung ade-nocarcinoma. Nat Med 2002, 8:816-824.
7. Antonov AV, Mewes HW: Complex functionality of gene groups identified from high-throughput data. J Mol Biol 2006, 363:289-296.
8. Antonov AV, Schmidt T, Wang Y, Mewes HW: ProfCom: a web tool for profiling the complex functionality of gene groups identified from high-throughput data. Nucleic Acids Res 2008:W347-351.
9. Khatri P, Bhavsar P, Bawa G, Draghici S: Onto-Tools: an ensemble of web-accessible, ontology-based tools for the functional design and interpretation of high-throughput gene expres-sion experiments. Nucleic Acids Res 2004, 32:W449-W456. 10. Khatri P, Draghici S: Ontological analysis of gene expression
data: current tools, limitations, and open problems. Bioinfor-matics 2005, 21:3587-3595.
11. Khatri P, Sellamuthu S, Malhotra P, Amin K, Done A, Draghici S: Recent additions and improvements to the Onto-Tools. Nucleic Acids Res 2005, 33:W762-W765.
12. Martin D, Brun C, Remy E, Mouren P, Thieffry D, Jacq B: GOTool-Box: functional analysis of gene datasets based on Gene Ontology. Genome Biol 2004, 5:R101.
13. Masseroli M, Martucci D, Pinciroli F: GFINDer: Genome Function INtegrated Discoverer through dynamic annotation, statisti-cal analysis, and mining. Nucleic Acids Res 2004, 32:W293-W300. 14. Reimand J, Kull M, Peterson H, Hansen J, Vilo J: g:Profiler - a web-based toolset for functional profiling of gene lists from large-scale experiments. Nucleic Acids Res 2007, 35:W193-W200. 15. Berriz GF, King OD, Bryant B, Sander C, Roth FP: Characterizing
gene sets with FuncAssociate. Bioinformatics 2003, 19:2502-2504.
16. Antonov AV, Mewes HW: Complex phylogenetic profiling reveals fundamental genotype-phenotype associations. Com-put Biol Chem 2008, 32:412-416.
17. Doniger SW, Salomonis N, Dahlquist KD, Vranizan K, Lawlor SC, Conklin BR: MAPPFinder: using Gene Ontology and Gen-MAPP to create a global gene-expression profile from microarray data. Genome Biol 2003, 4:R7.
18. Pandey R, Guru RK, Mount DW: Pathway Miner: extracting gene association networks from molecular pathways for pre-dicting the biological significance of gene expression micro-array data. Bioinformatics 2004, 20:2156-2158.
19. Goffard N, Weiller G: PathExpress: a web-based tool to iden-tify relevant pathways in gene expression data. Nucleic Acids Res 2007, 35:W176-W181.
20. Adler P, Reimand J, Janes J, Kolde R, Peterson H, Vilo J: KEGGanim: pathway animations for high-throughput data. Bioinformatics 2008, 24:588-590.
21. Reimand J, Tooming L, Peterson H, Adler P, Vilo J: GraphWeb: mining heterogeneous biological networks for gene modules with functional significance. Nucleic Acids Res 2008:W452-459. 22. Letunic I, Yamada T, Kanehisa M, Bork P: iPath: interactive
explo-ration of biochemical pathways and networks. Trends Biochem Sci 2008, 33:101-103.
23. Okuda S, Yamada T, Hamajima M, Itoh M, Katayama T, Bork P, Goto S, Kanehisa M: KEGG Atlas mapping for global analysis of met-abolic pathways. Nucleic Acids Res 2008, 36:W423-W426. 24. Rahnenfuhrer J, Domingues FS, Maydt J, Lengauer T: Calculating
the statistical significance of changes in pathway activity from gene expression data. Stat Appl Genet Mol Biol 2004, 3:. Article16
25. Draghici S, Khatri P, Tarca AL, Amin K, Done A, Voichita C, Geor-gescu C, Romero R: A systems biology approach for pathway level analysis. Genome Res 2007, 17:1537-1545.
26. KEGG Spider [http://mips.gsf.de/proj/keggspider]
27. Wheeler DL, Barrett T, Benson DA, Bryant SH, Canese K, Chetvernin V, Church DM, DiCuccio M, Edgar R, Federhen S, Geer LY, Helmberg W, Kapustin Y, Kenton DL, Khovayko O, Lipman DJ, Madden TL, Maglott DR, Ostell J, Pruitt KD, Schuler GD, Schriml LM, Sequeira E, Sherry ST, Sirotkin K, Souvorov A, Starchenko G, Suzek TO, Tatusov R, Tatusova TA, Wagner L, Yaschenko E: Database resources of the National Center for Biotechnology Infor-mation. Nucleic Acids Res 2006, 34:D173-D180.
28. Wheeler DL, Barrett T, Benson DA, Bryant SH, Canese K, Chetvernin V, Church DM, DiCuccio M, Edgar R, Federhen S, Geer LY, Kapustin Y, Khovayko O, Landsman D, Lipman DJ, Madden TL, Maglott DR, Ostell J, Miller V, Pruitt KD, Schuler GD, Sequeira E, Sherry ST, Sirotkin K, Souvorov A, Starchenko G, Tatusov RL, Tatus-ova TA, Wagner L, Yaschenko E: Database resources of the National Center for Biotechnology Information. Nucleic Acids Res 2007, 35:D5-12.
29. Birney E, Andrews D, Caccamo M, Chen Y, Clarke L, Coates G, Cox T, Cunningham F, Curwen V, Cutts T, Down T, Durbin R, Fernandez-Suarez XM, Flicek P, Graf S, Hammond M, Herrero J, Howe K, Iyer V, Jekosch K, Kahari A, Kasprzyk A, Keefe D, Kokocinski F, Kulesha E, London D, Longden I, Melsopp C, Meidl P, Overduin B, et al.: Ensembl 2006. Nucleic Acids Res 2006, 34:D556-D561.
30. Pruitt KD, Tatusova T, Maglott DR: NCBI reference sequences (RefSeq): a curated non-redundant sequence database of genomes, transcripts and proteins. Nucleic Acids Res 2007, 35:D61-D65.
31. Liu G, Loraine AE, Shigeta R, Cline M, Cheng J, Valmeekam V, Sun S, Kulp D, Siani-Rose MA: NetAffx: Affymetrix probesets and annotations. Nucleic Acids Res 2003, 31:82-86.
32. Hooper SD, Bork P: Medusa: a simple tool for interaction graph analysis. Bioinformatics 2005, 21:4432-4433.
33. Shannon P, Markiel A, Ozier O, Baliga NS, Wang JT, Ramage D, Amin N, Schwikowski B, Ideker T: Cytoscape: a software environment for integrated models of biomolecular interaction networks. Genome Res 2003, 13:2498-2504.
34. Carmona-Saez P, Chagoyen M, Tirado F, Carazo JM, Pascual-Montano A: GENECODIS: a web-based tool for finding significant con-current annotations in gene lists. Genome Biol 2007, 8:R3. 35. Jinawath N, Furukawa Y, Hasegawa S, Li M, Tsunoda T, Satoh S,
Yamaguchi T, Imamura H, Inoue M, Shiozaki H, Nakamura Y: Com-parison of gene-expression profiles between diffuse- and intestinal-type gastric cancers using a genome-wide cDNA microarray. Oncogene 2004, 23:6830-6844.
36. Nabetani T, Tabuse Y, Tsugita A, Shoda J: Proteomic analysis of livers of patients with primary hepatolithiasis. Proteomics 2005, 5:1043-1061.
37. Examples, KEGG spider [http://mips.gsf.de/proj/keggspider/ example.KEGG.html]
38. Ingenuity Pathway Analysis Software [http://www.ingenu ity.com/products/pathways_analysis.html]
39. Westfall PN, Young SS: Resampling-based Multiple Testing: Examples and Methods for p-Value Adjustment New York: John Wiley & Sons; 1993.
40. Craven RA, Stanley AJ, Hanrahan S, Dods J, Unwin R, Totty N, Harn-den P, Eardley I, Selby PJ, Banks RE: Proteomic analysis of primary cell lines identifies protein changes present in renal cell car-cinoma. Proteomics 2006, 6:2853-2864.
2006, 6:3210-3222.
42. Lu Z, Hu L, Evers S, Chen J, Shen Y: Differential expression pro-filing of human pancreatic adenocarcinoma and healthy pan-creatic tissue. Proteomics 2004, 4:3975-3988.
43. Morita A, Miyagi E, Yasumitsu H, Kawasaki H, Hirano H, Hirahara F: Proteomic search for potential diagnostic markers and ther-apeutic targets for ovarian clear cell adenocarcinoma. Pro-teomics 2006, 6:5880-5890.
44. Okamura N, Masuda T, Gotoh A, Shirakawa T, Terao S, Kaneko N, Suganuma K, Watanabe M, Matsubara T, Seto R, Matsumoto J, Kawakami M, Yamamori M, Nakamura T, Yagami T, Sakaeda T, Fuji-sawa M, Nishimura O, Okumura K: Quantitative proteomic anal-ysis to discover potential diagnostic markers and therapeutic targets in human renal cell carcinoma. Proteomics 2008, 8:3194-3203.
45. Bianchi L, Canton C, Bini L, Orlandi R, Menard S, Armini A, Cattaneo M, Pallini V, Bernardi LR, Biunno I: Protein profile changes in the human breast cancer cell line MCF-7 in response to SEL1L gene induction. Proteomics 2005, 5:2433-2442.
46. Shin JH, Gulesserian T, Verger E, Delabar JM, Lubec G: Protein dys-regulation in mouse hippocampus polytransgenic for chro-mosome 21 structures in the Down syndrome critical region. J Proteome Res 2006, 5:44-53.
47. Fillet M, Cren-Olive C, Renert AF, Piette J, Vandermoere F, Rolando C, Merville MP: Differential expression of proteins in response to ceramide-mediated stress signal in colon cancer cells by 2-D gel electrophoresis and MAL2-DI-TOF-MS. J Proteome Res 2005, 4:870-880.
48. Yu Y, Wang LS, Shen SM, Xia L, Zhang L, Zhu YS, Chen GQ: Subcel-lular proteome analysis of camptothecin analogue NSC606985-treated acute myeloid leukemic cells. J Proteome Res 2007, 6:3808-3818.
49. Kang JH, Park KK, Lee IS, Magae J, Ando K, Kim CH, Chang YC: Pro-teome analysis of responses to ascochlorin in a human oste-osarcoma cell line by 2-D gel electrophoresis and MALDI-TOF MS. J Proteome Res 2006, 5:2620-2631.
50. Chen YR, Juan HF, Huang HC, Huang HH, Lee YJ, Liao MY, Tseng CW, Lin LL, Chen JY, Wang MJ, Chen JH, Chen YJ: Quantitative proteomic and genomic profiling reveals metastasis-related protein expression patterns in gastric cancer cells. J Proteome Res 2006, 5:2727-2742.
51. Gonzalez-Santiago L, Alfonso P, Suarez Y, Nunez A, Garcia-Fernandez LF, Alvarez E, Munoz A, Casal JI: Proteomic analysis of the resist-ance to aplidin in human cresist-ancer cells. J Proteome Res 2007, 6:1286-1294.
52. Melle C, Ernst G, Scheibner O, Kaufmann R, Schimmel B, Bleul A, Settmacher U, Hommann M, Claussen U, von EF: Identification of specific protein markers in microdissected hepatocellular carcinoma. J Proteome Res 2007, 6:306-315.
53. Santos AD, Demaugre F: Contribution of laser microdissection-based technology to proteomic analysis in hepatocellular carcinoma developing on cirrhosis. Proteomics Clin Appl 2007, 1:545-554.
54. Hoelzl C, Lorenz O, Haudek V, Gundacker N, Knasmüller S, Gerner C: Proteome alterations induced in human white blood cells by consumption of Brussels sprouts: Results of a pilot inter-vention study. Proteomics Clin Appl 2008:108-117.