International Journal of Emerging Technology and Advanced Engineering
Website: www.ijetae.com(ISSN 2250-2459,ISO 9001:2008 Certified Journal, Volume 5, Issue 4, April 2015)
374
Feedback Effects Analysis of Traffic Information Based on
Bayesian Theory
Xin Wang
Science College, Beijing Information Science Technology University, Beijing, China
Abstract—The feedback effects of ATIS information for
helping travelers choose optimal routes are researched. We build a dynamic route choice model for ATIS; analyze the adjustment and renewal process of travel route decision based on Bayesian method and logit choice model. Furthermore, through comparing whether can obtain ATIS information for users, the route choice rules are designed and practical simulation are carried out. Then an evolution algorithm is provided and the link flows and path flows on this network are simulated to analyze the process of user equilibrium when the parameters of the network are changed. The results show that the feedback effects of ATIS are significant when extreme accidents happen in the network. Comparing with no ATIS information, path flows can achieve stability in a shorter time period by combining the individual past experience and practical traffic status.
Keywords—ATIS, Bayesian theory, optimal path, route choosing behaviour, user equilibrium
I. INTRODUCTION
The route choosing behavior is affected by multiple factors, such as the travel experience of the users, actual road conditions, etc. It is the concerned problem for travelers to find an optimal route. In recent years, advanced traveler information systems (ATIS) which can provide abundant traffic dictate and information for travelers has received a considerable attention. The information transmission can effectively reduce the traffic jam, decrease the sojourn time of vehicles in the transportation network, and be helpful to reasonably distribute traffic flow.
Shi (2002) studies the effect of ATIS in the route choosing behavior of the users based on a dynamic choosing model. Wu and Huang (2003) investigate the impacts caused by travel information systems on traffic behavior, and analyze how the parameter of the logit-based stochastic model affects the average individual travel cost, and how the information system induce potential traffic demand. Liu (2007, 2008) designs the evolution rules of day-to-day route choice behavior considering risk aversion and perception updating based on stochastic equilibrium model, and considers multi-agent simulation on the day-to day route choice behavior.
Huang and Li (2007) propose the class and multi-criteria traffic equilibrium assignment model under ATIS, which hypothesis is closer to reality. Guo and Huang (2008) propose a fixed point model which is equivalent to the stochastic user equilibrium conditions to study the effects of information and the adjustment process of day-to-day route choosing; they design a heuristic algorithm to solve the model based on successive average method and logit traffic flow assignment. Fan, Li and Jiang (2009) present a novel model based on reference-dependent approach and propose a day-to-day evolution model of route choice. The model was solved by a heuristic solution algorithm combining the method of successive averages with logit assignment technique.
We construct a dynamic model of route choosing under ATIS information inducing condition, and consider a small transportation network under fixed demand of OD (Origin-Destination) pair. The flow of each path is simulated to analyze the process of user equilibrium with different parameters of the network. Furthermore, the path choosing and adjustment processes are compared to reflect the feedback effect of ATIS for helping travelers to choose optimal path.
II. SYMBOL DEFINITION
Consider a traffic network represented by a directed graph G( , )N A , where N is the set of nodes and A is the set of links in the network. Let W be the set of all OD pairs and Rw be the set of paths which connect OD pair
w W
.
The travel time function of link, t v t va( ) ( )a a a , isassumed to be an increasing and strictly convex function of link flow:
w
a kw ak
w W k R
v f
, here fkw is the path flow on path k between OD pair ; ak is an indicator equal to 1 if path k passes link a on between OD pair w, and zero otherwise.In the road network, the travel time of users on path r is given by ( )
kw a a ak
a A
c t v
International Journal of Emerging Technology and Advanced Engineering
Website: www.ijetae.com(ISSN 2250-2459,ISO 9001:2008 Certified Journal, Volume 5, Issue 4, April 2015)
375
( )
a a ak w
a A
t v
, if k R w Ww, (1)( )
a a ak w
a A
t v
, if k R w Ww, (2)The conditions (1) and (2) imply that, at the equilibrium, for each given OD pair, the travel cost on any path with positive flow must equal a constant w; otherwise it is greater than or equal to w, where min
w
w k R ckw
is
the minimum travel time at between OD pair w. These conditions are satisfying Wardrop's user equilibrium principle.
We suppose all users are rational, and they make their route choice decision based on the forecast of the minimum travel time. According with the representation of factual traffic conditions, the scenarios of analysis contemplate two possibilities: users equipped with ATIS are informed about the actual traffic status and they are therefore able to base their route choosing decision on real time travel information and their own travel experience; for the users unequipped with ATIS, in contrast, base their behavior only on personal travel experience in these routes.
The paper simulates the route making-decision adjustment of two types of users and the change process of link flow and path flow. The results obtained are indicative for the effect of information in more realistic networks.
With respect to the complicated reasons of travel fluctuation, we suppose that:
1.There is no non-recurrent congestion in the network; 2.Users in the network are unchanged;
3.The number of users in each link is no more than the capacity of link.
If the users do not equipped with the ATIS and could not achieve the real time travel information, they will forecast the travel time and make the route choosing decision by personal travel experience. On the other hand, if users are informed, then they are assumed to know the actual state of routes. Then informed users make their trip decision based on their travel experience and real time information of using a route in the network. Furthermore, once the traveler has become aware of the actual travel time on one path, he(she) will update his(her) forecast time of this path in the next day.
Hence, according to whether information is available, define random variables be
, , ,
, , ,
i d i d i d
j k j k j k
T u ( j1, 2, , 6;i1, 2) as the forecast travel time on path k in day d for the useri, and the meaning of each symbol is as follows:
, 1,
i d k
T : the forecast travel time only by personal travel experience.
, 2,
i d k
T : the forecast travel time only by the actual travel time on path k in previous day.
, 3,
i d k
T : the forecast travel time by the combining of personal experience and the actual travel time on path k in previous day.
, 4,
i d k
T : the forecast travel time only by the real time ATIS information. Because there are the same ATIS information achieved by all users, namely ,
4,
i d k T 4,
d k T . , 5, i d k
T : the updating of , , 1,
i d t k
T , namely the forecast travel time by the combining of personal experience and the real time ATIS information.
, 6,
i d k
T : the updating of , 3,
i d k T .
Here, ui dj k,, ( j1, 2, , 6) is expectation of the variable
, ,
i d j k
T ( j1, 2, , 6), and error component , , , ~ (0, , )
i d i d
j k N j k
( j1, 2, , 6) reflects an individual-specific inclination to confidence level to corresponding forecast travel time in the transport network.
III. MODEL CONSTRUCTION
According to the above definition and Bayesian theory:
, , , ,
1, 2, 2, 1, ,
3, , ,
1, 2,
i d i d i d i d
k k k k
i d
k i d i d
k k
u u
u
(3)
, , 1, 2, ,
3, , ,
1, 2,
i d i d
k k
i d
k i d i d
k k
(4)
Eq.(3) denotes that u3,i d,k is the weighted mean of predicting travel time by personal past experience and actual travel time in day d1. Eq.(4) indicates that ,
3,
i d k
is
less than 1,i d,k and 2,i d,k, namely the confidence level of updated forecast time ,
3,
i d k
u is greater than , 1,
i d k
u and , 2,
International Journal of Emerging Technology and Advanced Engineering
Website: www.ijetae.com(ISSN 2250-2459,ISO 9001:2008 Certified Journal, Volume 5, Issue 4, April 2015)
376
, , ,
3, 4, 4, 3, ,
6, , ,
3, 4,
d i d i d i d
k k k k
i d
k i d i d
k k
u u
u
(5)
, , 3, 4, ,
6, , ,
3, 4,
i d i d
k k
i d
k i d i d
k k
(6)
It can be indicated by Eq. (6) that , 6,
i d k
is less than , 3,
i d k
or , 4,
i d k
. As the updating result of , 3,
i d k u , ,
6,
i d k
u can be the optimal forecast travel time in the next day, namely
, 1 ,
1, 6,
i d i d
k k
u u (7)
, 1 ,
1, 6,
i d i d
k k
(8)
If there is longer travel time spending on one path, the users will obtain less utility. Then, we assume that the utility function of user i choosing path k in day d can be described as
, ,
,
i d i d
k j k
R u , j3, 6 (9)
Where the parameter 0 reflect the stochastic degree of path choice of users, and is smaller, the user has greater stochastic degree of path choice. i d,
k
R is the utility of users without ATIS or the utility of users with ATIS, respectively, when j3 or j6.
We model the probability Pki d, that the individual i
choose the path kin day d, then
, ,
,
,
/
i d i d
k k
w
R R
i d k
k R w W
P e e
(10)IV. NUMERICAL EXPERIMENT
This section analyses the adjustment of choosing path behavior and evolution of path flow via the numerical experiment.
The network consists of 9 nodes, 12 links, 6 paths and unique OD pair. It is assumed that the demand is 600 and the travel time functions for the links are in a form of the BPR function, 0 4
(1.0 0.15( / ) )
a a a a
t t x C .
Figure 1. Diagram for six links network.
TABLE I
THE FREE FLOW TIME ta0AND CAPACITY OF Ca ALL LINKS
Links 0
a
t Ca Links
0
a
t Ca
(1, 2) 1 30 (1, 4) 1 30 (2, 3) 1 10 (2, 5) 1 20 (4, 5) 1 20 (3, 6) 1 10 (5, 6) 1 20 (4, 7) 1 10 (7, 8) 1 10 (5, 8) 1 20 (8, 9) 1 30 (6, 9) 1 30
A. The Flow of User Equilibrium
In this paper, a solution scheme which combines Frank-Wolfe algorithm with the logit assignment is developed. The step-by-step procedure of this scheme is given below.
Step 0. For given the free flow time 0
a
t , a A , perform the all-or-nothing assignment and get the link flow
1
a
f , a A, and set the iteration counter n1.
Step 1. According to the current link flows 1
a
f , a A, update the link travel time tan ta
fan , a A.Step 2. Perform the all-or-nothing assignment in terms of the current link travel disutility n
a
t , a A, then get route flows and the auxiliary link flows n
a
y , a A.
Step 3. Update link flows by n 1 n 1
n n
a a a a
f f y f
n
,
a A
.
Step 4. If a certain equilibrium criterion
21
n n
a a
a n a a
f f
f
International Journal of Emerging Technology and Advanced Engineering
Website: www.ijetae.com(ISSN 2250-2459,ISO 9001:2008 Certified Journal, Volume 5, Issue 4, April 2015)
377
Let105, and the equilibrium path flow and link flow
are reached at n37269. Table 2 and Table 3 show the results obtained for user equilibrium.
TABLEII
THE FLOW OF ALL LINKS AT EQUILIBRIUM
Link Flow Link Flow
(1, 2) 300.00805 (4, 7) 99.99195
(1, 4) 299.99195 (5, 6) 200
(2, 3) 100.00805 (5, 8) 200
(2, 5) 200.00805 (6, 9) 300.00805
(3, 6) 100.00805 (7, 8) 99.99195
(4, 5) 200 (8, 9) 299.99195
TABLEIII
THE FLOW OF ALL PATHS AT EQUILIBRIUM
Path Nodes Flow
1 1-2-3-6-9 100.00805
2 1-2-5-6-9 100
3 1-2-5-8-9 100
4 1-4-5-6-9 100
5 1-4-5-8-9 100
6 1-4-7-8-9 99.99195
In the following, we will stimulate the flow of path 1 (1-2-3-6-9) as example. For making our experiments be more representative, i.e., covering more possible situations, we should carefully design the values of some parameters in the proposed model for explaining the effect of ATIS.
B. The Evolution of Path Flow without ATIS Information
Let the initial value of ,1 1,
i k
u be 1.15, 1,d / 2,d
k k
, the specific algorithm is as follows:
Step 0. Set the initial value of path choosing probilityPki d, , k1, 2, , 6, compared confidence, and the utility parameter.
Step 1. Generate the random number i[0,1], and let the user i choose the path k if
1
, ,
1 1
k k
i d i d
j i j
j j
P P
,1, 2, , 6
k .
Step 2. Calculate the path flow fk,k1, 2, , 6, and the link flow va, a1, 2,...,12.
Step 3. Calculate the link travel time
0(1.0 0.15( / ) )4
a a a a
t t v C and the path travel time
( )
k ak a a
a A
c t v
, k1, 2, , 6.Step 4. Let u2,i d,k ck , k1, 2, , 6 , and get
, ,
1, 2,
, 3,
1
i d i d
k k
i d k
u u
u
according to (3).
Step 5. Let u1,i d,k1u3,i d,k, k1, 2, , 6, and update the choosing probability i d,
k
P by Eq.(10). If Eq.(1) and Eq.(2) are satisfied, stop and report the solution; otherwise, go to Step 1.
The effect that ATIS and personal travel experience have over the path choosing decision for different stochastic degree of path choice is expressed by different value of parameter, which is calculated as:
Case 1. Suppose the initial values of i,1( 1, 2,..., 6)
k P k
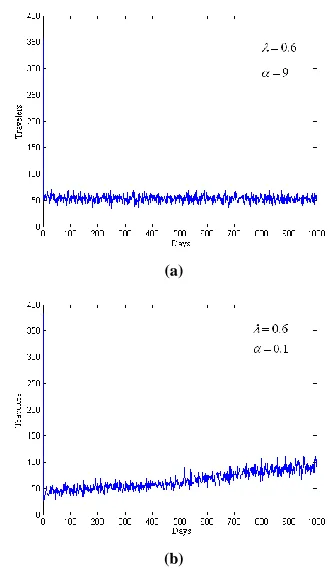
are 0.6, 0.3, 0.1, 0, 0, 0. Fig. 2(a) and Fig.2(b) depict the flow evolution of path 1 with different compared confidence
in 1000 days.(a)
[image:4.612.44.292.182.423.2](b)
[image:4.612.357.521.399.683.2]International Journal of Emerging Technology and Advanced Engineering
Website: www.ijetae.com(ISSN 2250-2459,ISO 9001:2008 Certified Journal, Volume 5, Issue 4, April 2015)
378
It can be seen that as the confidence of personal experience is much higher than the confidence of actual travel time in previous day, namely0.1, the flow of path 1 can achieve the stable state in 1000 days; on the contrary, the flow of path 1 is maintaining the level of 50 persons when 9. In fact, that ,1
1
i
P = 0.6 in this example has already represented a very high choosing probability, so there is traffic jam of this path on the first day. If the users excessively believe the actual travel time in previous day, then the number of users in path 1 will decrease rapidly.
[image:5.612.364.521.302.583.2]Case 2. Suppose the initial values of Pki,1(k1, 2,..., 6) are 1, 0, 0, 0, 0, 0, Fig.3 depicts the flow evolution of path 1 with 0.1 in 1000 days.
Figure 3. Flow diagram of path 1for 0.1 and0.1.
When 0.1, the randomness of choosing path is very high. 0.1 represents that the confidence of person experience is higher than the confidence of travel time in previous day, so the flow of path 1 gradually achieve the stable sate after a long time.
Case 3. Suppose 0.6 and the initial values of
,1
( 1, 2,..., 6)
i k
P k are 1, 0, 0, 0, 0, 0. In this case, whether 0.1
or9, the flow of path 1 is 600 on the first day and 0 thereafter. This result shows that the path choosing decision will be greatly influenced quite long time if there is sudden extreme condition in network, such as traffic accident, etc.
1) The Evolution of Path Flow with ATIS Information
Finally, we compare the path flow evolution generated by the above model with ATIS. Let parameter
3, / 4,
d d
k k
, and we change the solution scheme without information as follows:
Step 4. Get
, ,
3, 4,
, 6,
1
i d i d
k k
i d k
u u
u
.
Step 5. Let , 1 ,
1, 6,
i d i d
k k
u u , k1, 2, , 6, and update the choosing probability i d,
k
P by Eq.(11). If Eq.(2) and Eq.(3) are satisfied, stop and report the solution; otherwise, go to Step 1.
The simulation results are as follows:
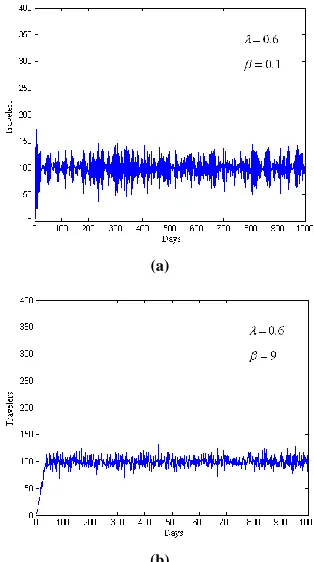
Case 4. Suppose the initial values of Pki,1(k1, 2,..., 6) are 0.6, 0.3, 0.1, 0, 0, 0, Fig.4(a) and Fig.4(b) show the flow evolution of path 1 with compared confidence
0.1
and 9in 1000 days, respectively.
(a)
[image:5.612.80.248.319.444.2](b)
Figure 4. Flow diagram of path 1 for different parameter .
Case 5. Suppose the initial values of i,1( 1, 2,..., 6)
k
P k .
International Journal of Emerging Technology and Advanced Engineering
Website: www.ijetae.com(ISSN 2250-2459,ISO 9001:2008 Certified Journal, Volume 5, Issue 4, April 2015)
379
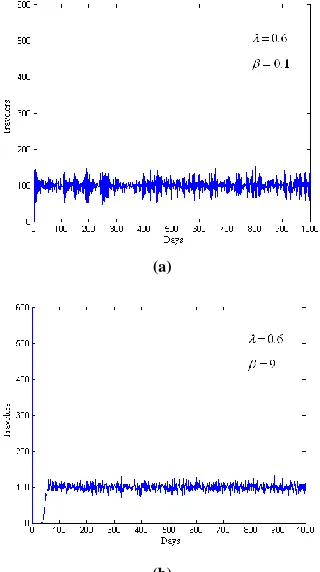
(a)
[image:6.612.87.247.143.429.2](b)
Figure 5. Flow diagram of path 1for different , the initial value of
,1 1
i
P equals 1.
Contrary to the previous case, Fig.4(a) and Fig.5(a) show that the users can make timely adjustment on path choosing decision and take wise determination to stable state rapidly in face of extreme traffic conditions (the path flow is 600 on the first day) if they have higher confidence level of ATIS information. According with the analysis shown in Fig.4(b) and Fig.5(b), the users will take longer time to adjust the forecast travel time if they have lower confidence level of ATIS information. In addition, there are the reforming phenomena of path flow in Fig.4(a) and Fig.5(a). This is mainly because the users on this path are numerous on the first day so that many users who are equipped with ATIS are inclined to give up this path. Thus, it shows that the number of users on this path has descended subsequently and repeated fluctuation.
V. CONCLUSION
In this paper, we present a dynamic path choice model under ATIS based on Bayesian theory.
This model can help us gain some insights into the effect of ATIS to the evolution of path flow, which may not be revealed by previously static models. The model designs the updating rule of travel path choosing decision in conjunction with logit assignment, and compares the variation of path flow under equipped with ATIS and without ATIS. The proposed modeling approach provides a useful tool for evaluating the effect of information service on travel behavior at a strategic level. Based on the numerical results, some initial but important findings are obtained: (i) in comparison with making decision under the sole way, the path choosing decision under ATIS combined with travel experience and actual road condition in pervious day is more valuable for rapidly reaching network equilibrium; (ii) if the users over-depend the effect of ATIS services, the network flow will be caused unstable, namely, the user equilibrium could not be reached in a quite long period. The results show that the feedback effect of ATIS is significant for choosing optimal routes and reaching network equilibrium when extreme accident happens in the network. However, if travelers’ dependence on the ATIS information far exceeds the confidence of practical travel experience, the path flow will be unstable.
Acknowledgement
This research was partly supported by grants from Young Elite Program of Beijing (YETP1508) and Science and Technology Project of Beijing Municipal Education Commission (KM201411232019).
REFERENCES
[1] Fan W.B., Li Z. C. and Jiang G.F. 2009. “Modeling of commuters’ day-to-day route choice behaviors based on reference-dependent approach.” Journal of Traffic and Transportation Engineering, 1, 96-108.
[2] Guo R.Y. and Huang H.J. 2008. “Dynamical evolutionary model of traffic assignment under ATIS.” Journal of Management Sciences in China, 2, 12-19.
[3] Huang H.J. and Li Z.C. 2007. “A multi-class, multi-criteria logit-based traffic equilibrium assignment model under ATIS.” European Journal of Operational Research, 3, 1464-1477.
[4] Liu T. L. and Huang H. J. 2007. “Multi-agent simulation on day-to day route choice behavior.” Acta Physica Sinica, 11, 6321-6325.
[5] Liu T. L., Huang H. J. and Chen J. 2008. “Evolution of day-to-day route choice behavior considering risk aversion and perception updating.” Journal of Traffic and Transportation Engineering, 4, 90-94,103.
[6] Shi X.F. 2002. “Study on dynamic choice model for ATIS.” Journal of System Engineering, 3,271-276.