62
Chapter 5 Simulation Scenarios,
Results and Evaluation
5.1 Introduction
The previous chapter described the implementation of a framework, which is simulated using OPNET Modeler software. In order to evaluate the performance of the designed network framework, we have to simulate a network environment within network simulation software, as it is impossible to test the designed network in the real network environment. This chapter will present the simulation scenarios, results and evaluation performance of the framework from the research project comparing it with the standard network. In the area of computer networking research, OPNET Modeler software is widely and reliably used for testing, debugging and performance evaluation of extended protocol and developing networks.
To prove that this framework can reduce handover latency and reduce packet delay within a wireless network, a variety of network scenarios have been produced. Some scenarios were created to measure robustness on the network, some of them for testing about scalability and so on. Every scenario will be compared with the standard network environment.
5.2 Scenario 1: The Performance of Unicast
and Multicast Mechanism
5.2.1 Scenario1: Scenario Description
At first, we evaluated the performance of the unicast and multicast mechanism. The statistical parameters that we focused on are throughput in the links and load at wireless router.
63
YouTube has 320*240 pixel resolution.For the video frame inter-arrival rates can be from 10 up to 30 frames per second [37]. However, the higher the video resolution, the higher the raw video content size, so that means it will affect the bandwidth on the network and packet delays.
In this simulation model, a media server that connects within the network exports the multicast streaming video traffic to the clients. The frame size of video is 128*120 pixels and the video frame inter-arrival rate is 10 frames/sec (fps). In the wireless network, there are four subnets and each subnet has only one wireless router. For the sake of simplicity, we consider that there is only one multicast group in the network. Also, there are fixed and mobile node clients in this scenario. During the simulation, clients can join or leave the multicast group at any time.
5.2.2 Scenario1: Simulation Topology
64
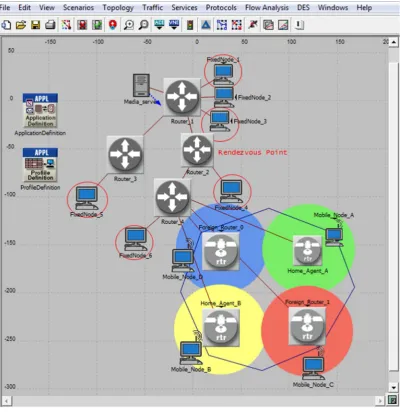
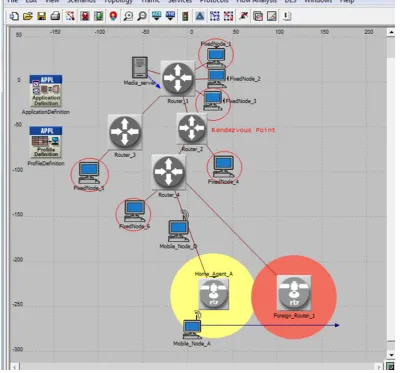
Figure 5-1 Scenario 1: Simulation Topology
In order to examine the performance, we have moved mobile node B and C to connect to the network via Home Agent_A access point. Hence the experiment at this stage is that the mobile nodes A, B and C are connected to Home Agent_A access point and are required to receive the data from the media server.
5.2.3 Scenario1: Simulation Results and
Evaluation
65
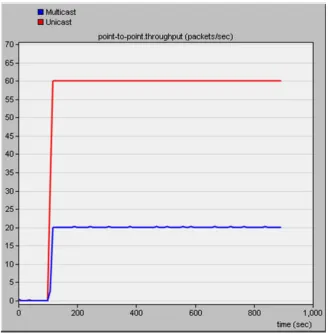
[image:4.595.134.463.132.467.2]correctly to all receivers without any disruptions to the service. The correlation between unicast and multicast are tested. The results are presented in Figure 5-2 and 5-3.
Figure 5-2 Throughputs between Router4 and Home Agent_A access point
66
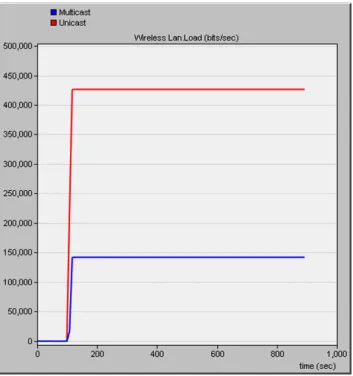
Figure 5-3 Load at Home Agent_A access point
67
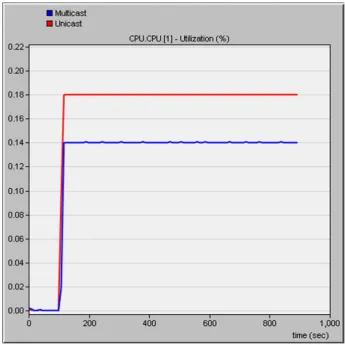
Figure 5-4 CPU Utilization at Home Agent_A access point
68
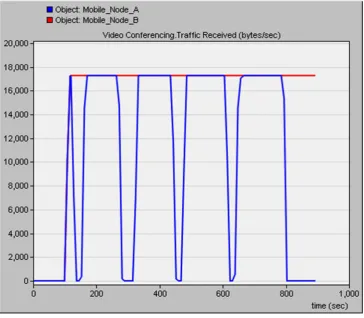
Figure 5-5 Video traffic received at mobile node A compared with B
Figure 5-5 depicts clearly that mobile node B, which is a stationary node, continuously received the multicast traffic until the end of the simulation. On the other hand, mobile node A moves through all four access points, and when handover occurred the traffic received dropped significantly.
In this case, it may completely disconnect the access point from the link layer. Thereafter, it needs to restart the process of performing an IP reconfiguration in the network layer and binding updates to home agent to its infrastructure. Until completion of all these operations the mobile node is likely to experience disruptions or disturbances of application, as the results of packet loss, jitter and delay increase. After the handover process is finished, the node will pick up multicast data again [47].
Thandoff = TL2 + Tlocal-IP + TBU (5-1)
69
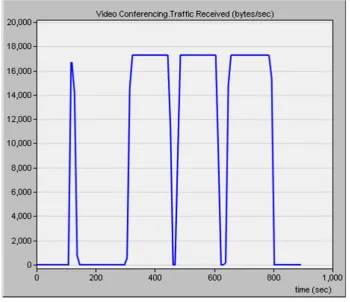
[image:8.595.123.474.176.478.2]during the mobile node mobility procedures, therefore we simulated the following scenario. From Figure 5-1 we move the mobile node D to connect to Home Agent _B access point. Now there is no client in Foreign_Router_1 subnet. The mobile node A still moves in the same path. The result of this scenario is shown in Figure 5-6.
Figure 5-6 Video traffic received at mobile node A
70
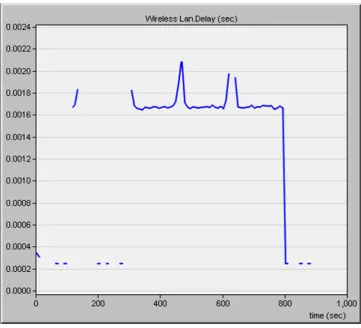
Figure 5-7 Delay at mobile node A
Figure 5-7 is shown the delay on mobile node A. It depicts clearly that the delay increased when the handover process happened. From this result it supports our idea that if we want to reduce the handover process time and also improve the performance, it should have the process of registering the multicast group in advance.
5.3 Scenario 2: Simple Network
5.3.1 Scenario2: Scenario Description
71
5.3.2 Scenario 2: Network Topology
[image:10.595.99.500.344.717.2]The network topology of this scenario still combines the wireline and wireless network. There are two WiFi zones in this topology, which are Home Agent_A and Foreign_Router_1. In Home_Agent_A zone, Mobile_Node_A is a member in this zone. Mobile_Node_A receives multicast data from Media_Server, and then moves to the Foreign_Router_1 zone. During mobility, Mobile_Node_A still continuously receives multicast packets from the Media_Server. In this scenario, there is no function of Mobile IP protocol involved. Figure 5-8 is shown the network topology of this scenario.
72
5.3.3 Scenario2: Simulation Results and
[image:11.595.156.438.194.468.2]Evaluation
Figure 5-9 Scenario 2: Traffic received at Mobile_Node_A
73
5.4 Scenario 3: Mobile IP and multicast
Re-join
5.4.1 Scenario3: Scenario Description
This scenario intends to inspect the effect of Mobile IP protocol when handover occurs. The infrastructure network of scenario 3 is still similar to the previous scenario. However, some parameters might change. In the modified framework, the Mobile IP protocol has been enabled. Also, there it still has the process of multicast re-join in this scenario. The result will be compared with the standard network.
5.4.2
Scenario3:
Simulation
Results
and
Evaluation
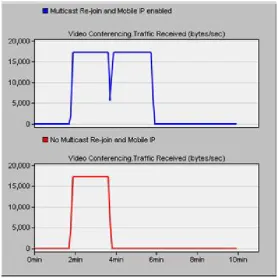
The blue graph in Figure 5-10 is the result of the video conferencing traffic that Mobile_Node_A received. It can be seen that it still has a gap of handover. However, the gap is narrower than in scenario 2 and does not completely lose the connection. This is because Mobile IP protocol has a mobility function to support connection. In the red graph, there are no functions of multicast re-join and Mobile IP was not enabled. Hence, the connection was completely lost in this case.
74
Figure 5-10 Scenario 3: Traffic received at Mobile_Node_A
5.5 Scenario 4: Care of Address in Advance
5.5.1 Scenario4: Scenario Description
75
5.5.2 Scenario4: Simulation Results and
[image:14.595.155.444.162.416.2]Evaluation
Figure 5-11 Scenario 4: Traffic received at Mobile_Node_A
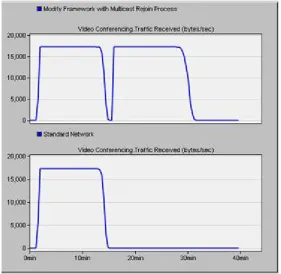
The result is shown that when the foreign agent knows the new member node in advance, it helps to reduce the handover latency time on the network. Also, it increases the performance and throughput on the wireless network. The foreign router will establish the connection earlier, including the process of joining and distributing the multicast tree in advance. Furthermore, the method of binding update will happen before the handover occurs.
5.6 Scenario 5: Same Multicast Group
5.6.1 Scenario5: Scenario Description
76
5.6.2 Scenario5: Network Topology
The network topology of this scenario is slightly different from the previous network. In this infrastructure, the foreign network already has a mobile node, which is a member of the multicast group that Mobile_Node_A wants to join. In Figure 5-12, Mobile_Node_B is already a member of the multicast group from the media server.
[image:15.595.105.490.282.639.2]
77
5.6.3 Scenario5: Simulation Results and
Evaluation
The graph below illustrates that if the foreign network is already a member of the multicast group the handover latency time will be reduced. This is because the new mobile node just deals with IP addressing and then picks up the multicast signal within the network. There are not any methods for multicast communication.
[image:16.595.146.449.265.526.2]
Figure 5-13 Scenario 5: Traffic received at Mobile_Node_A
5.7 Scenario 6: Multi-Hops
5.7.1 Scenario 6: Scenario Description
78
5.7.2 Scenario 6: Network Topology
[image:17.595.110.486.183.503.2]In the new topology, the foreign agent connects to Router_2. However, they are still connecting to the same multicast group.
Figure 5-14 Scenario 6: Network Topology
5.7.3 Scenario 6: Simulation Results and
79
Figure 5-15 Scenario 6: Traffic received at Mobile_Node_A
80
Figure 5-16 Scenario 6: Combined traffic received at Mobile_Node_A
81
Figure 5-17 Is shown how much the extended protocols can reduce handover latency compared with standard protocols
82
Figure 5-18 Is shown how much the extended protocols can reduce packet delay compared with standard protocols
From the network topology in Figure 5-14, the purpose of the current study was to assess packet delay in both networks. The above Figure is shown comparison of the output result of packet end-to-end delay in terms of average. It is apparent from this graph that the packet delays in the modified framework are lower than the original framework. On average the modified framework can reduce packet delay by approximately 3.5 – 10 ms throughout the simulation.
5.8 Scenario 7: Handover
5.8.1 Scenario 7: Scenario Description
83
5.8.2 Scenario 7: Network Topology
[image:22.595.74.523.230.498.2]In this topology when the simulation starts, the Mobile_Node_A is a member of Home_Agent_A and receives multicast data from Media_server. Then Mobile_Node_A starts to move in the direction of the blue arrow from Foreign_Router_1 throughout Foreign_Router_4, as presented in Figure 5-19.
Figure 5-19 Scenario 7: Network Topology
5.8.3 Scenario 7: Simulation Results and
84
Figure 5-20 Scenario 7: Traffic received at Mobile_Node_A
85
Figure 5-21 Scenario 7: Packet delay
Figure 5-21 represents the end-to-end delay of all the data packets that are successfully received by the mobile node. The graph is shown value in terms of average. There is a clear trend of lower packet delay in the design framework throughout the simulation. Further analysis showed that the designed framework reduced packet delay by approximately 0.7-1.5 ms in this scenario.
5.9 Scenario 8: Multiple Networks
5.9.1 Scenario 8: Scenario Description
86
5.9.2 Scenario 8: Network Topology
[image:25.595.88.505.249.656.2]In this topology when the simulation starts, the Mobile_Node_A is a member of Home_Agent_A and receives multicast data from Media_server. Then Mobile_Node_A starts to move with constant speed in the direction of the blue arrow from Home_Agent_A to Foreign_Router_2 and then moves to Foreign_Router_4, as presented in Figure 5-22. There are 7 WiFi zones in this scenario.
87
5.9.3 Scenario 8: Simulation Results and
[image:26.595.110.489.161.437.2]Evaluation
Figure 5-23 Scenario 8: Traffic received at Mobile_Node_A
88
Figure 5-24 Scenario 8: Packet delay
The above figure represents the end-to-end delay on average at the mobile node. Further analysis showed that the designed framework reduced packet delay by approximately 1.5-40 ms in this scenario.
5.10 Scenario 9: Complex Networks
5.10.1 Scenario 9: Scenario Description
89
5.10.2 Scenario 9: Network Topology
[image:28.595.89.506.248.682.2]In this topology when the simulation starts, the Mobile_Node_A is a member of Home_Agent_A and receives multicast data from Media_server. Then Mobile_Node_A starts to move with constant speed in the direction of the blue arrow from Home_Agent_A to Foreign_Router_5 and then moves to Foreign_Router_6, until it stops at Foreign_Router_8 at the end of the simulation, as presented in Figure 5-25.
90
5.10.3 Scenario 9: Simulation Results and
[image:29.595.103.495.162.463.2]Evaluation
Figure 5-26 Scenario 9: Traffic received at Mobile_Node_A
The findings of the current network topology are consistent with the previous scenario that the proposed framework can minimize handover latency time. However, the performance of this framework depends on the structure and topology of the network. It can show that the framework can reduce handover latency time that happen in network and transport layer. But it is still create handover latency time that happen in data link layer.
5.11 Scenario 10: Internet
5.11.1 Scenario 10: Scenario Description
91
internet. In this scenario, the network will be similar to scenario 9, however, Media server and all access points connect to each other and the multicast tree via the internet.
5.11.2 Scenario 10: Network Topology
[image:30.595.90.508.323.744.2]The network topology in this scenario is similar to that of scenario 9. The mobile node moves in the same direction. However, in this scenario the mobile node received multicast data from Media_server via the internet. In Figure 5-27, the IP cloud represents the internet. In the simulation we have created some traffic such as email, www, and ftp traffic etc. within the internet as random traffic to make it more like reality. Moreover, the aim of this scenario is to evaluate the performance of the designed framework when it is a part of the internet.
92
5.11.3 Scenario 10: Simulation Results and
[image:31.595.104.493.197.496.2]Evaluation
Figure 5-28 Scenario 10: Traffic received at Mobile_Node_A
93
Figure 5-29 Scenario 10: Packet Delay