Open Access
Vol 12 No 6Research
Evaluation of SOFA-based models for predicting mortality in the
ICU: A systematic review
Lilian Minne
1, Ameen Abu-Hanna
1and Evert de Jonge
21Department of Medical Informatics, Academic Medical Center, Meibergdreef 9, 1105 AZ, Amsterdam, The Netherlands
2Intensive Care Department, Academic Medical Center, Meibergdreef 9, 1105 AZ, Amsterdam, The Netherlands
Corresponding author: Ameen Abu-Hanna, [email protected]
Received: 29 Oct 2008 Revisions requested: 27 Nov 2008 Revisions received: 12 Dec 2008 Accepted: 17 Dec 2008 Published: 17 Dec 2008
Critical Care 2008, 12:R161 (doi:10.1186/cc7160)
This article is online at: http://ccforum.com/content/12/6/R161 © 2008 Minne et al.; licensee BioMed Central Ltd.
This is an open access article distributed under the terms of the Creative Commons Attribution License (http://creativecommons.org/licenses/by/2.0), which permits unrestricted use, distribution, and reproduction in any medium, provided the original work is properly cited.
Abstract
Introduction To systematically review studies evaluating the performance of Sequential Organ Failure Assessment (SOFA)-based models for predicting mortality in patients in the intensive care unit (ICU).
Methods Medline, EMBASE and other databases were searched for English-language articles with the major objective of evaluating the prognostic performance of SOFA-based models in predicting mortality in surgical and/or medical ICU admissions. The quality of each study was assessed based on a quality framework for prognostic models.
Results Eighteen articles met all inclusion criteria. The studies differed widely in the SOFA derivatives used and in their methods of evaluation. Ten studies reported about developing a probabilistic prognostic model, only five of which used an independent validation data set. The other studies used the SOFA-based score directly to discriminate between survivors and non-survivors without fitting a probabilistic model. In five of the six studies, admission-based models (Acute Physiology and Chronic Health Evaluation (APACHE) II/III) were reported to have a slightly better discrimination ability than SOFA-based models at admission (the receiver operating characteristic curve (AUC) of SOFA-based models ranged between 0.61 and 0.88), and in one study a SOFA model had higher AUC than the Simplified Acute Physiology Score (SAPS) II model. Four of these studies used the Hosmer-Lemeshow tests for calibration,
none of which reported a lack of fit for the SOFA models. Models based on sequential SOFA scores were described in 11 studies including maximum SOFA scores and maximum sum of individual components of the SOFA score (AUC range: 0.69 to 0.92) and delta SOFA (AUC range: 0.51 to 0.83). Studies comparing SOFA with other organ failure scores did not consistently show superiority of one scoring system to another. Four studies combined SOFA-based derivatives with admission severity of illness scores, and they all reported on improved predictions for the combination. Quality of studies ranged from 11.5 to 19.5 points on a 20-point scale.
Conclusions Models based on SOFA scores at admission had only slightly worse performance than APACHE II/III and were competitive with SAPS II models in predicting mortality in patients in the general medical and/or surgical ICU. Models with sequential SOFA scores seem to have a comparable performance with other organ failure scores. The combination of sequential SOFA derivatives with APACHE II/III and SAPS II models clearly improved prognostic performance of either model alone. Due to the heterogeneity of the studies, it is impossible to draw general conclusions on the optimal mathematical model and optimal derivatives of SOFA scores. Future studies should use a standard evaluation methodology with a standard set of outcome measures covering discrimination, calibration and accuracy.
Introduction
The development of the Sepsis-related Organ Failure Assess-ment (SOFA) score was an attempt to objectively and quanti-tatively describe the degree of organ dysfunction over time and to evaluate morbidity in intensive care unit (ICU) septic
patients [1]. Later, when it was realised that it could be applied equally well in non-septic patients, the acronym 'SOFA' was taken to refer to Sequential Organ Failure Assessment [2]. The SOFA scoring scheme daily assigns 1 to 4 points to each of the following six organ systems depending on the level of
function: respiratory, circulatory, renal, haematology, hepatic and central nervous system. Since its introduction, the SOFA score has also been used for predicting mortality, although it was not developed for this purpose.
The aim of this paper was to systematically review, identify research themes and assess studies evaluating the prognostic performance of SOFA-based models (including probabilistic models and simple scores) for predicting mortality in adult patients in medical and/or surgical ICUs.
Materials and methods
Search strategyTwo reviewers independently screened the titles and abstracts of articles obtained by the following search proce-dure. The Scopus database (Jan 1966 to February 2008) was searched for research articles and reviews using the following query: (critical OR intensive) AND (mortality OR survival) AND (sofa OR "sepsis-related organ failure" OR "sepsis related organ failure" OR "sequential organ failure") in title, abstract and keywords.
Scopus comprises, among others, clinical databases such as Medline and Embase. Only English language journal articles were considered. In addition, the references of all included articles as well as articles citing them were screened, and authors were approached about follow-up studies in progress. Follow-up studies were only included if they had already been accepted for publication.
Inclusion criteria
The following inclusion criteria were applied: (1) the study aimed to evaluate a SOFA-based model (probabilistic or as a score); (2) it assessed the statistical performance of the model in terms of accuracy and/or discrimination and/or calibration (studies reporting only on odds ratios and/or standardised mortality ratios were excluded); (3) the predicted outcome of the study was mortality or survival of the patient; and (4) the patient sample was not restricted to a specific diagnosis (e.g. diabetes) but taken from the surgical and/or medical adult ICU population. Two reviewers conducted the search and differ-ences were resolved by consensus after including a third reviewer.
Quality assessment
The quality of the included studies was assessed based on an adaptation of a quality assessment framework for systematic reviews of prognostic studies [3] [see Additional data file 1]. This framework includes the following six areas of potential study biases: study participation; study attrition; measurement of prognostic factors; measurement of and controlling for con-founding variables; measurement of outcomes; and analysis approach. Two reviewers conducted the quality assessment independently from each other and discrepancies were resolved by involving the third reviewer.
Authors were contacted by email to complete missing data that were required for characterising the studies. When the authors did not reply or their answer was still unclear, empty fields were marked with 'Not Reported (NR)'.
Prognostic performance measures
For each included study we describe the reported discrimina-tion of the model (or score) and if available the reported cali-bration and accuracy. Discrimination, usually measured in terms of the Area Under the Receiver Operating Characteris-tic Curve (AUC), refers to a model's ability to assign a higher probability to non-survivors than to survivors. The AUC, how-ever, gives no indication of how close the predicted probabili-ties are to the true ones (estimated by the observed proportion of death). Calibration refers to this agreement between pre-dicted and true probabilities and is most often measured by the Hosmer-Lemeshow H or C goodness-of-fit statistics (these are based on the chi-squared test). These statistics suggest good fit when the associated p values are greater than 0.05, but they are strongly influenced by sample size. Accuracy is a measure of the average distance (residual) between the observed outcome and its predicted probability for each individual patient. A popular accuracy measure is the Brier score, which is the squared mean of the residual values. The Brier score is sensitive to both discrimination as well as calibration of the predicted probabilities.
Results
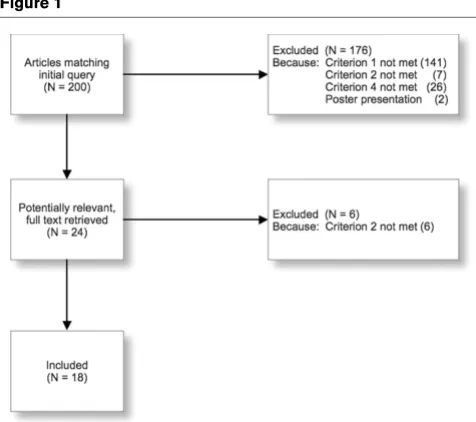
Search results [image:2.612.316.554.490.701.2]Of 200 studies initially identified, 18 met the inclusion criteria and were included in this study (Figure 1). Inter-observer agreement measured by Kappa was 0.94.
Figure 1
Search flow chart
By scanning the reference lists of included articles and those citing them, seven additional articles were rendered potentially relevant. Nevertheless, assessment of their abstracts demon-strated that they did not match our inclusion criteria (six stud-ies did not provide data on discrimination, calibration or accuracy, and one study did not use SOFA to predict mortal-ity).
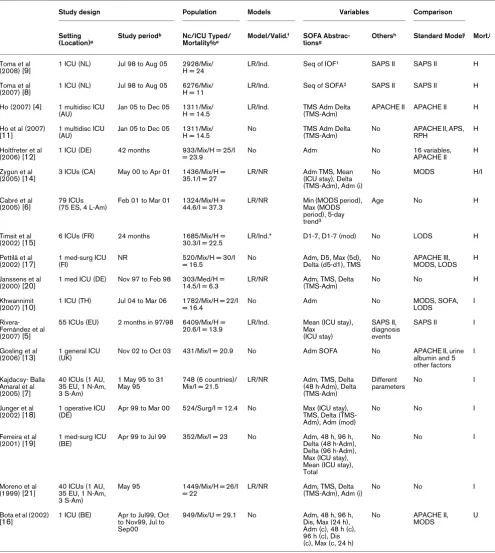
Study characteristics
Table 1 shows the characteristics of the included studies. The studies evaluated different types of SOFA derivatives (e.g. mean, maximum) and compared them with different models and covariates. Six studies combined SOFA with other models or covariates [4-9].
Seventeen studies (94%) measured the AUC [4-7,9-21], four studies (22%) measured the Brier score [4,8,9,11] and six studies (33%) calculated Hosmer-Lemeshow (HL) statistics [4,5,7,11,14,15] (two studies used the C-statistic [4,11], one used the H-statistic [5], one used both [7] and the rest [14,15] did not specify which of the two statistics were used).
Studies were not always clear about the kind of model used to evaluate SOFA. Only 10 studies (56%) reported the use of a logistic regression model [4-9,14,15,20,21]. The models in these studies were fitted on local developmental data sets. Five of these ten studies validated the model on an independ-ent test set [4,5,8,9,15] and five studies did not report how the model was validated [6,7,14,20,21]. Hospital mortality was the outcome in 10 studies [4,6,8,9,11,12,14,15,17,20], ICU mortality in eight studies [5,7,10,13,14,18,19,21] and in one study mortality type was unspecified [16]. One study evalu-ated both ICU and hospital mortality [14].
Missing data
Study characteristics that were most often missing were: type of patient population (surgical/medical/mix); type of model (e.g. logistic regression); and whether the model was validated on the developmental or independent validation set. Emailing the authors confirmed the type of ICU outcome (hospital or ICU mortality) used in one study.
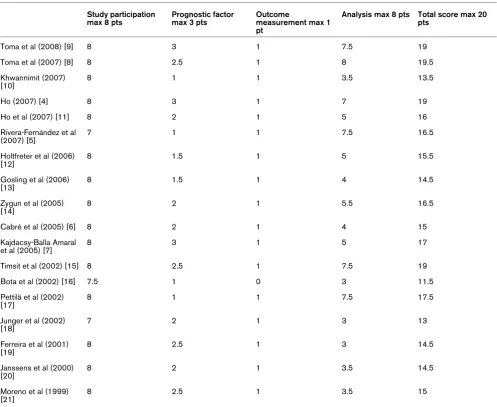
Study quality
We used four of the six main quality aspects in the framework of Hayden and colleagues [3] leaving 'study attrition' (such as loss to follow-up) and 'confounding measurement and account' out. The former is irrelevant in our analysis and the lat-ter falls outside the scope of this review. The maximum quality score is 20. The results of the quality assessment of the included studies are shown in Table 2.
Study results
The cohort size ranged from 303 to 6409 patients. Mean age was 53 to 62 years in complete cohorts and there was a median age of 66 years in one study [15]. The percentage of
males was 52% to 71%. Hospital mortality ranged from 11% to 45% and ICU mortality from 6.3% to 37%.
Studies were heterogeneous in the way they used SOFA. The major themes identified in the evaluation studies were investi-gating the performance of: single SOFA scores at admission or at a fixed time after admission; sequential measurements of SOFA (e.g. mean SOFA score); individual components of SOFA (e.g. cardiovascular component); combination of SOFA with other covariates; and temporal models using patterns dis-covered in the SOFA scores.
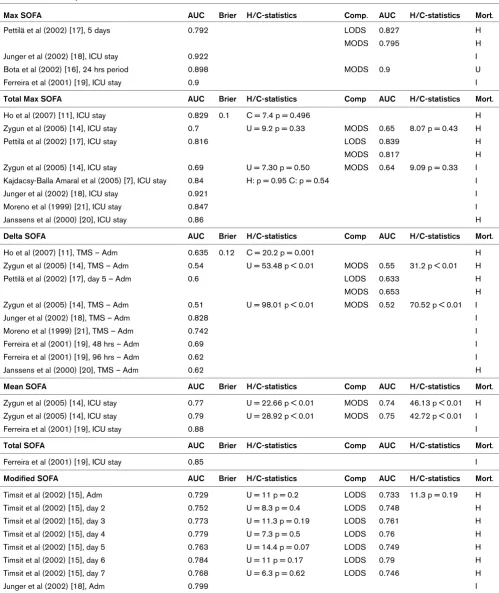
Performance of single SOFA scores at a fixed time on and after admission
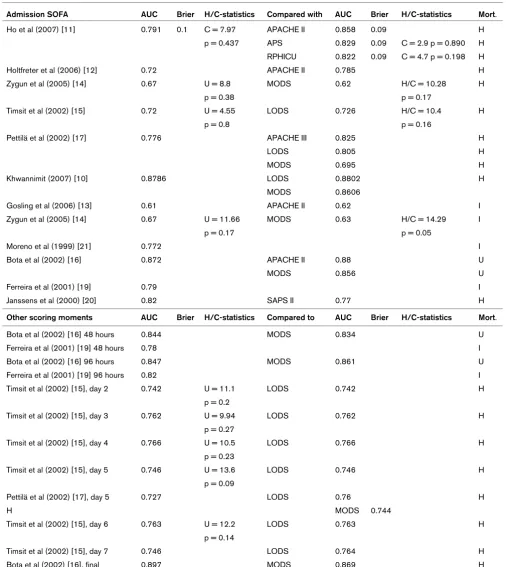
Eleven studies (61%) evaluated the SOFA score on admission (Table 3) [10-17,19-21]. In seven studies, SOFA on admis-sion was calculated using the most abnormal values from the first 24 hours after admission [10,12,14,16,17,19,20]. Dis-crimination, measured by the AUC, ranged between 0.61 and 0.88. P values of HL-statistics ranged from 0.17 to 0.8. Four studies (22%) evaluated SOFA on days other than the day of admission [15-17,19]. In these studies, AUCs ranged between 0.727 and 0.897 and p values of HL-statistics ranged between 0.09 and 0.27 for days 2 to 7 after admission and at the day of ICU discharge. Six studies (33%) compared admission SOFA with traditional admission-based models [11-13,16,17,20]. The comparison is more meaningful in the first four studies [11,12,17,20] which, in line with the admis-sion-based models, were developed to predict hospital mortal-ity. Two of those studies reported that the Acute Physiology And Chronic Health Condition (APACHE) II score had better or slightly better discrimination than admission SOFA [11-13]. Furthermore, one study found better calibration for the APACHE II score [11]. This same study also found that the Simplified Acute Physiology Score (SAPS; defined as the APACHE II score without age and chronic health conditions) had comparable discriminative ability to admission SOFA and better calibration. One study reported comparable discrimina-tion (AUC = 0.776 and 0.825 for SOFA and APACHE III, respectively) and comparable calibration for SOFA and APACHE III on admission [17]. Finally, one study reported that admission SOFA had a higher AUC (0.82) than SAPS II (0.77) [20]. In the other two studies that compared admission SOFA with traditional admission-based models, the outcome was either ICU mortality [13] or unspecified [16]. In these two stud-ies the APACHE II score was reported to have slightly better discrimination than, but in essence comparable with, admis-sion SOFA (0.62 versus 0.61 [13] and 0.88 versus 0.872 [16]).
Study characteristics
Study design Population Models Variables Comparison
Setting
(Location)a
Study periodb Nc/ICU Typed/
Mortality%e
Model/Valid.f SOFA
Abstrac-tionsg
Othersh Standard Modeli Mort.j
Toma et al
(2008) [9] 1 ICU (NL) Jul 98 to Aug 05 2928/Mix/H = 24 LR/Ind. Seq of IOF
1 SAPS II SAPS II H
Toma et al
(2007) [8] 1 ICU (NL) Jul 98 to Aug 05 6276/Mix/H = 11 LR/Ind. Seq of SOFA
2 SAPS II SAPS II H
Ho (2007) [4] 1 multidisc ICU (AU)
Jan 05 to Dec 05 1311/Mix/ H = 14.5
LR/Ind. TMS Adm Delta (TMS-Adm)
APACHE II APACHE II H
Ho et al (2007) [11]
1 multidisc ICU (AU)
Jan 05 to Dec 05 1311/Mix/ H = 14.5
No TMS Adm Delta (TMS-Adm)
No APACHE II, APS, RPH
H
Holtfreter et al
(2006) [12] 1 ICU (DE) 42 months 933/Mix/H = 25/I = 23.9 No Adm No 16 variables, APACHE II H Zygun et al
(2005) [14]
3 ICUs (CA) May 00 to Apr 01 1436/Mix/H = 35.1/I = 27
LR/NR Adm TMS, Mean (ICU stay), Delta (TMS-Adm), Adm (i)
No MODS H/I
Cabré et al
(2005) [6] 79 ICUs (75 ES, 4 L-Am) Feb 01 to Mar 01 1324/Mix/H = 44.6/I = 37.3 LR/NR Min (MODS period), Max (MODS period), 5-day trend3
Age No H
Timsit et al
(2002) [15] 6 ICUs (FR) 24 months 1685/Mix/H = 30.3/I = 22.5 LR/Ind.* D1-7, D1-7 (mod) No LODS H Pettilä et al
(2002) [17]
1 med-surg ICU (FI)
NR 520/Mix/H = 30/I = 16.5
No Adm, D5, Max (5d), Delta (d5-d1), TMS
No APACHE III, MODS, LODS
H
Janssens et al (2000) [20]
1 med ICU (DE) Nov 97 to Feb 98 303/Med/H = 14.5/I = 6.3
LR/NR Adm, TMS, Delta (TMS-Adm)
No No H
Khwannimit
(2007) [10] 1 ICU (TH) Jul 04 to Mar 06 1782/Mix/H = 22/I = 16.4 No Adm No MODS, SOFA, LODS I Rivera-
Fernández et al (2007) [5]
55 ICUs (EU) 2 months in 97/98 6409/Mix/H = 20.6/I = 13.9
LR/Ind. Mean (ICU stay), Max
(ICU stay)
SAPS II, diagnosis events
SAPS II I
Gosling et al
(2006) [13] 1 general ICU (UK) Nov 02 to Oct 03 431/Mix/I = 20.9 No Adm SOFA No APACHE II, urine albumin and 5 other factors
I
Kajdacsy- Balla Amaral et al (2005) [7]
40 ICUs (1 AU, 35 EU, 1 N-Am, 3 S-Am)
1 May 95 to 31 May 95
748 (6 countries)/ Mix/I = 21.5
LR/NR Adm, TMS, Delta (48 h-Adm), Delta (TMS-Adm)
Different parameters
No I
Junger et al (2002) [18]
1 operative ICU (DE)
Apr 99 to Mar 00 524/Surg/I = 12.4 No Max (ICU stay), TMS, Delta (TMS-Adm), Adm (mod)
No No I
Ferreira et al (2001) [19]
1 med-surg ICU (BE)
Apr 99 to Jul 99 352/Mix/I = 23 No Adm, 48 h, 96 h, Delta (48 h-Adm), Delta (96 h-Adm), Max (ICU stay), Mean (ICU stay), Total
No No I
Moreno et al (1999) [21]
40 ICUs (1 AU, 35 EU, 1 N-Am, 3 S-Am)
May 95 1449/Mix/H = 26/I = 22
LR/NR Adm, TMS, Delta (TMS-Adm), Adm (i)
No No I
Bota et al (2002) [16]
1 ICU (BE) Apr to Jul99, Oct to Nov99, Jul to Sep00
949/Mix/U = 29.1 No Adm, 48 h, 96 h, Dis, Max (24 h), Adm (c), 48 h (c), 96 h (c), Dis (c), Max (c, 24 h)
No APACHE II, MODS
[image:4.612.61.556.114.667.2]Performance of sequential measurements of SOFA Eleven studies (61%) evaluated sequential measurements of SOFA [7,11,14-21]. The derivatives evaluated were: max SOFA (four studies), total max SOFA (seven studies), delta SOFA (seven studies), mean SOFA (two studies), total SOFA (one study) and modified SOFA (two studies) (Table 4).
Total max SOFA was always defined as the sum of the highest scores per individual organ system (e.g. cardiovascular) dur-ing the entire ICU stay. Max SOFA always referred to the high-est total SOFA score measured in a prespecified time interval, and mean SOFA was always calculated by taking the average of all total SOFA scores in the prespecified time interval. These intervals varied in length, but generally they were equal to the complete ICU stay. Definitions of delta SOFA were not consistent. Generally, delta SOFA was defined as total max minus admission SOFA [4,7,11,14,18,20,21], but some stud-ies used different definitions [7,17,19]. Modified SOFA scores were adapted SOFA scores (e.g. by using a surrogate of the Glasgow Coma Scale).
Best AUCs were found for max SOFA (range = 0.792 to 0.922) and total max SOFA (range = 0.69 to 0.921), and the lowest AUC was found for delta SOFA (range = 0.51 to 0.828). P values of HL-statistics ranged from 0.33 to 0.95 for total max SOFA and were all beneath 0.05, indicating poor fit, for delta SOFA and mean SOFA.
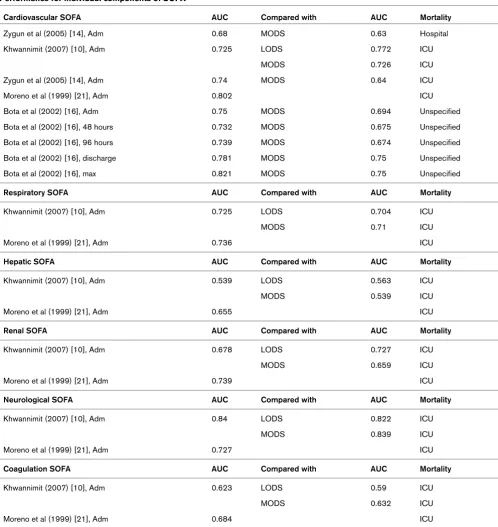
Performance of individual components of SOFA
Four studies (22%) evaluated individual components of SOFA [10,14,16,21] (Table 5). The cardiovascular component per-formed best in one study [21] and the neurological component in another [10], while the hepatic component did worst in both [10,21]. In one study [16], the max cardiovascular component had a higher AUC than the other derivatives of the cardiovas-cular component.
Studies comparing derivatives of SOFA with similar deriva-tives of the Logistic Organ Dysfunction System (LODS) score
and/or the Multiple Organ Dysfunction Score (MODS) found good, comparable discrimination, showing a similar pattern of performance of the different derivatives [10,14-17]. In one study, however, all derivatives of the cardiovascular compo-nent of SOFA did better than that of MODS [16].
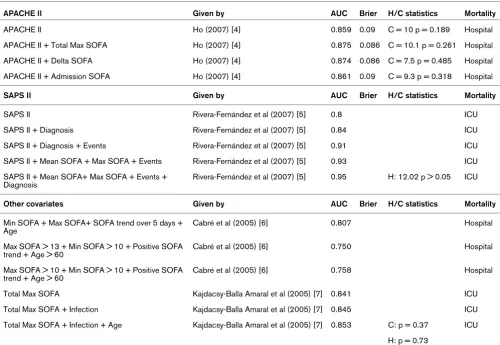
Performance of SOFA combined with other models and/or covariates
Six studies (33%) evaluated SOFA combined with other mod-els and covariates [[4-7] (Table 6); [8,9] (Table 7)].
One study compared the APACHE II model alone to APACHE II combined with each one of total max SOFA, delta SOFA and admission SOFA [4]. Overall performance and discrimination were both improved by the addition of total max SOFA and of the delta SOFA, especially in emergency ICU admissions. Three studies compared the SAPS II model to the SAPS II model when combined with additional information [5,8,9]. One study found that the discriminative ability of SAPS II could be improved by combining it with mean and max SOFA scores, event information and diagnosis information [5]. Two studies built temporal SOFA models and are described in the next section [8,9].
Two studies combined SOFA with other covariates [6,7]. The first study evaluated different combinations of SOFA deriva-tives and age [6]. Highest discriminative ability (AUC = 0.807) was found with the combination of age, min SOFA, max SOFA and SOFA trend (using the categories increased, unchanged and decreased) over five days. The second study compared a model based on max SOFA alone with a model including max SOFA and infection, and a model including max SOFA, infec-tion and age [7]. The last model had very good calibrainfec-tion and discrimination, and outperformed the model based on max SOFA alone.
a: AU = Australia, BE = Belgium, CA = Canada, DE = Germany, EU = European Union, ES = Spain, FR = France, FI = Finland, ICU = Intensive Care Unit, L-Am = Latin-America, med = medical, multidisc = multidisciplinary, N-Am = North-America, NL = The Netherlands, S-Am = South-America, surg = surgical, TH = Thailand, UK = United Kingdom.
b: NR = Not reported. c: N = Number of patients.
d: Med = medical, Mix = Mixed, Surg = surgical.
e: H = Hospital mortality, I = ICU mortality, U = Unspecified mortality.
f: Ind. = Independent validation set used (*indicates the use of bootstrapping), LR = Logistic Regression, Model = Model type reported, No = No model was used, NR = Not Reported, Valid. = Validation method.
g: 1 = Sequences of categorised individual components of SOFA (Failure-Non failure), 2 = Sequences of categorised SOFA scores (High-Medium-Low), 3 = SOFA trend over 5 days (-1 if SOFA is decreased, 0 if SOFA is unchanged, 1 if SOFA is increased), Adm = Admission, c = cardiovascular component of SOFA, cust = customised, Dis = Discharge, Dx = Day x (x = day number), i = individual components of SOFA, IOF = individual Organ Failure scores, Max = Maximum, mod = modified, seq = sequences, SOFA = Sequential Organ Failure Assessment, TMS = Total Maximum SOFA, xd = x days (x = number of days), xh = x hours (x = number of hours).
h: APACHE = Acute Physiology And Chronic Health Evaluation, SAPS = Simplified Acute Physiology Score.
i: APACHE = Acute Physiology And Chronic Health Evaluation, APS = Acute Physiology Score, LODS = Logistic Organ Dysfunction System, MODS = Multiple Organ Dysfunction Score, RPH = Royal Perth Hospital Intensive Care Unit, SAPS = Simplified Acute Physiology Score, SOFA = Sequential Organ Failure Assessment.
j: H = Hospital mortality, I = ICU mortality, Mort. = Mortality, U = Unspecified mortality. Table 1 (Continued)
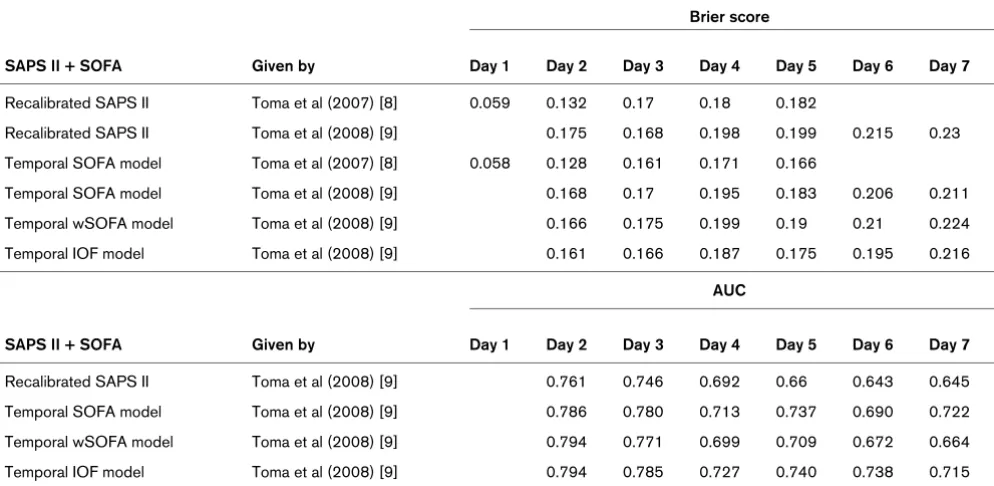
Performance of temporal SOFA models using pattern discovery
Two studies (11%) by the same research group used pattern discovery to develop temporal models including SAPS II and SOFA data [8,9] (Table 7). The first study used a data-driven algorithm to discover frequent sequences of SOFA scores, categorised as low, medium and high [8]. On all days exam-ined (the first five days) the temporal SAPS II model including the frequent SOFA patterns (called episodes) had better accuracy, indicated by lower Brier scores, than the original model. On days 2, 4 and 5 these differences were statistically significant. In the second study the same algorithm was used to discover frequent patterns of individual organ failure (IOF) scores (categorised as failure or non-failure) [9] for days 2 to 7. A temporal SAPS II model including the frequent IOF
pat-terns was compared with the original (recalibrated) model, the temporal SAPS II model [8] and a temporal SAPS II model including a weighted average of the SOFA scores. Except for day 7 the model including frequent IOF patterns performed best in terms of both discrimination and accuracy as measured by the AUC and the Brier score [9].
Discussion
To our knowledge this is the first systematic review on the use of SOFA-based models to predict the risk of mortality in ICU patients. In this review, we show that although the 18 identi-fied studies all focused on evaluating a SOFA-based score or model in predicting mortality they widely differed in the SOFA derivatives used, the time after admission on which the predic-tion was made, the outcome (hospital or ICU mortality), the Quality score of included studies
Study participation max 8 pts
Prognostic factor max 3 pts
Outcome
measurement max 1 pt
Analysis max 8 pts Total score max 20 pts
Toma et al (2008) [9] 8 3 1 7.5 19
Toma et al (2007) [8] 8 2.5 1 8 19.5
Khwannimit (2007) [10]
8 1 1 3.5 13.5
Ho (2007) [4] 8 3 1 7 19
Ho et al (2007) [11] 8 2 1 5 16
Rivera-Fernández et al (2007) [5]
7 1 1 7.5 16.5
Holtfreter et al (2006) [12]
8 1.5 1 5 15.5
Gosling et al (2006) [13]
8 1.5 1 4 14.5
Zygun et al (2005) [14]
8 2 1 5.5 16.5
Cabré et al (2005) [6] 8 2 1 4 15
Kajdacsy-Balla Amaral et al (2005) [7]
8 3 1 5 17
Timsit et al (2002) [15] 8 2.5 1 7.5 19
Bota et al (2002) [16] 7.5 1 0 3 11.5
Pettilä et al (2002) [17]
8 1 1 7.5 17.5
Junger et al (2002) [18]
7 2 1 3 13
Ferreira et al (2001) [19]
8 2.5 1 3 14.5
Janssens et al (2000) [20]
8 2 1 3.5 14.5
Moreno et al (1999) [21]
8 2.5 1 3.5 15
[image:6.612.60.557.112.519.2]Table 3
Performance at admission or a fixed time thereafter
Admission SOFA AUC Brier H/C-statistics Compared with AUC Brier H/C-statistics Mort.
Ho et al (2007) [11] 0.791 0.1 C = 7.97 APACHE II 0.858 0.09 H
p = 0.437 APS 0.829 0.09 C = 2.9 p = 0.890 H
RPHICU 0.822 0.09 C = 4.7 p = 0.198 H
Holtfreter et al (2006) [12] 0.72 APACHE II 0.785 H
Zygun et al (2005) [14] 0.67 U = 8.8 MODS 0.62 H/C = 10.28 H
p = 0.38 p = 0.17
Timsit et al (2002) [15] 0.72 U = 4.55 LODS 0.726 H/C = 10.4 H
p = 0.8 p = 0.16
Pettilä et al (2002) [17] 0.776 APACHE III 0.825 H
LODS 0.805 H
MODS 0.695 H
Khwannimit (2007) [10] 0.8786 LODS 0.8802 H
MODS 0.8606
Gosling et al (2006) [13] 0.61 APACHE II 0.62 I
Zygun et al (2005) [14] 0.67 U = 11.66 MODS 0.63 H/C = 14.29 I
p = 0.17 p = 0.05
Moreno et al (1999) [21] 0.772 I
Bota et al (2002) [16] 0.872 APACHE II 0.88 U
MODS 0.856 U
Ferreira et al (2001) [19] 0.79 I
Janssens et al (2000) [20] 0.82 SAPS II 0.77 H
Other scoring moments AUC Brier H/C-statistics Compared to AUC Brier H/C-statistics Mort.
Bota et al (2002) [16] 48 hours 0.844 MODS 0.834 U
Ferreira et al (2001) [19] 48 hours 0.78 I
Bota et al (2002) [16] 96 hours 0.847 MODS 0.861 U
Ferreira et al (2001) [19] 96 hours 0.82 I
Timsit et al (2002) [15], day 2 0.742 U = 11.1 LODS 0.742 H
p = 0.2
Timsit et al (2002) [15], day 3 0.762 U = 9.94 LODS 0.762 H
p = 0.27
Timsit et al (2002) [15], day 4 0.766 U = 10.5 LODS 0.766 H
p = 0.23
Timsit et al (2002) [15], day 5 0.746 U = 13.6 LODS 0.746 H
p = 0.09
Pettilä et al (2002) [17], day 5 0.727 LODS 0.76 H
H MODS 0.744
Timsit et al (2002) [15], day 6 0.763 U = 12.2 LODS 0.763 H
p = 0.14
Timsit et al (2002) [15], day 7 0.746 LODS 0.764 H
Bota et al (2002) [16], final 0.897 MODS 0.869 H
Performance for sequential SOFA
Max SOFA AUC Brier H/C-statistics Comp. AUC H/C-statistics Mort.
Pettilä et al (2002) [17], 5 days 0.792 LODS 0.827 H
MODS 0.795 H
Junger et al (2002) [18], ICU stay 0.922 I
Bota et al (2002) [16], 24 hrs period 0.898 MODS 0.9 U
Ferreira et al (2001) [19], ICU stay 0.9 I
Total Max SOFA AUC Brier H/C-statistics Comp AUC H/C-statistics Mort.
Ho et al (2007) [11], ICU stay 0.829 0.1 C = 7.4 p = 0.496 H
Zygun et al (2005) [14], ICU stay 0.7 U = 9.2 p = 0.33 MODS 0.65 8.07 p = 0.43 H
Pettilä et al (2002) [17], ICU stay 0.816 LODS 0.839 H
MODS 0.817 H
Zygun et al (2005) [14], ICU stay 0.69 U = 7.30 p = 0.50 MODS 0.64 9.09 p = 0.33 I
Kajdacsy-Balla Amaral et al (2005) [7], ICU stay 0.84 H: p = 0.95 C: p = 0.54 I
Junger et al (2002) [18], ICU stay 0.921 I
Moreno et al (1999) [21], ICU stay 0.847 I
Janssens et al (2000) [20], ICU stay 0.86 H
Delta SOFA AUC Brier H/C-statistics Comp AUC H/C-statistics Mort.
Ho et al (2007) [11], TMS – Adm 0.635 0.12 C = 20.2 p = 0.001 H
Zygun et al (2005) [14], TMS – Adm 0.54 U = 53.48 p < 0.01 MODS 0.55 31.2 p < 0.01 H
Pettilä et al (2002) [17], day 5 – Adm 0.6 LODS 0.633 H
MODS 0.653 H
Zygun et al (2005) [14], TMS – Adm 0.51 U = 98.01 p < 0.01 MODS 0.52 70.52 p < 0.01 I
Junger et al (2002) [18], TMS – Adm 0.828 I
Moreno et al (1999) [21], TMS – Adm 0.742 I
Ferreira et al (2001) [19], 48 hrs – Adm 0.69 I
Ferreira et al (2001) [19], 96 hrs – Adm 0.62 I
Janssens et al (2000) [20], TMS – Adm 0.62 H
Mean SOFA AUC Brier H/C-statistics Comp AUC H/C-statistics Mort.
Zygun et al (2005) [14], ICU stay 0.77 U = 22.66 p < 0.01 MODS 0.74 46.13 p < 0.01 H
Zygun et al (2005) [14], ICU stay 0.79 U = 28.92 p < 0.01 MODS 0.75 42.72 p < 0.01 I
Ferreira et al (2001) [19], ICU stay 0.88 I
Total SOFA AUC Brier H/C-statistics Comp AUC H/C-statistics Mort.
Ferreira et al (2001) [19], ICU stay 0.85 I
Modified SOFA AUC Brier H/C-statistics Comp AUC H/C-statistics Mort.
Timsit et al (2002) [15], Adm 0.729 U = 11 p = 0.2 LODS 0.733 11.3 p = 0.19 H
Timsit et al (2002) [15], day 2 0.752 U = 8.3 p = 0.4 LODS 0.748 H
Timsit et al (2002) [15], day 3 0.773 U = 11.3 p = 0.19 LODS 0.761 H
Timsit et al (2002) [15], day 4 0.779 U = 7.3 p = 0.5 LODS 0.76 H
Timsit et al (2002) [15], day 5 0.763 U = 14.4 p = 0.07 LODS 0.749 H
Timsit et al (2002) [15], day 6 0.784 U = 11 p = 0.17 LODS 0.79 H
Timsit et al (2002) [15], day 7 0.768 U = 6.3 p = 0.62 LODS 0.746 H
Junger et al (2002) [18], Adm 0.799 I
[image:8.612.57.556.111.704.2]prognostic performance measures considered, the way a study was reported and the way the models were validated. This hampers the quantitative comparability of study results. Despite the fact that most studies scored well on most meth-odological quality dimensions, model validation still formed a
[image:9.612.57.555.109.636.2]weak spot: in some studies there was no report on how per-formance measures were obtained and in others there was no independent validation set used. The AUC of SOFA-based models was good to very good and did not lag much behind APACHE II/III and was competitive with a SAPS II model. Table 5
Performance for individual components of SOFA
Cardiovascular SOFA AUC Compared with AUC Mortality
Zygun et al (2005) [14], Adm 0.68 MODS 0.63 Hospital
Khwannimit (2007) [10], Adm 0.725 LODS 0.772 ICU
MODS 0.726 ICU
Zygun et al (2005) [14], Adm 0.74 MODS 0.64 ICU
Moreno et al (1999) [21], Adm 0.802 ICU
Bota et al (2002) [16], Adm 0.75 MODS 0.694 Unspecified
Bota et al (2002) [16], 48 hours 0.732 MODS 0.675 Unspecified
Bota et al (2002) [16], 96 hours 0.739 MODS 0.674 Unspecified
Bota et al (2002) [16], discharge 0.781 MODS 0.75 Unspecified
Bota et al (2002) [16], max 0.821 MODS 0.75 Unspecified
Respiratory SOFA AUC Compared with AUC Mortality
Khwannimit (2007) [10], Adm 0.725 LODS 0.704 ICU
MODS 0.71 ICU
Moreno et al (1999) [21], Adm 0.736 ICU
Hepatic SOFA AUC Compared with AUC Mortality
Khwannimit (2007) [10], Adm 0.539 LODS 0.563 ICU
MODS 0.539 ICU
Moreno et al (1999) [21], Adm 0.655 ICU
Renal SOFA AUC Compared with AUC Mortality
Khwannimit (2007) [10], Adm 0.678 LODS 0.727 ICU
MODS 0.659 ICU
Moreno et al (1999) [21], Adm 0.739 ICU
Neurological SOFA AUC Compared with AUC Mortality
Khwannimit (2007) [10], Adm 0.84 LODS 0.822 ICU
MODS 0.839 ICU
Moreno et al (1999) [21], Adm 0.727 ICU
Coagulation SOFA AUC Compared with AUC Mortality
Khwannimit (2007) [10], Adm 0.623 LODS 0.59 ICU
MODS 0.632 ICU
Moreno et al (1999) [21], Adm 0.684 ICU
When reported, the Hosmer-Lemeshow tests did not indicate poor fit (i.e. there were no significant departures between the predicted probabilities and the respective observed mortality proportions). Models with sequential SOFA seem to have comparable performance with other organ failure scores. Combining SOFA-based derivatives with admission severity of illness scores clearly improved predictions.
Among the used SOFA derivatives are the SOFA score on admission, maximum SOFA score over the entire ICU stay or the sum of highest SOFA components over ICU stay. Only 10 studies reported on the use of SOFA derivatives as covariates in a logistic regression model, the other eight studies did not use models or did not report on such use. The score itself, without using a probabilistic model would allow for obtaining an AUC representing the likelihood that a non-surviving patient would have a higher SOFA score than a patient that would sur-vive. As the SOFA score itself does not give a quantitative esti-mation of the risk of mortality, calibration and accuracy cannot be assessed for the SOFA score itself. Remarkably, only 5 of
the 10 studies fitting a logistic regression model reported on the use of an independent data set to validate the model. Due to these differences in the use of SOFA scores and in the methodological approach and quality, results of individual studies are very difficult to compare and meta-analyse.
Most studies evaluated prognosis based on SOFA scores in the first 24 hours after ICU admission. Good to excellent dis-crimination between survivors and non-survivors were reported, which did not markedly differ from that of traditional models such as APACHE II or SAPS II. This relatively good performance of SOFA is remarkable, given the fact that SOFA is based on fewer physiological parameters and that it does not include information on reason for admission or co-morbid-ity. On the other hand, information on instituted treatments, such as vasopressors and mechanical ventilation, is included in SOFA but not in APACHE II or SAPS II. We would like to stress that SAPS and APACHE models were developed for predicting hospital mortality, hence when comparing SOFA-based models to this family of admission-SOFA-based models it is Performance for combined models
APACHE II Given by AUC Brier H/C statistics Mortality
APACHE II Ho (2007) [4] 0.859 0.09 C = 10 p = 0.189 Hospital
APACHE II + Total Max SOFA Ho (2007) [4] 0.875 0.086 C = 10.1 p = 0.261 Hospital
APACHE II + Delta SOFA Ho (2007) [4] 0.874 0.086 C = 7.5 p = 0.485 Hospital
APACHE II + Admission SOFA Ho (2007) [4] 0.861 0.09 C = 9.3 p = 0.318 Hospital
SAPS II Given by AUC Brier H/C statistics Mortality
SAPS II Rivera-Fernández et al (2007) [5] 0.8 ICU
SAPS II + Diagnosis Rivera-Fernández et al (2007) [5] 0.84 ICU
SAPS II + Diagnosis + Events Rivera-Fernández et al (2007) [5] 0.91 ICU
SAPS II + Mean SOFA + Max SOFA + Events Rivera-Fernández et al (2007) [5] 0.93 ICU
SAPS II + Mean SOFA+ Max SOFA + Events + Diagnosis
Rivera-Fernández et al (2007) [5] 0.95 H: 12.02 p > 0.05 ICU
Other covariates Given by AUC Brier H/C statistics Mortality
Min SOFA + Max SOFA+ SOFA trend over 5 days + Age
Cabré et al (2005) [6] 0.807 Hospital
Max SOFA > 13 + Min SOFA > 10 + Positive SOFA trend + Age > 60
Cabré et al (2005) [6] 0.750 Hospital
Max SOFA > 10 + Min SOFA > 10 + Positive SOFA trend + Age > 60
Cabré et al (2005) [6] 0.758 Hospital
Total Max SOFA Kajdacsy-Balla Amaral et al (2005) [7] 0.841 ICU
Total Max SOFA + Infection Kajdacsy-Balla Amaral et al (2005) [7] 0.845 ICU
Total Max SOFA + Infection + Age Kajdacsy-Balla Amaral et al (2005) [7] 0.853 C: p = 0.37 ICU
H: p = 0.73
[image:10.612.57.557.113.457.2]more appropriate to use hospital mortality rather than ICU mor-tality as the outcome. Table 1 shows that this design principle was not always followed.
It can be expected that adding information on the course of the ICU treatment, as reflected by sequential SOFA scores, will improve the accuracy of predicting the likelihood of survival. Indeed, studies that evaluated the prognostic value of highest SOFA scores during ICU stay found excellent discrimination as reflected in high AUCs. It should be stressed, however, that most severe IOF and highest SOFA scores might well be found just before death. The clinical relevance of predicting a high likelihood of dying just before actual death is limited. Inter-estingly, the one study that evaluated max SOFA over the first five days of admission instead of over the entire ICU stay found an AUC of 0.79, which was almost the same as the AUC for a single SOFA-score at admission [17].
A high delta SOFA indicates increasing organ dysfunction dur-ing ICU stay, and was expected to be highly predictive of mor-tality. In contrast, discrimination of survivors from non-survivors by delta SOFA alone appeared to be poor. This may be explained by the fact that delta SOFA may be relatively low in patients with an already very high SOFA score at admission. Furthermore, delta SOFA does not take into account whether organ functioning improves after the SOFA score reaches a peak value.
Combining information of severity of illness at admission and information on the course of illness during treatment, in con-trast to comparing them, seems promising and two strategies have been adopted. In the first strategy a prognostic model at admission was combined with a pre-specified SOFA deriva-tive such as delta SOFA or max SOFA. Indeed, in our review we found that the studies combining delta SOFA or max SOFA with APACHE II or SAPS II reported on better discrim-ination between survivors and non-survivors for the combined models than for either APACHE II or SAPS II alone [4,5]. A second strategy is to combine severity of admission scores with data-driven patterns of SOFA or individual organ failure scores (e.g. two days of renal failure accompanied with recov-ery of the neurological system) instead of using pre-specified SOFA derivatives. Two studies adopted this strategy and showed that models based on SAPS II and temporal patterns outperformed models using the SAPS II score alone but recal-ibrated per day [8,9].
Conclusion
[image:11.612.58.555.118.361.2]Interest in models based on the SOFA score, introduced a decade ago, is increasing in recent years. Although the heter-ogeneity of published studies hampers drawing precise con-clusions about the optimal derivatives of SOFA scores, the following general conclusions may be drawn. Models based on SOFA scores at admission seem to be competitive with severity of illness models limited to the first 24 hours of admis-sion. Performance of models based on sequential SOFA Table 7
Performance for temporal models using pattern discovery
Brier score
SAPS II + SOFA Given by Day 1 Day 2 Day 3 Day 4 Day 5 Day 6 Day 7
Recalibrated SAPS II Toma et al (2007) [8] 0.059 0.132 0.17 0.18 0.182
Recalibrated SAPS II Toma et al (2008) [9] 0.175 0.168 0.198 0.199 0.215 0.23
Temporal SOFA model Toma et al (2007) [8] 0.058 0.128 0.161 0.171 0.166
Temporal SOFA model Toma et al (2008) [9] 0.168 0.17 0.195 0.183 0.206 0.211
Temporal wSOFA model Toma et al (2008) [9] 0.166 0.175 0.199 0.19 0.21 0.224
Temporal IOF model Toma et al (2008) [9] 0.161 0.166 0.187 0.175 0.195 0.216
AUC
SAPS II + SOFA Given by Day 1 Day 2 Day 3 Day 4 Day 5 Day 6 Day 7
Recalibrated SAPS II Toma et al (2008) [9] 0.761 0.746 0.692 0.66 0.643 0.645
Temporal SOFA model Toma et al (2008) [9] 0.786 0.780 0.713 0.737 0.690 0.722
Temporal wSOFA model Toma et al (2008) [9] 0.794 0.771 0.699 0.709 0.672 0.664
Temporal IOF model Toma et al (2008) [9] 0.794 0.785 0.727 0.740 0.738 0.715
scores is comparable with that of other organ failure scores. Based on current evidence we advocate the combination of a traditional model based on data from the first 24 hours after ICU admission (e.g. APACHE IV) with sequential SOFA scores (e.g. max SOFA or a SOFA score pattern over a spec-ified time interval). Such a model should be validated in a large independent dataset.
Competing interests
The authors declare that they have no competing interests.
Authors' contributions
LM carried out the search queries, reviewed the articles, assessed their quality and drafted the paper. AAH conceived of the study, reviewed the articles and participated in its design and coordination and helped to draft the manuscript. EdJ assessed the quality of the studies and participated in its design and coordination and helped to draft the manuscript. All authors read and approved the final manuscript.
Additional files
References
1. Vincent J, De Mendonça A, Cantraine F, Moreno R, Takala J, Suter P, Sprung C: Use of the SOFA score to assess the incidence of organ dysfunction/failure in intensive care units: results of a multicenter, prospective study. Working group on "sepsis-related problems" of the European Society of Intensive Care Medicine. Crit Care Med 1998, 26:1793-1800.
2. Vincent J, Ferreira F, Moreno R: Scoring systems for assessing organ dysfunction and survival. Crit Care Clin 2000, 16:353-366.
3. Hayden J, Côté P, Bombardier C: Evaluation of the quality of prognosis studies in systematic reviews. Ann Intern Med 2006, 144:427-437.
4. Ho K: Combining sequential organ failure assessment (SOFA) score with acute physiology and chronic health evaluation (APACHE) II score to predict hospital mortality of critically ill patients. Anaesth Intensive Care 2007, 35:515-521.
5. Rivera-Fernández R, Nap R, Vázquez-Mata G, Miranda D: Analysis of physiologic alterations in intensive care unit patients and their relationship with mortality. J Crit Care 2007, 22:120-128. 6. Cabré L, Mancebo J, Solsona J, Saura P, Gich I, Blanch L: Multi-center study of the multiple organ dysfunction syndrome in intensive care units: The usefulness of sequential organ fail-ure assessment scores in decision making. Intensive Care Med 2005, 31:927-933.
7. Kajdacsy-Balla Amaral A, Andrade F, Moreno R, Artigas A, Can-traine F, Vincent J: Use of the sequential organ failure assess-ment score as a severity score. Intensive Care Med 2005, 31:243-249.
8. Toma T, Abu-Hanna A, Bosman RJ: Discovery and inclusion of SOFA score episodes in mortality prediction. J Biomed Inform
2007, 40:649-660.
9. Toma T, Abu-Hanna A, Bosman R: Discovery and integration of univariate patterns from daily individual organ-failure scores for intensive care mortality prediction. Artif Intell Med 2008, 43:47-60.
10. Khwannimit B: A comparison of three organ dysfunction scores: MODS, SOFA and LOD for predicting ICU mortality in critically ill patients. J Med Assoc Thai 2007, 90:1074-1081. 11. Ho K, Lee K, Williams T, Finn J, Knuiman M, Webb S: Comparison
of acute physiology and chronic health evaluation (APACHE) II score with organ failure scores to predict hospital mortality. Anaesthesia 2007, 62:466-473.
12. Holtfreter B, Bandt C, Kuhn S, Grunwald U, Lehman C, Schütt C: Serum osmolality and outcome in intensive care unit patients. Acta Anaesthesiol Scand 2006, 50:970-977.
13. Gosling P, Czyz J, Nightingale P, Manji M: Microalbuminuria in the intensive care unit: Clinical correlates and association with outcomes in 431 patients. Crit Care Med 2006, 34:2158-2166. 14. Zygun D, Laupland K, Fick G, Sandham J, Doig C, Chu Y: Limited ability of SOFA and MOD scores to discriminate outcome: A prospective evaluation in 1,436 patients. Can J Anesth 2005, 52:302-308.
15. Timsit J, Fosse J, Troché G, DeLassence A, Alberti C, Garrouste-Orgeas M: Calibration and discrimination by daily logistic organ dysfunction scoring comparatively with daily sequential organ failure assessment scoring for predicting hospital mor-tality in critically ill patients. Crit Care Med 2002, 30:2003-2013.
16. Peres Bota D, Melot C, Lopes Ferreira F, Ba V, Vincent J: The mul-tiple organ dysfunction score (MODS) versus the sequential organ failure assessment (SOFA) score in outcome predic-tion. Intensive Care Med 2002, 28:1619-1624.
17. Pettilä V, Pettilä M, Sarna S, Voutilainen P, Takkunen O: Compar-ison of multiple organ dysfunction scores in the prediction of hospital mortality in the critically ill. Crit Care Med 2002, 30:1705-1711.
18. Junger A, Engel J, Benson M, Böttger S, Grabow C, Hartmann B: Discriminative power on mortality of a modified sequential organ failure assessment score for complete automatic com-putation in an operative intensive care unit. Crit Care Med
2002, 30:338-342.
19. Ferreira FL, Bota DP, Bross A, Mélot C, Vincent JL: Serial evalu-ation of the SOFA score to predict outcome in critically ill patients. JAMA 2001, 286:1754-1758.
Key messages
• SOFA-based models evaluated on their prognostic per-formance fell under the categories: single SOFA scores at fixed times; sequential SOFA measurements; individ-ual SOFA components; combination of SOFA with other covariates; and SOFA patterns automatically dis-covered from the data.
• For predicting mortality SOFA-based models at admis-sion seem to be competitive with severity of illness models limited to the first 24 hours of admission, and models based on sequential SOFA scores have compa-rable performance with other IOF scores.
• The combination of SOFA-based models with admis-sion-based models results in superior prognostic per-formance than each model alone.
• Studies should use an independent validation set to assess performance and should apply multiple perform-ance measures preferably covering discrimination, cali-bration and accuracy.
The following Additional files are available online:
Additional file 1
a PDF file containing a list that describes the 20 items of the quality assessment framework.
20. Janssens U, Graf J, Radke P, Königs B, Koch K: Evaluation of the sofa score: A single-center experience of a medical intensive care unit 303 consecutive patients with predominantly cardio-vascular disorders. Sequential Organ Failure Assessment. Intensive Care Med 2000, 26:1037-1045.