International Journal of Emerging Technology and Advanced Engineering
Website: www.ijetae.com (ISSN 2250-2459, ISO 9001:2008 Certified Journal, Volume 5, Issue 1, January 2015)
483
Stress Analysis by Finite Element Method of Weir Block
having Large Size Multiple Openings- A Case Study
Rizwan Ali
1, Hanumanthappa M S
2, Shyamli Paswan
3, Minoti Das
4, A K Ghosh
51,5
Scientist D & Central Water and Power Research Station, Pune-411 024, India
2
Scientist B & Central Water and Power Research Station, Pune-411 024, India
3,4Asssistant Research Officer & Central Water and Power Research Station, Pune-411 024, India
Abstract—High tensile stress concentrations occur in dams
due to large size openings, which may create apprehensions about the structural safety of dams. The stress analysis of such concrete gravity dams to assess structural safety, involves complexity of proper creation of mathematical model ,taking into account all openings, application of static and dynamic loads and boundary conditions. The proper simulation of dynamic loads under earthquake conditions is also quite cumbersome. Pseudo static approach of analysis, using constant seismic coefficients, is usually adopted for carrying out such analysis using general purpose FEM Softwares. However this approach can be too conservative and may yield very high stresses in the dam body. A further refined approach in simulating earthquake load is Pseudo dynamic analysis where variation in applied seismic coefficients from top to the base of the dam is adopted as per IS: 1893-1984,2002 guidelines. In Pseudo Dynamic analysis, inertia effect of reservoir water is considered in the form of added mass by Westergaard approach and inertia of dam body is considered by applying equivalent concentrated loads at the centroid of elements in the central region of the dam body with a gradual variation of seismic coefficients from 1.5 times the value at the top reducing to zero at the base. Present paper discusses a case study undertaken to evaluate the structural safety of 23.75 m high overflow section of Garudeshwar concrete gravity weir situated in seismic zone II in Gujarat, India. An account of the three dimensional Static as well as Pseudo dynamic stress analysis by finite element method to assess the structural safety of weir block having large size multiple openings has been presented by utilizing general purpose Finite Element Software SOLVIA ver.99.0. The weir block inclusive of all openings along with foundation has been discretized into 4664 twenty noded spatially isotropic solid brick elements and load conditions have been adopted as per guidelines of IS 6512:1984. Site specific seismic coefficients based on revised IS1893:2002(Part I) for seismic zone II (Ah =0.125, Av=0.0625, Al=0.0625) have
been used and computed stresses under various load combinations have been compared with the permissible stresses and designed strength of concrete.
Although large area near the openings has been found to be under tension with the maximum value of tensile stress being 11.361 kg/cm2, overall tensile as well as compressive stresses developed under static as well as pseudo dynamic load combinations have been found to be within permissible limits of concrete strength. To resist tensile stresses, provision of steel reinforcement around openings in tension zone has been suggested.
Keywords—Gravity Dam, Structural Safety,Pseudo
dynamic, seismic coefficient, Maximum Principal Stress
I. INTRODUCTION
International Journal of Emerging Technology and Advanced Engineering
Website: www.ijetae.com (ISSN 2250-2459, ISO 9001:2008 Certified Journal, Volume 5, Issue 1, January 2015)
484
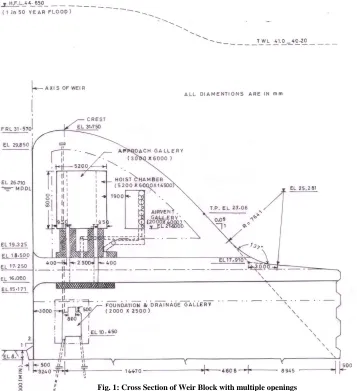
For ease of creation of the model and visualization of openings the weir block has been divided into 10 parts by taking sections as shown in plan of weir block Fig.2. The region around Garudeshwar weir lies in seismic zone II as per revised BIS code. The fundamental period of vibration is calculated using
s g
gE w B H
T5.55 (1)
Where;
H=Height of dam in m
B=Base width of dam in m
wg= Unit weight of dam material in kg/m3
g= Acceleration due to gravity in m/s2
Es= Modulus of Elasticity of dam material in kg/m2
The design horizontal seismic coefficient has been calculated based on IS: 1893 (Part I)-2002 as follows :
g S R
I Z
A a
h 2
(2)
Where,
Ah= Design horizontal seismic coefficient,
[image:2.612.115.472.146.537.2]Z = Zone factor for the Maximum Considered Earthquake taken as 0.10 for seismic zone II
International Journal of Emerging Technology and Advanced Engineering
Website: www.ijetae.com (ISSN 2250-2459, ISO 9001:2008 Certified Journal, Volume 5, Issue 1, January 2015)
485
I = Minimum Importance factor taken as 1.5 for power stations
R = Response reduction factor taken as 1.5 for unreinforced concrete (I/R should be less than or equal to 1.0 )
Sa / g = Average response acceleration coefficient taken as 2.5 for rocky and hard soil sites for the
fundamental natural period of the weir block lying between 0.10 to 0.40 sec
The value of seismic coefficients along longitudinal and vertical directions has been taken as 1/2 of horizontal seismic coefficient Ah. The value of seismic coefficients
has been taken as 1.5 times of Ah at top of the dam and
reduced linearly to zero at base.The seismic coefficients have been computed as Ah=0.125, Av=0.0625, AL=0.0625.
The effect of reservoir water inertia during earthquake load combinations have taken by applying equivalent static loads on upstream nodes as per Westergaard added mass approach along three directions. The inertia effect due to mass of dam body has also been taken into consideration by applying equivalent static loads at the centre line of weir block at different elevations along three directions by creating most adverse loading conditions.
II. STRESS ANALYSIS
A. Finite Element Model
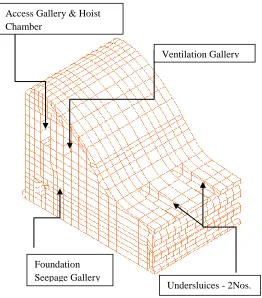
The 3D finite element studies have been carried out using a very sophisticated finite element computer program SOLVIA version 99. The dam foundation system has been idealized by a three dimensional finite element model (Fig 3&4) consisting of 4664 elements 20 noded isoparametric solid elements (SOLVIA Manual and Zienkiewicz O.C, 1977). All the openings in the dam body have been reproduced in mathematical model. A total of 22714 nodes have been generated including defined nodes. In order to account for the elastic behavior of the foundation rock strata, a section of the foundation part upto a depth equal to more than two times the height of the dam and width equal to 4 times of dam base have been included in the analysis as per guidelines from ICOLD bulletin.
International Journal of Emerging Technology and Advanced Engineering
Website: www.ijetae.com (ISSN 2250-2459, ISO 9001:2008 Certified Journal, Volume 5, Issue 1, January 2015)
486
It has further been assumed that at the base of foundation, the displacements are almost reduced to zero and there is no need to include further portion of foundation in the analysis. The boundary conditions have also been specified accordingly. Material for dam and the foundation has been assumed to be isotropic, homogeneous, and linearly elastic. The mass and inertia of the foundation has been neglected. The foundation block acts only as spring bed to satisfy boundary conditions. The 3D linear stress analysis has been carried out by considering isoparametric solid elements.
Various loads such as self weight of weir block, hydrostatic pressure, uplift, silt load, internal pressure in under sluices, inertia loads due to reservoir water and mass of weir body during earthquake load combinations etc., have been applied by computing their magnitudes using standard formulae as per IS codes and ICOLD guidelines. Under submerged condition during flood discharge, effective weight of weir block has only been considered.
Results from the analysis have been obtained in the form of stress values at 20 Gauss Points in each element whereas the displacement values are obtained at nodes. Stress values have been presented in the form of contour surfaces over the surfaces of the weir block. Although, the foundation part has been considered in the analysis, the stress and displacement distribution in foundation block have been observed of negligible magnitude. Therefore, the results have been provided and presented only for the weir body.
B. Input Parameters
The input data in terms of the properties of the dam material, foundation material, water, silt cum water and seismic coefficients adopted in analysis are given as listed in Table I:
C. Load Conditions
Based on IS Code 6512:1984, following load combinations have been considered in the present analysis:
a)Load Combination A (Construction Condition): - Dam completed but no water in reservoir and no tailwater.
b)Load Combination B (Normal Operating
Condition):- Full reservoir elevation at FRL at Rl.31.57m normal dry weather, Normal uplift, tailwater level at Rl.17.00m, and silt load upto Rl.15.0m at upstream and downstream.
[image:4.612.80.296.146.343.2]c)Load Combination C (Flood Discharge Condition):- Reservoir at maximum flood pool elevation at MWL at Rl.44.65m, all gates open, tailwater at elevation at Rl.41.0m, and silt load upto Rl.15.0m at upstream and downstream.
Fig 3: Finite Element discretization of Weir Block and Foundation
Undersluices - 2Nos. Access Gallery & Hoist
Chamber
Ventilation Gallery
Foundation Seepage Gallery
[image:4.612.53.315.371.669.2]International Journal of Emerging Technology and Advanced Engineering
Website: www.ijetae.com (ISSN 2250-2459, ISO 9001:2008 Certified Journal, Volume 5, Issue 1, January 2015)
487
d)Load Combination D: Combination A, with earthquake.
e)Load Combination E: Combination B, with earthquake.
f) Load Combination F: Combination C, but with extreme uplift (drainsinoperative). g)Load Combination G: Combination E, but with
extreme uplift (drains inoperative).
III. RESULTS AND DISCUSSIONS
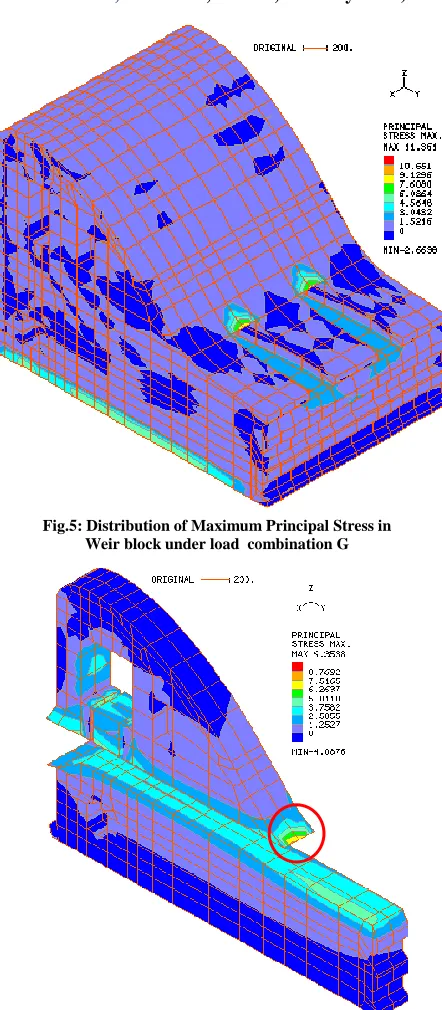
The important results obtained from finite element analysis are presented in the form of contours surfaces over weir block. The distribution of maximum principal stress under most adverse load combination G is shown in fig.5. The maximum principal stress of the order of 11.361 kg/cm2 tensile has been found developed near heel point of block for load combination G. The distribution of tensile stress around under sluice barrel and hoist chamber is shown in figs.6 and 7.
S.N .
Property Value
1. Young‘s Modulus of Elasticity ‗E‘
i) Foundation rock ii) Dam material (Concrete)
0.54×10⁵ Kg/cm2 1.47×10⁵ Kg/cm2
2. Poisson‘s Ratio ‗‘ i) Foundation rock
ii) Dam material (Concrete)
0.24 0.20 3. Mass Density ‗‘
i) Dam material
ii)Dam material under submerged condition
2.55×10⁻³ Kg/cm3 1.55×10⁻³ Kg/cm3
4. Mass Density of water ‗w‘ 1.0×10 -3
Kg/cm3 5. Mass Density of silt and
water in horizontal direction ‗sh‘
1.36×10⁻³ Kg/cm3
6. Mass Density of silt and water in vertical direction ‗sv‘
1.925×10⁻³ Kg/cm3
7. Horizontal Seismic coefficient Ah
0.125
8. Vertical Seismic coefficient Av
0.0625
9. Longitudinal Seismic coefficient Al
[image:5.612.65.556.114.606.2]0.0625 Table I
[image:5.612.57.293.126.559.2]Material Properties
Fig.5: Distribution of Maximum Principal Stress in Weir block under load combination G
[image:5.612.339.560.128.633.2]International Journal of Emerging Technology and Advanced Engineering
Website: www.ijetae.com (ISSN 2250-2459, ISO 9001:2008 Certified Journal, Volume 5, Issue 1, January 2015)
488 0 1 2 3 4 5 6 7 8 9 10 11 12
Loads A Loads B Loads C Loads F Loads D Loads E Loads G Load com bination--->
M a x P ri n c ip a l S tr e s s ( K g /c m 2)---> SPmax -27 -25 -23 -21 -19 -17 -15 -13 -11 -9 -7 -5 -3 -1
Loads A Loads B Loads C Loads F Loads D Loads E Loads G Load com bination--->
M in P ri n c ip a l S tr e s s ( K g /c m 2)---> SPmin
The maximum principal stresses of the order of 9.35 kg/cm2 tensile and 9.16 kg/cm2 tensile have been found developed near undersluice barrel and hoist chamber under load combination G. Though the maximum tensile stress developed in weir block has been observed to remain within allowable tensile strength of concrete, but due to spread of tensile stress on large area, it has become necessary to provide steel reinforcement around openings to compensate tensile stress distribution.
Fig.8 shows the comparison of maximum principal stress tensile in weir block under all seven load combinations. It can be observed from the bar chart distribution that maximum tensile stress develops under load combination G.
The peak value of inimum principal stress of the order of 25.909 kg/cm2 compressive has been observed to develop near the heel region of the weir block under load combination D as shown in fig. 9.
Fig.7: Maximum Principal Stress near hoist chamber under load
combination G
Fig.8: Comparison of Maximum Principal Stress under seven load combinations
Fig.9: Distribution of Minimum Principal Stress in the Dambody under load combination D
International Journal of Emerging Technology and Advanced Engineering
Website: www.ijetae.com (ISSN 2250-2459, ISO 9001:2008 Certified Journal, Volume 5, Issue 1, January 2015)
489
Fig.10 shows the comparison of peak value of minimum principal stress compression in weir block under all seven load combinations.
The peak value of minimum principal stress compressive developed in weir block has been observed to remain well within allowable compressive strength of concrete and also within allowable compressive stress limits for concrete gravity dams7.
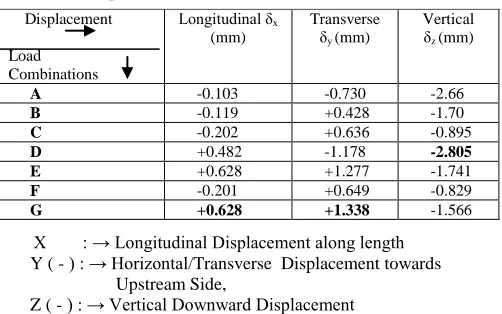
The displacements under all load combinations along three directions also remain within elastic range. A comparison of displacements along three directions is given in Table II as below:
X : → Longitudinal Displacement along length Y ( - ) : → Horizontal/Transverse Displacement towards Upstream Side,
Z ( - ) : → Vertical Downward Displacement
IV. DISCUSSION OF RESULTS AND CONCLUSIONS
These results of 3D analysis are obtained in the form of stresses and displacements. Only useful results from the design point of view under static and earthquake load combinations are discussed as below:
The maximum principal stresses under static load combinations A, B, C and F developed is of the order of 9.3598 Kg/cm2 near the under sluice barrel of dam. The maximum tensile stress developed under static load combinations A, B, C & F is found to be within permissible tensile strength of the concrete.
Under earthquake load combination D, E and G , the maximum principal stress developed is of the order of 11.361 Kg/cm2 near the Heel (Upstream corner) of dam. The maximum tensile stress developed under all earthquake load combinations is found within permissible tensile strength of the concrete.
Though the maximum tensile stress developed in weir block has been observed to remain within allowable tensile strength of concrete, but due to spread of tensile stress on large area, it has become necessary to provide steel reinforcement around openings to compensate tensile stress distribution.
The minimum principal stress of the order of 23.579Kg/cm2 per cm length (compressive) has been found to have developed in the dambody and foundation under load combination ‗D‘ and is well within allowable limits.
The displacements developed under all load combinations are well within permissible limits as IS:456-2000 guidelines. The displacements developed under all load combinations are not excessive and pose no risk to the structural integrity of the structure.
In the present study, realistic pseudodynamic approach has been adopted for carrying out 3D stress using FEM under earthquake load combinations.
Acknowledgements
The authors express their sincere gratitude to S. Govindan, Director, CWPRS, Pune for continuous day to day encouragement and valuable guidance during preparation of the paper. The authors are further grateful to Sardar Sarovar Narmada Nigam Ltd. , Project Authority for providing relevant data and drawings. The authors are also thankful to the staff of Structural Modelling and Analysis Division for their assistance during studies and preparation of this paper.
REFERENCES
[1] Zienkiewicz O.C. (1977). The Finite Element Method, McGRAW-HILL Book Company(UK) Limited(Page 107-115)
[2] ICOLD BULLETIN 30 ( January 1978) Finite Element Methods In Analysis And Design Of Dams (Page 20-23)
[3] IS Code 6512 – 1984, Criteria for Design of Solid Gravity Dams. [4] IS Code 1893 (Part I) – 2002, Criteria For Earthquake Resistant
Design Of Structures
[5] IS Code 1893 – 1984, Criteria For Earthquake Resistant Design Of Structures
[6] IS Code 456 ( Fourth Revision) – 2000, Code Of Practice For Plain And Reinforced Concrete
[7] http://web.iitd.ac.in/~chahar/Courses/CEL351/CEL351_GravityDam _StabilityAnalysis.pdf
[8] SOLVIA, User Manual (Version 99).
[9] CWPRS Technical Report 4990, August 2012 ―3D Stress Analysis by FEM of Modified Overflow Block No.25 with Multiple openings of Garudeshwar Weir, Sardar Sarovar Narmada Nigam Limited, Vadodara, Gujarat ‖.
Displacement
Load Combinations
Longitudinal δx
(mm)
Transverse δy (mm)
Vertical δz (mm)
A -0.103 -0.730 -2.66
B -0.119 +0.428 -1.70
C -0.202 +0.636 -0.895
D +0.482 -1.178 -2.805
E +0.628 +1.277 -1.741
F -0.201 +0.649 -0.829
[image:7.612.44.295.298.455.2]G +0.628 +1.338 -1.566
Table II
International Journal of Emerging Technology and Advanced Engineering
Website: www.ijetae.com (ISSN 2250-2459, ISO 9001:2008 Certified Journal, Volume 5, Issue 1, January 2015)
490
[10] US Army Corps of Engineers, EM 1110-2-2200 (30 June 1995), ENGINEERING AND DESIGN, Gravity Dam Design.