International Journal of Emerging Technology and Advanced Engineering
Website: www.ijetae.com (ISSN 2250-2459, ISO 9001:2008 Certified Journal, Volume 6, Issue 6, June 2016)
112
Validation and Modeling of FEA Welding Simulation and
Parametric Study of TIG Welding Parameter
Akash B. Chovatiya
1, P. M. Ravanan
2, H. S. Mahadik
31M.tech Student, 2Associate Professor, Veermata Jijabai Technological Institute, Mumbai, Maharashtra, India 3Manager, Larsen & Toubro Limited, Powai, Mumbai, Maharashtra, India
Abstract— One of the major problems in welded structures is the welding residual stress and welding distortion due to local heating. This work has validated maximum stress on weld bead due to welding process in ANSYS v14.5 simulation software and Experimental Procedure. Residual stress after welding is measured by X-Ray Diffraction non-destructive method. This validation helps for predicting the temperature distributions and maximum stress induced in Titanium plates due to the welding process. A Gaussian mathematical model of transient thermal process in line heating, suitable boundary conditions and non-linear material properties have been used to simulate the transient thermal analysis with moving heat source model by using finite element method. Finite element models have been developed. The effect of different parameters on the line heating response (temperature distribution) including the torch speeds, heat inputs, thicknesses of plates has been studied.
Keywords— FEA, Residual Stress, Validation, Welding simulation, X-Ray Diffraction method
I. INTRODUCTION
Welding is the fundamental process in manufacturing marine structures, ship building, process equipment etc. Welding deformation is inevitable due to non-uniform distribution of temperature and plastic yielding during welding. It depends on various factors such as plate thickness, welding speed, heat input, material properties etc. The deformation due to welding is one of the principal obstacles in enhancing the productivity in manufacturing procedure of process equipment like heat exchanger, nuclear equipment, aero-space equipment. It is more important to know how much deformation and residual stress produced due to welding with different welding parameters. The problem of welding distortions during large titanium fabrications lead to dimensional inaccuracies and misalignment of structural members. This increases the cost of production and leads to delays. Therefore, the problems of distortion and residual stresses are always of great concern in welding industry.
In order to deal with this problem, it is necessary to predict the amount of distortion resulting from the welding operations.
One way to predict the distortion and shrinkage of titanium welding is through numerical analysis such as finite element analysis (FEA).
The research activity in welding simulation started decades ago. Rosenthal (1946) was among the first researchers to develop an analytical solution of heat flow during welding based on conduction heat transfer for predicting the shape of weld pool for two and three-dimensional welds.
J. dutta, Narendranath S. et al in year 2014 [4] investigated influence of thermal cycle on temperature dependent process parameters involved in GTA welded High carbon steel joints.
Djarot B. Darmadi et al.in the year 2011 [5] validated the accuracy of heat source model via temperature histories and temperature field in bead-on-plate welding.
Pankaj Biswas et al. [6] analyzed transient temperature profile of laser welding Ti-6Al-4V Alloy. He did a 3-D finite element analysis considering effect of latent heat of fusion and convective and radiative boundary conditions.
Nirbhay L Ranpariya et al. in the year of 2015 [7] analyzed the welding process using Gaussian heat distribution model. He did temperature field analysis and used 5 mm thick AA 5083 plates for experiment model and derived good agreement between them.
International Journal of Emerging Technology and Advanced Engineering
Website: www.ijetae.com (ISSN 2250-2459, ISO 9001:2008 Certified Journal, Volume 6, Issue 6, June 2016)
113
II. EXPERIMENTAL STUDIES &FEAA. Experiment and measurement:
1. Specification of TIG welding machine: Specification of welding machine are shown in Table I which has been used to weld two plates of same dimensions of 250*75*6 mm.
Table I
Specification of TIG Machine
Parameter Specificaation
Supply voltage 8-20 volt Supply Current 80-220 amp Shielding Gas Argon
Tungsten Elecrode 2% thoriated Tungsten
Polarity DC-DCEN
Work piece 250*150*6 mm
2. Experimental parameter: Parameters that have been used during TIG welding are shown in TABLE II. Also Figure I shows the welded Titanium plate.
Table II Welding parameter
Sr. No. Parameter Unit Value
1 Welding Current amp 80
2 Welding Voltage volt 15
3 Thickness of the plate mm 6
4 Welding speed mm/s 3
3. Heat input: Heat Input is typically calculated as the ratio of the power (i.e. voltage*current) to the velocity of the heat source (i.e. the Arc) as follows:
H =
=
= 0.24 kJ/mm
where,
H = heat input (kJ/mm) V = arc voltage (volts) I = current (amps)
[image:2.612.324.565.131.281.2]= travel speed (mm/s)
Figure 1: Welded Titanium Plates
4. X-Ray Diffraction Method: Diffraction methods are based on determining the elastic deformation which will use changes in the inter-planar spacing-d from their stress
free value-d0. Then, the strain could be calculated by using
Bragg’s law.
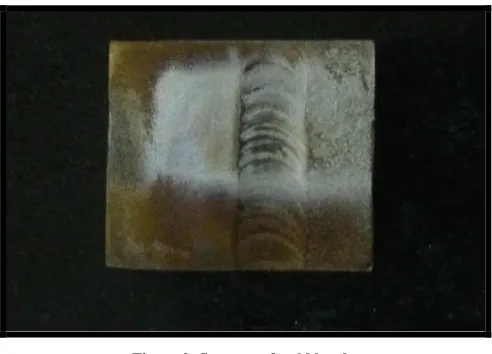
[image:2.612.324.570.400.577.2]Electro-polishing had been done before putting piece of plate in X-Ray diffractometer machine. Weld bead is marked in figure 1 and that 25*25*5 mm piece was cut as shown in figure 2.
Figure 2: Segment of weld bead
Maximum Residual stress obtained in longitudinal direction of weld bead was 169.9 MPa having deviation ±4.97.
B. FEA Procedure:
There are three phases to perform FEA analysis:
International Journal of Emerging Technology and Advanced Engineering
Website: www.ijetae.com (ISSN 2250-2459, ISO 9001:2008 Certified Journal, Volume 6, Issue 6, June 2016)
114
ii) Solver: executing numerical solution i.e. interpolationfunctions, internal virtual work of element, creating element matrices, calculations of nodal displacements, assembly of system matrices
iii) Post-processor for evaluation of results: Deformation and stress graphics, contour plot, natural frequency results, analysis of heat, temperature. It contains animation service.
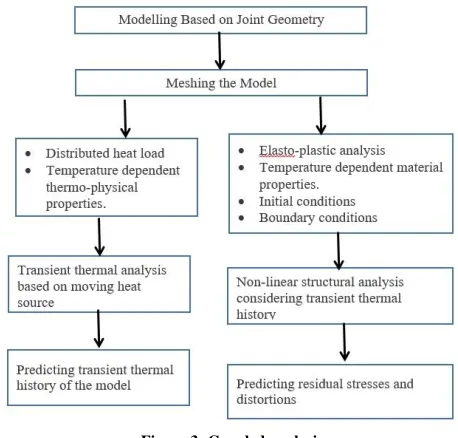
1. 3D-Coupled Thermo-mechanical Analysis: Figure 3 shows 3D-coupled thermo-mechanical analysis to perform welding simulation in ANSYS v14.5.
Figure 3: Coupled analysis
2. CAD Model: The overall dimensions of plate for analysis taken are 27*15*6 mm due to ease of analysis, saving computer processing time. The welding procedure is modeled as a single pass in this analysis. No overfill of the weldment were considered.
[image:3.612.326.564.210.373.2]Length of the weld bead taken is 27 mm and it is divided into 9 segments. So we can able to apply torch speed 3 mm/s giving heat flux to the area.
Figure 4: CAD model
[image:3.612.52.281.269.488.2]3. Meshing
:
A free mesh has no restrictions in terms of element shapes and has no specified pattern applied to it. Mapped mesh is restricted in terms of the element shape and the pattern of the mesh. A mapped area mesh contains either only quadrilateral or only triangular elements while a mapped volume mesh contains only hexahedron elements.Figure 5: Mapped mesh
4. Material used and its properties: Ti6Al4V material is used. It is recognized for its high strength-to-weight ratio. The relatively high melting point makes it useful as a refractory metal.
Temperature dependent material properties are needed in the analysis. The modulus of elasticity is a measure of the stiffness of a material. A higher modulus material is more likely to resist distortion. The amount of expansion or contraction of a metal will undergo during a heating or a cooling cycle depends on the coefficient of thermal expansion. Thermal conductivity gives a measure of the ease of heat flow through a material.
The melting and boiling point temperature of Ti is 1668˚
C and 3287˚ C respectively. Density of Ti is 4506 kg/m3.
Other temperature dependent thermo-physical material properties are shown in the following tables:
TABLE III
Temp.-dependent material properties
Tempe. (.C)
Specific Heat (J/kg K)
Tempe. (.C)
Thermal expansion Coefficient (E-06)(/
.
C)
0 565 0 9.0
20 580 250 9.5
205 610 500 9.9
425 670 750 10.5
650 760 1000 10.8
[image:3.612.53.285.599.706.2]International Journal of Emerging Technology and Advanced Engineering
Website: www.ijetae.com (ISSN 2250-2459, ISO 9001:2008 Certified Journal, Volume 6, Issue 6, June 2016)
115
Tempe. (.C)
Thermal conductivity
(W/m K)
Tempe. (.C)
Young’s Modulus (GPa)
20 6.6 21 106
93 7.3 93 103
205 9.1 149 100
315 10.6 204 96
425 12.6 260 91
540 14.6 316 86
650 17.5 371 82
427 77
5. Heat flux calculation: Here, top surface area of weld
bead shown in figure 4 is 11.892 mm2.
Heat flux =
W/
=
= 60.54 W/
6. Transient Thermal Analysis: The room temperature was taken 22˚ C to the all surfaces of the plate. The value of the
convective film coefficient is 100 W/m2˚ C. Element birth
and death technique has been used for applying heat flux
(W/mm2) and creating moving heat source.
Figure 6: Welding at 8 sec
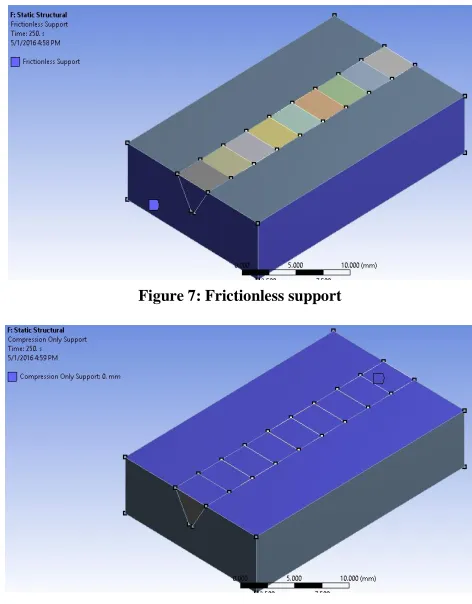
7. Static Structural Analysis: After completion of transient thermal analysis, to perform static structural analysis, thermal history of thermal analysis was imported as a load in static analysis.
[image:4.612.324.560.195.497.2]Boundary conditions applied are 1) frictionless support to allow translational displacement in all directions except into and out of the supported plane and 2) Compression only support to restrict movement in bottom direction and allow free movement in upper direction.
Figure 7: Frictionless support
Figure 8: Compression only support
III. RESULTS &DISCUSSION
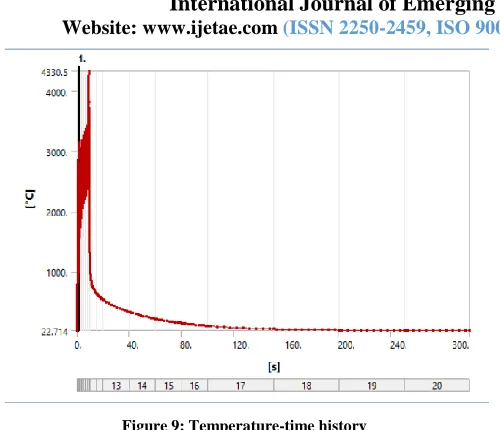
A. Temperature-time history graph
Here, we got temperature time history graph. Welding is a local heating process. Heat is concentrated on one point and as torch passes from one point to other point temperature drop at previous point is high.
[image:4.612.49.290.465.620.2]International Journal of Emerging Technology and Advanced Engineering
Website: www.ijetae.com (ISSN 2250-2459, ISO 9001:2008 Certified Journal, Volume 6, Issue 6, June 2016)
[image:5.612.46.296.110.325.2]116
Figure 9: Temperature-time historyB. Static structural result
Static structural analysis gave the maximum residual stress in longitudinal direction of weld bead and that value is 146.62 Mpa. Figure 10 shows the condition of welded plate when it comes to the room temperature.
Figure 10: Residual stress distribution
C. Parametric study on Temperature variation
[image:5.612.322.564.129.252.2]1. Voltage: By keeping welding current, thickness, efficiency factor, welding speed constant variation of voltage vs. maximum temperature after welding gives graph shown in figure 11.
Figure 11: Voltage vs. Temperature
[image:5.612.323.564.299.419.2]2. Welding Speed: Graph of variation of welding speed vs. maximum temperature after welding is shown in figure 12.
Figure 12: Welding speed vs. Temperature
3. Thickness of the plate: Graph of variation of thickness of plate vs. maximum temperature after welding is shown in figure 13.
Figure 13: Thickness vs. Temperature
[image:5.612.48.289.397.562.2] [image:5.612.326.563.484.610.2]International Journal of Emerging Technology and Advanced Engineering
Website: www.ijetae.com (ISSN 2250-2459, ISO 9001:2008 Certified Journal, Volume 6, Issue 6, June 2016)
[image:6.612.49.293.132.252.2]117
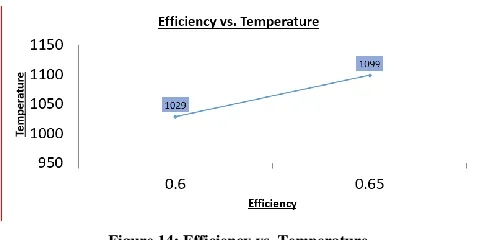
Figure 14: Efficiency vs. TemperatureIV. CONCLUSION
The following conclusions are drawn from the present work:
1. Development of 3-dimensional coupled
thermo-mechanical finite element model of a TIG welding process is described in this work.
2. Maximum residual stress in longitudinal direction of
weld bead obtained from FEA procedure is 146.62 MPa which is quite near to the value 169.9 MPa i.e. residual stress measured by experiment procedure. This validate the FEA procedure.
3. Parametric study i.e. Variation of temperature by
varying welding voltage, efficiency of joint, welding speed and thickness of the plate is observed.
4. The end temperature is gradually increasing from 1302
to 1414˚C as the voltage is varied from 15 to 17 V.
5. The end temperature is gradually decreasing from 1670
to 1080 ˚ C as the welding speed increases from 2 mm/s to 4 mm/s.
6. The end temperature is gradually decreasing from 1302
to 1095 ˚ C as the thickness of plate is varied from 6 to 15 mm.
7. The end temperature is gradually increases as efficiency
of joint is increases.
REFERENCES
[1] Bai-Qiao Chen, M. Hashemzadeh & C. Guedes Soares, ―Numerical Analysis Of The Effects Of Weld Parameters On Distortions And Residual Stresses In Butt Welded Steel Plates‖ Developments In Maritime Transportation And Exploitation Of Sea Resources, Page No. 309-320, 2014
[2] Paulo Roberto De Freitas Teixeira, Douglas Bezerra De Araújo, Luiz Antônio Bragança Da Cunha, ―Study Of The Gaussian Distribution Heat Source Model Applied To Numerical Thermal Simulations Of Tig Welding Processes‖, Science & Engineering Journal, Isbn 1983-4071
[3] P Biswas, M M Mahapatra, And N R Mandal, ―Numerical And Experimental Study On Prediction Of Thermal History And Residual Deformation Of Double-Sided Fillet Welding‖, Proc. Imeche, Vol. 224, Page No. 125-134, 2009
[4] J. Dutta, Narendranath S., ―Influence Of Thermal Cycle On Temperature Dependent Process Parameters Involved In Gta Welded High Carbon Steel Joints‖ International Journal Of Mechanical, Aerospace, Industrial, Mechatronic And Manufacturing Engineering Vol:8, No:9, Page No. 1625-1631, 2014
[5] Djarot B. Darmadi, ―Validating The Accuracy Of Heat Source Model Via Temperature Histories And Temperature Field In Bead-On-Plate Welding‖ International Journal Of Engineering & Technology, Vol:11, No:5, Page No.9-17
[6] Chandan Kumar, Manas Das, Pankaj Biswas, ―A 3-D Finite Element Analysis Of Transient Temperature Profile Of Laser Welded Ti-6al-4valloy‖ 5th International & 26th All India Manufacturing Technology, Design And Research Conference, 12-14 December, 2014
[7] Nirbhay L Ranpariya, M Y Patil, M H Thakkar, ―Temperature Distribution Analysis In Pulse Gas Metal Arc Welding Process‖ International Journal For Scientific Research & Development, Vol. 3, Issue 03, Page No. 2389-2392, 2015
[8] N. Akkuş, G. Genç, S. Şen, ―Experiments And Finite Element Analysis Of Arc Welding Residual Stresses‖ International Congress On Advances In Welding Science And Technology For Construction, Energy And Transportation Systems, 24-25 October 2011
[9] G. Mi – C. Li – Z. Gao– D. Zhao – J. Niu, ―Finite Element Analysis Of Welding Residual Stress Of Aluminum Plates Under Different Butt Joint Parameters‖ Engineering Review, Vol. 34, Issue 3, Page No.161-166, 2014
[10] D. Gery, H. Long, P. Maropoulos, ―Effects Of Welding Speed, Energy Input And Heat Source Distribution On Temperature Variations In Butt Joint Welding‖ Elsevier Journal Of Materials Processing Technology, Vol.167, Page No.393–401, 2005
[11] Dean Deng ―Fem Prediction Of Welding Residual Stress And Distortion In Carbon Steel Considering Phase Transformation Effects‖, Elsevier Journal Of Materials & Design, Vol.30, Page No. 359–366,2009
[12] K.C. Ganesha, M. Vasudevanb, K.R. Balasubramaniana, N. Chandrasekharb, S. Mahadevanb, P. Vasantharajab And T. Jayakumarb ―Modeling, Prediction And Validation Of Thermal Cycles, Residual Stresses And Distortion In Type 316 Ln Stainless Steel Weld Joint Made By Tig Welding Process‖ 1st International Conference On Structural Integrity, Icons-2014, Vol.86, Page No. 767-774,2014
[13] Asifa Khurram And Khurram Shehzad, ―Fea Simulation Of Welding Distortion And Residual Stresses In Butt Joint Using Inherent Strain‖ International Journal Of Applied Physics And Mathematics, Vol. 2, No. 6, November 2012
[14] Mr. Harshal K. Chavan Mr. Gunwant D. Shelake Dr. M. S. Kadam, ―Effect Of Heat Input And Speed Of Welding On Distortion In Mig Welding
[15] Welding Engineering And Technology By Dr. R.S.Parmar, Chapter 2 & 4