International Journal of Emerging Technology and Advanced Engineering
Website: www.ijetae.com (ISSN 2250-2459, ISO 9001:2008 Certified Journal, Volume 6, Issue 3, March 2016)
69
Influence of Soil Structure Interaction on the Seismic Response
of a Multi Storied Building on Isolated Footings
Ch Surya Teja
1, D S R Murty
2 1Post Graduate Student, Department of Civil Engineering, Andhra University, Visakhapatnam, India 2Professor & Head of Department, Department of Civil Engineering, Andhra University, Visakhapatnam, India
Abstract— Soil conditions deal a great damage to structures during earthquakes. Thus, the need for research into soil structure interaction (SSI) is greater. Moreover, recent studies show that the effects of SSI may be detrimental to the seismic response of structure and neglecting SSI in analysis may lead to un-conservative design. Despite this, the conventional design procedure usually involves assumption of fixity at the base of foundation neglecting the flexibility of the foundation, the compressibility of the underneath soil and, consequently, the effect of foundation settlement. Hence the SSI analysis of a multi-storey building is the main focus of this work; the effects of SSI are analysed for the building considered by using springs to model the foundation. In the present work, the analysis of the building (G+9) with and without considering infill has been carried out by incorporating the effect of SSI by springs for three different types of soils such as silty sand, dense sand and dense gravel, and three different earthquake intensities according to IS 1893:2002 using ETABS. The stiffness of the springs are determined by the formulas given by Gazetas and Mylonkais. The seismic response such as storey drift ratio and lateral displacements are evaluated. From the study it has been observed that the storey drift are decreasing as the soil stiffness is increasing. Silty sand having less stiffness has pronounced effect on the seismic response. Dense gravel having high stiffness has almost the same effect of fixed base model.
Keywords—Soil Structure Interaction, Storey Drift Ratio, Storey Lateral Displacement, ETABS, Springs.
I. INTRODUCTION
The interaction among structures, their foundations and the soil medium below the foundations is called as Soil-structure interaction (SSI). Soil–Soil-structure interaction is an interdisciplinary field which lies at the intersection of soil and structural mechanics, soil and structural dynamics, earthquake engineering, material science, computational and numerical methods, and diverse other technical disciplines.
Soil conditions have a great deal to do with damage to structures during earthquakes. Hence the investigation on the energy transfer mechanism from soils to buildings during earthquakes is critical for the seismic design of multi-storey buildings.
Moreover, studies show that the effects of SSI may be detrimental to the seismic response of structure and neglecting SSI in analysis may lead to un-conservative design. Despite this, the conventional design procedure usually involves assumption of fixity at the base of foundation neglecting the flexibility of the foundation, the compressibility of the underneath soil and, consequently, the effect of foundation settlement on further redistribution of bending moment and shear force demands. The inclusion of the soil in the structural analysis provides results, stress and displacement values, which are closer to the actual behavior of the structure than those provided by the analysis of a fixed-base structure.
The objective of this study is to consider the SSI effects in the building model. The main task is to incorporate the soil properties, particularly the soil stiffness and footing, into the structure model. Winkler based model is used for capturing the effect of SSI. The model is intended to be used for evaluating the seismic response of building subjected to three earthquake intensities, located in three different type of soils.
II. LITERATURE REVIEW
George Gazetas (1990) had presented a complete set of algebraic formulas and dimensionless charts for readily computing the dynamic stiffnesses (K) and damping coefficients (C) of foundations harmonically oscillating on/in a homogeneous half-space. All possible modes of vibration, a realistic range of Poisson's ratios, and a practically sufficient range of oscillation frequencies had been considered. The foundations have a rigid base-mat of any realistic solid geometric shape. He had explained using two numerical examples how to use the formulas and charts and elucidate the role of foundation shape for various modes of vibration.
International Journal of Emerging Technology and Advanced Engineering
Website: www.ijetae.com (ISSN 2250-2459, ISO 9001:2008 Certified Journal, Volume 6, Issue 3, March 2016)
70
He has determined that kinematic interaction effects on the input motion at the bases of structures are relatively modest in many cases, whereas inertial interaction effects on the structural response to these motions can be significant. He has evaluated fixed and flexible base model vibration parameters to determine first-mode period lengthening ratios T˜ /T and foundation damping factors to quantify inertial interaction effects. He had observed that response of some structures in dominated by inertial interaction and others undergo negligible soil structure interaction. He has presented simplifies analytical formulations to predict inertial interaction effects. It has been concluded that inertial interaction has pronounced influence on structure to soil stiffness, structure aspect ratio and foundation embedment, type, shape, and flexibility.
III. METHODOLOGY
During earthquake shaking, soil deforms under the influence of the incident seismic waves and carries dynamically with it the foundation and the supported structure. In turn, the induced motion of the superstructure generates inertial forces which result in dynamic stresses at the foundation that are transmitted into the supporting soil. Thus, superstructure-induced deformations develop in the soil while additional waves emanate from the soil– foundation interface. In response, foundation and superstructure undergo further dynamic displacements, which generate further inertial forces and so on. The above phenomena occur simultaneously.
A. Building Configuration
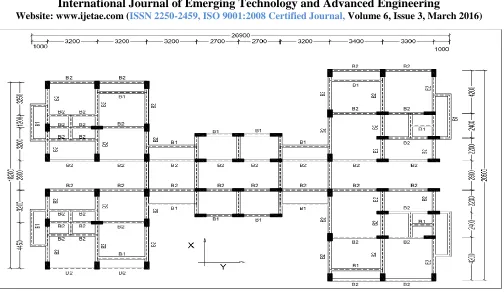
The Details of the building model (G + 9), with individual storey height of 3.2m is considered for the study. The total height of the building considered is 32m. The building considered also has vertical irregularity and is shown in figure 1.
The Grade of Concrete and Steel used for analysis is M30 & Fe500 respectively. Masonry Infill is modelled using Clay burnt brick conforming to Class A, as confined unreinforced masonry with Density of 22 kN/m3, Compressive Strength 5 MPa and Modulus of Elasticity 2750 MPa.
FEMA 365 recommends the equivalent diagonal strut method for considering unreinforced masonry infill in the analysis. The elastic in-plane stiffness of a solid unreinforced masonry infill panel prior to cracking is represented with an equivalent diagonal compression strut of width, a, given by Equation1.
The equivalent strut shall have the same thickness and modulus of elasticity as the infill panel it represents.
a = 0.175( 1hcol) –0.4 rinf ……… (1) 1 = [ me inf
fe col inf
]
1/4……… (2)
Where hcol = Column height between centerlines of beams; hinf = Height of infill panel; Efe = Expected modulus of elasticity of frame material; Eme = Expected modulus of elasticity of infill material; Icol = Moment of inertia of column; Linf = Length of infill panel; rinf = Diagonal length of infill panel; tinf = Thickness of infill panel and equivalent strut; = Angle whose tangent is the infill height-to length aspect ratio; 1 = Coefficient used to
determine equivalent width of infill strut.
Beam Sections of size B1: 300 x 450 mm, B2: 300 x 500 mm; Column Section of size C1: 300 x 600 mm along with 125mm thick Slab Section is used to model the structural elements. The building is designed according to IS 456-2000. Loads are considered as per IS 875 (part 1, and part 2 for dead and live loads respectively) and the earthquake loads considered are as per IS 1893 (part 1): 2002. The loads due to Earthquake are determined by equivalent static method.
Isolated footings are designed based on the reactions of fixed model for service loads for the building considered for the analysis. The different types of footings considered are F1: 2.5 x 2.5 m, F2: 2.7 x 2.7 m, F3: 1.5 x 3.2 m, F4: 2.3 x 2.3 m, F5: 2.0 x 2.0 m shown in the Figure 2. To consider the effect of SSI on the response of the building the underneath soil is modelled by Winkler spring approach with equivalent static stiffness for three different types of soils having modulus of elasticity in the range from 13, 60 and 150 MPa for silty sand, dense sand and dense gravel. The properties of the soil considered are taken from ―FOUNDATION ANALYSIS AND DESIGN by Joseph E. Bowles‖. The static stiffness of the springs are determined by using the Equations 3, 4 and 5 are tabulated in the Table 1. Static Stiffness in vertical, horizontal and lateral direction is given by
K z =
[0.73+ 1.54 ( )
0.75] ……… (3)
K y =
[2+ 2.5 ( )
0.85] ……… (4)
K x = K y -
GL[1- ( )] ……… (5)
Such that L≥ B and size of the foundation is 2L x 2B. Where G =
is Shear Modulus and is poison’s
International Journal of Emerging Technology and Advanced Engineering
Website: www.ijetae.com (ISSN 2250-2459, ISO 9001:2008 Certified Journal, Volume 6, Issue 3, March 2016)
[image:3.612.57.561.109.401.2]71
Figure. 1. Layout showing the Building Configuration
TABLEI
STATIC STIFFNESS OF FOOTINGS
Soil
Type Elasticity Footing kx ky kz
S-1 Silty Sand
13 MPa
F1 33088.2 33088.2 40535.7 F2 35735.2 35735.2 43778.5 F3 29291.5 31180.4 36626.7 F4 30441.1 30441.1 37292.8 F5 26470.5 26470.5 32428.5
S- 2 Dense
Sand
60 MPa
F1 152714.9 152714.9 187087.9 F2 164932.1 164932.1 202055.0 F3 135191.9 143909.9 169046.7 F4 140497.7 140497.7 172120.9 F5 122171.9 122172.0 149670.3
S-3 Dense
Gravel 150 MPa
F1 381787.3 381787.3 467719.8 F2 412330.3 412330.3 505137.4 F3 337979.9 359774.7 422616.8 F4 351244.3 351244.3 430302.2 F5 305429.9 305429.9 374175.8
IV. RESULTS AND DISCUSSIONS
The Building model (G +9) considered has been analysed using ETABS, incorporating foundation springs and infill walls as described above.
The different models considered are represented by the nomenclature tabulated in Table II.
TABLEII
NOMENCLATURE OF DIFFERENT MODELS
MF : Model with fixed base MS-1 : Model with soil type S-1 MS-2 : Model with soil type S-2 MS-3 : Model with soil type S-3
MIF : Model with infill wall and fixed base MIS-1: Model with infill wall and soil type S-1 MIS-2: Model with infill wall and soil type S-2 MIS-3: Model with infill wall and soil type S-3
The seismic response of the building is compared for different earthquake intensities and soil types. The results are presented separately for all the above models for three different earthquake intensities confining to the Zone – III, IV and V, according to IS 1893: 2002. The seismic responses such as storey drift ratio and storey displacements are evaluated.
A. Storey Drift Ratio
[image:3.612.43.296.430.655.2] [image:3.612.350.539.473.569.2]International Journal of Emerging Technology and Advanced Engineering
Website: www.ijetae.com (ISSN 2250-2459, ISO 9001:2008 Certified Journal, Volume 6, Issue 3, March 2016)
72
[image:4.612.328.547.138.353.2]It is unit less. The storey drift ratio are investigated for the studied building of 10-storey using equivalent static earthquake load based on Indian Code provisions for seismic design. The storey drift ratio over the building height for different soil conditions ranging from silty sand, dense sand to dense gravel along with the response of the SSI model to that of fixed-base model are introduced in Figure 2 to Figure 7 andTable III toTable IV.According to IS 1893:2002 the maximum storey drift ratio shall not exceed 0.004.
Figure. 2. Storey drift ratios along X-direction for zone – III Earthquake
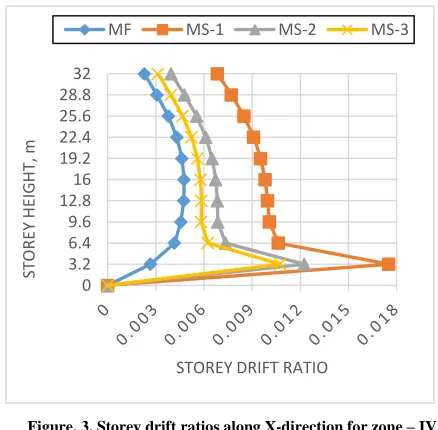
Figure. 3. Storey drift ratios along X-direction for zone – IV Earthquake
Figure. 4. Storey drift ratios along X-direction for zone – V Earthquake
Figure 2 to Figure 4 show that the storey drift ratios increases gradually along the height of the building and reaches its maximum value at 5th storey for all the MF models, and reaches maximum at 1st storey for all the MS-1, MS-2 and MS-3 models. The maximum values in MF, MS-1, MS-2 and MS-3 are 0.0021, 0.0078, 0.0054, 0.0048 for zone– III earthquake, 0.0032, 0.0117, 0.0082, 0.0072 for zone- IV earthquake and 0.0048, 0.0175, 0.0123, 0.0108 for zone – V earthquake respectively along X-direction.
Storey drift ratios for MS-1 are maximum compared to all other models. Storey drift ratios of MS-3 are nearer to MF model. As the soil stiffness decreases, the storey drift ratios are increasing. The storey drift ratios for MF are within the permissible limits, MS-1, MS-2 and MS-3 are found to exceed the permissible limits. The storey drift ratio curve of MF is idealized curve, whereas MS-1, MS-2, MS-3 storey drift ratio curves represents realistic curve.
0 3.2 6.4 9.6 12.8 16 19.2 22.4 25.6 28.8 32
ST
O
R
EY
H
EIG
H
T,
M
STOREY DRIFT RATIO
MF MS-1 MS-2 MS-3
0 3.2 6.4 9.6 12.8 16 19.2 22.4 25.6 28.8 32
ST
O
R
EY
H
EIG
H
T,
m
STOREY DRIFT RATIO
[image:4.612.58.279.257.691.2] [image:4.612.60.278.259.460.2]International Journal of Emerging Technology and Advanced Engineering
Website: www.ijetae.com (ISSN 2250-2459, ISO 9001:2008 Certified Journal, Volume 6, Issue 3, March 2016)
73
TABLEIIISTORY DRIFT RATIOS ALONG X-DIRECTION
TABLEIV
STORY DRIFT RATIOS CONSIDERING INFILL WALLS ALONG X-DIRECTION
Earthquake Loading Zone – III Storey drift ratios Zone – IV Storey drift ratios Zone - VStorey drift ratios
Storey No Height, m MF MS-1 MS-2 MS-3 MF MS-1 MS-2 MS-3 MF MS-1 MS-2 MS-3
Storey10 32.0 0.0010 0.0030 0.0018 0.0014 0.0015 0.0046 0.0026 0.0021 0.0023 0.0068 0.0040 0.0031 Storey9 28.8 0.0014 0.0034 0.0021 0.0017 0.0020 0.0051 0.0032 0.0026 0.0031 0.0077 0.0048 0.0039 Storey8 25.6 0.0017 0.0038 0.0025 0.0021 0.0025 0.0057 0.0037 0.0031 0.0038 0.0085 0.0055 0.0047 Storey7 22.4 0.0019 0.0040 0.0027 0.0023 0.0029 0.0061 0.0041 0.0035 0.0043 0.0091 0.0061 0.0052 Storey6 19.2 0.0021 0.0042 0.0029 0.0025 0.0031 0.0064 0.0043 0.0037 0.0046 0.0095 0.0065 0.0056 Storey5 16.0 0.0021 0.0044 0.0030 0.0026 0.0032 0.0065 0.0045 0.0039 0.0048 0.0098 0.0067 0.0058 Storey4 12.8 0.0021 0.0044 0.0030 0.0026 0.0032 0.0066 0.0046 0.0039 0.0047 0.0100 0.0068 0.0058 Storey3 9.6 0.0020 0.0045 0.0031 0.0026 0.0030 0.0067 0.0046 0.0039 0.0046 0.0101 0.0069 0.0058 Storey2 6.4 0.0019 0.0047 0.0033 0.0028 0.0028 0.0071 0.0049 0.0042 0.0042 0.0106 0.0073 0.0062 Storey1 3.2 0.0012 0.0078 0.0054 0.0048 0.0018 0.0117 0.0082 0.0072 0.0027 0.0175 0.0123 0.0108
Earthquake Loading Zone – III Storey drift ratios Zone – IV Storey drift ratios Zone – V Storey drift ratios
Height,m MIF MIS-1 MIS-2 MIS-3 MIF MIS-1 MIS-2 MIS-3 MIF MIS-1 MIS-2 MIS-3
Storey10 32.0 0.00026 0.00075 0.00044 0.00031 0.00040 0.00113 0.00066 0.00047 0.00059 0.00169 0.00099 0.00070
Storey9 28.8 0.00034 0.00084 0.00053 0.00038 0.00051 0.00126 0.00079 0.00057 0.00077 0.00189 0.00118 0.00085
Storey8 25.6 0.00041 0.00092 0.00060 0.00044 0.00062 0.00137 0.00090 0.00066 0.00093 0.00206 0.00135 0.00100
Storey7 22.4 0.00046 0.00098 0.00066 0.00049 0.00070 0.00146 0.00099 0.00074 0.00104 0.00220 0.00148 0.00110
Storey6 19.2 0.00049 0.00102 0.00070 0.00052 0.00074 0.00153 0.00104 0.00078 0.00111 0.00229 0.00156 0.00117
Storey5 16.0 0.00051 0.00105 0.00072 0.00054 0.00076 0.00157 0.00108 0.00080 0.00114 0.00235 0.00161 0.00121
Storey4 12.8 0.00050 0.00106 0.00073 0.00054 0.00075 0.00159 0.00109 0.00081 0.00113 0.00239 0.00163 0.00121
Storey3 9.6 0.00048 0.00107 0.00073 0.00054 0.00072 0.00161 0.00109 0.00081 0.00109 0.00241 0.00164 0.00121
Storey2 6.4 0.00044 0.00113 0.00078 0.00058 0.00066 0.00170 0.00117 0.00086 0.00099 0.00254 0.00175 0.00129
International Journal of Emerging Technology and Advanced Engineering
Website: www.ijetae.com (ISSN 2250-2459, ISO 9001:2008 Certified Journal, Volume 6, Issue 3, March 2016)
[image:6.612.61.279.117.567.2]74
Figure. 5. Storey drift ratios considering infill walls alongX-direction for zone – III Earthquake
Figure. 6. Storey drift ratios considering infill walls along X-direction for zone – IV Earthquake
Figure 5 to Figure 7 show that the storey drift ratios considering infill walls increases gradually along the height of the building and reaches its maximum value at 5th storey for all the MIF models, and reaches maximum at 1st storey for all the MIS-1, MIS-2 and MIS-3 models.
[image:6.612.327.563.202.401.2]The maximum values in MIF, MIS-1, MIS-2 and MIS-3 are 0.00051, 0.00186, 0.00120, 0.00099 for zone – III earthquake, 0.00076, 0.00279, 0.00195, 0.00149 for zone- IV earthquake and 0.00114, 0.00418, 0.00292, 0.00223 for zone – V earthquake respectively along X-direction.
Figure. 7. Storey drift ratios considering infill walls along X-direction for zone – V Earthquake
Storey drift ratios for MIS-1 are maximum compared to all other models. Storey drift ratios of MIS-3 are nearer to that of MIF model. As the soil stiffness decreases, the storey drift ratios are increasing. The storey drift ratios for MIF, MIS-1, MIS-2 and MIS-3 are found to be within the permissible limits. The storey drift ratio curve of MIF is idealized curve, whereas MIS-1, MIS-2, MIS-3 storey drift ratio curves represents realistic curve.
B. Storey Lateral Displacement
The storey displacement are investigated for the studied building of 10-storey using equivalent static earthquake load based on Indian Code provisions for seismic design. The storey displacement over the building height for different soil conditions ranging from silty sand, dense sand to dense gravel along with the response of the SSI model to that of fixed-base model are introduced in Figure 8 to Figure 13 and Table V to Table VI.
0 3.2 6.4 9.6 12.8 16 19.2 22.4 25.6 28.8 32
ST
O
R
EY
H
EIG
H
T,
M
STOREY DRIFT RATIO
International Journal of Emerging Technology and Advanced Engineering
Website: www.ijetae.com (ISSN 2250-2459, ISO 9001:2008 Certified Journal, Volume 6, Issue 3, March 2016)
75
TABLE VSTORY LATERAL DISPLACEMENT ALONG X-DIRECTION
TABLEVI
STORY LATERAL DISPLACEMENT CONSIDERING INFILL WALL ALONG X-DIRECTION
Earthquake Loading
Zone – III Displacements, mm Zone – IV Displacements, mm Zone – V Displacements, mm
Height,m MIF MIS-1 MIS-2 MIS-3 MIF MIS-1 MIS-2 MIS-3 MIF MIS-1 MIS-2 MIS-3
32 13.4 34.4 23.0 17.0 20.1 51.7 34.5 25.6 30.1 77.5 51.7 38.3
28.8 12.6 32.0 21.6 16.0 18.8 48.1 32.4 24.1 28.2 72.1 48.5 36.1
25.6 11.5 29.4 19.9 14.8 17.2 44.0 29.8 22.3 25.8 66.1 44.8 33.4
22.4 10.1 26.4 18.0 13.4 15.2 39.7 27.0 20.1 22.8 59.5 40.4 30.2
19.2 8.7 23.3 15.9 11.9 13.0 35.0 23.8 17.8 19.5 52.4 35.7 26.7
16 7.1 20.1 13.6 10.2 10.6 30.1 20.5 15.3 15.9 45.1 30.7 22.9
12.8 5.5 16.7 11.4 8.5 8.2 25.1 17.0 12.7 12.3 37.6 25.5 19.1
9.6 3.9 13.3 9.0 6.7 5.8 20.0 13.5 10.1 8.7 29.9 20.3 15.2
6.4 2.3 9.9 6.7 5.0 3.5 14.8 10.1 7.5 5.2 22.2 15.1 11.3
3.2 0.9 6.3 4.2 3.2 1.4 9.4 6.3 4.8 2.0 14.1 9.5 7.2
0 0.0 1.7 0.4 0.1 0.0 2.5 0.6 0.2 0.0 3.7 0.9 0.3
Earthquake Loading
Zone – IIIDisplacements, mm Zone – IV Displacements, mm Zone – V Displacements, mm
Height,m MF MS-1 MS-2 MS-3 MF MS-1 MS-2 MS-3 MF MS-1 MS-2 MS-3
32 55.4 143.1 95.5 81.2 83.1 214.6 121.8 81.2 124.7 321.9 214.8 182.7
28.8 52.2 133.4 89.8 76.7 78.3 200.0 115.1 76.7 117.4 300.0 202.1 172.6
25.6 47.8 122.4 83.0 71.1 71.7 183.6 106.7 71.1 107.6 275.4 186.8 160.1
22.4 42.4 110.3 75.1 64.5 63.6 165.4 96.7 64.5 95.5 248.2 169.0 145.1
19.2 36.3 97.4 66.4 57.1 54.4 146.0 85.6 57.1 81.7 219.0 149.5 128.4
16 29.7 83.8 57.2 49.1 44.6 125.7 73.6 49.1 66.9 188.6 128.6 110.5
12.8 22.9 69.8 47.6 40.9 34.4 104.8 61.3 40.9 51.6 157.2 107.1 92.0
9.6 16.2 55.7 37.9 32.6 24.3 83.5 48.8 32.6 36.4 125.3 85.2 73.3
6.4 9.7 41.3 28.1 24.3 14.6 62.0 36.4 24.3 21.8 93.0 63.3 54.6
3.2 3.8 26.2 17.7 15.4 5.7 39.3 23.1 15.4 8.5 59.0 39.8 34.6
International Journal of Emerging Technology and Advanced Engineering
Website: www.ijetae.com (ISSN 2250-2459, ISO 9001:2008 Certified Journal, Volume 6, Issue 3, March 2016)
[image:8.612.51.288.123.348.2]76
Figure. 8. Storey lateral displacement along X-direction for zone – IIIEarthquake
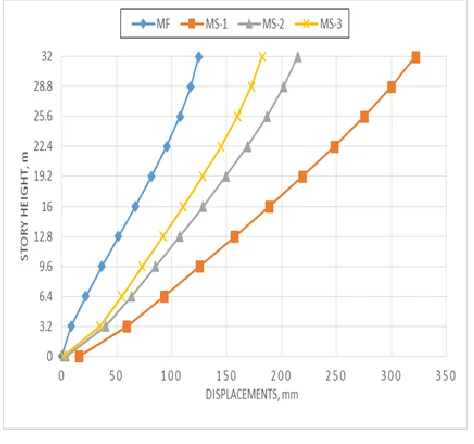
Figure. 9. Storey lateral displacement along X-direction for zone – IV Earthquake
[image:8.612.327.564.237.459.2]Figure 8 to Figure 10 show that the storey lateral displacements increases nonlinearly along the height of the building. The maximum displacement values in MF, MS-1, MS-2 and MS-3 are 55.4, 143.1, 95.5 and 81.2 mm for zone – III earthquake, 83.1, 214.6, 143.2, 81.2 mm for zone- IV earthquake and 124.7, 321.9, 214.8 and 182.7 mm for zone – V earthquake respectively along X-direction.
Figure. 10. Storey lateral displacement along X-direction for zone – V Earthquake
[image:8.612.51.289.381.605.2]International Journal of Emerging Technology and Advanced Engineering
Website: www.ijetae.com (ISSN 2250-2459, ISO 9001:2008 Certified Journal, Volume 6, Issue 3, March 2016)
[image:9.612.325.562.121.342.2]77
Figure. 11. Storey lateral displacement considering infill wall alongX-direction for zone – III Earthquake
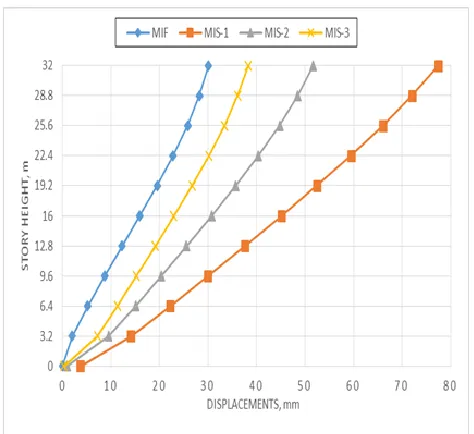
[image:9.612.52.286.121.340.2]Figure. 12. Storey lateral displacement considering infill wall along X-direction for zone – IV Earthquake
Figure. 13. Storey lateral displacement considering infill wall along X-direction for zone – V Earthquake
Figure 11 to Figure 13 show that the storey lateral displacements increases nonlinearly along the height of the building. The maximum displacement values in MIF, MIS-1, MIS-2 and MIS-3 are 13.4, 34.4, 23.0 and 17.0 mm for zone – III earthquake, 20.1, 51.7, 34.5 and 25.6 mm for zone- IV earthquake and 30.1, 77.5, 51.7 and 38.3 mm for zone – V earthquake respectively along X-direction.
Storey displacements for MIS-1 are maximum compared to all other models. Storey displacements of MIS-3 are nearer to that of MIF model. As the soil stiffness decreases, the storey displacements are increasing. Storey displacement of MIS-1 is 2.57 times the displacement of MIF model for all the three earthquake zones. Storey displacement of MIS-2 is 1.72 times the displacement of MIF model for all the three earthquake zones. Storey displacement of MIS-3 is 1.27 times the displacement of MIF model for all the three earthquake zones.
V. CONCLUSIONS
[image:9.612.49.286.376.593.2]International Journal of Emerging Technology and Advanced Engineering
Website: www.ijetae.com (ISSN 2250-2459, ISO 9001:2008 Certified Journal, Volume 6, Issue 3, March 2016)
78
The maximum storey drift ratio for fixed base model isat 5th storey along X-direction.
Storey drift ratio for MS-1 and MIS-1 is maximum, i.e., silty sand having less stiffness has pronounced effect on the seismic response.
Storey drift ratio for MS-3 and MIS-3 are nearer to that of fixed base models, i.e., dense gravel having high stiffness has almost the same effect of fixed base model.
As the soil stiffness is increasing, the storey drift ratios are decreasing
Except in a models MS-1, MS-2 and MS-3 the storey drift ratio is within the permissible limits according to IS 1893:2002.
As the soil stiffness is increasing, the storey lateral displacements are decreasing.
Storey lateral displacements of MS-1 is 2.58 times the displacement of MF along X direction respectively.
Storey lateral displacements of MS-2 is 1.72 times the displacement of MF along X direction respectively.
Storey lateral displacements of MS-3 is 1.47 times the displacement of MF along X direction respectively.
Storey lateral displacements of MIS-1 is 2.57 times the displacement of MIF along X direction respectively.
Storey lateral displacements of MIS-2 is 1.72 times the displacement of MIF along X direction respectively.
Storey lateral displacements of MIS-3 is 1.27 times the displacement of MIF along X direction respectively. REFERENCES
[1] Bowles, J.E., 1988 Foundation Analysis and Design, 5th Edition, McGraw Hill.
[2] Esteban, S., Fernando, L.C., Razavi, A.M.F., 2013, Inelastic dynamic soil-structure interaction effects on moment-resisting frame buildings, Vol. 51, pp. 166-177.
[3] FEMA, 2000, Prestandard and Commentary for the Seismic Rehabilitation of Buildings, FEMA 356.
[4] French, J., Mack, D., Shafer, R., Moore, K., 2006, Clarifying the Application of Subgrade Modulus in Structural analysis and design, 8th U.S. National Conference on Earthquake Engineering, Paper No. 1072.
[5] Gazetas, G., 1991, Formulas and Charts for Impedances of Surface and Embedded Foundations, Journal of Geotechnical Engineering, Vol. 117, No.9, Paper No. 26172.
[6] Givens, M.J., Stewart, J.P., Haselton, C.B., Mazzoni, S., 2012, Assessment of Soil-Structure Interaction Modeling Strategies for Response History Analysis of Buildings, 15th World Conference on Earthquake Engineering.
[7] IS 1893 (Part 1):2002, Indian Standard criteria for Earthquake Resistant Design of Structures, Bureau of Indian Standards. [8] IS 875 (Part 1, and 2):1987, Indian Standard Code Of Practice for
Design Loads (Other Than Earthquake) For Buildings And Structures, Bureau of Indian Standards.
[9] IS 456:2000, Indian Standard plain and reinforced concrete - Code of practice, Bureau of Indian Standards.
[10] Kim, S., Stewart, J.P., 2003, Kinematic Soil-Structure Interaction from Strong Motion Recordings, Journal of geotechnical and Geo environmental Engineering, ASCE, Vol.129, No.4, pp. 323-335. [11] Mylonakis, S., Nikolaou, S., Gazetas, G., 2006, Footings under
seismic loading: Analysis and design issues with emphasis on bridge foundations, Soil Dynamics and Earthquake Engineering, Vol.26,pp. 824-853.
[12] Raheem, S.E.A., Ahmed, M.M., Alazrak. T.M.A., 2015, Evaluation of soil-foundation-structure interaction effects on seismic response demands of multi-story MRF buildings on raft foundations, International Journal of Advanced Structural Engineering, Vol.7, No.1, pp. 11-30.
[13] Stewart, J.P., Fenves, G.L., and Seed, R.B., 1999b, Seismic soil-structure interaction in buildings II: Empirical findings, Journal Geotechnical and Geo environmental Engineering, Vol. 125, pp. 38-48.