International Journal of Emerging Technology and Advanced Engineering
Website: www.ijetae.com (ISSN 2250-2459, ISO 9001:2008 Certified Journal, Volume 7, Issue 7, July 2017)
307
Performance Analysis of Independent Component Analysis
based on Blind Source Separation for extraction of Atrial
Activity
Tushar H Jaware
Asst. Prof, E&TC Dept, R C Patel Institute of Technology Shirpur
Abstract— A cardiovascular (CVD) disease is common reason for the death in all over the world. Electrocardiogram (ECG) is easily available from human body for the exact diagnosis of cardiac. ECG signal is normally corrupted with noise which provides incorrect diagnosis. ICA is validated based on Atrial Activity (AA) and Ventricular activity (VA) generated by independent sources, AA and VA presents non-Gaussian distributions and ECG signals from CVD are considered as a narrow-band linear propagation process.
Keywords— Atrial Activity, Blind Source Separation, Independent Component Analysis, QRS detection, DBE.
I. INTRODUCTION
The diseases specially related to cardiac are a major issue of the death in all over the world. The main reason in irregular heartbeat is due to cardiac dysrhythmia or arrhythmia. Cardiac dysrhythmia shows a condition of electrical activity of heart is irregular due to faster or slower heart rate than normal. If the heart beat rate is faster than normal rate is referred as tachycardia. If the heart beat rate is slower than normal rate is referred as bradycardia. Arrhythmia occurs at any age of life, it can lead to death. Arrhythmia is caused due to less awareness of heartbeat called as palpitations. Arrhythmias cause distracting for patients; some arrhythmias do not cause symptoms as they are not associated to increased mortality [1]. Asymptomatic arrhythmias are associated with adverse events. To obtain the heartbeats normally an electrocardiogram technique is considered, this gives the bio-potentials generated from muscle heart rate. The performance of ECG signals analysis the PQRST complex wave of heart activity. The performance analysis of ECG signal depends upon efficient and accurate detection of QRS wave, and also T and P Waves. The noise if present in ECG signal is normally due to the electrode contacts, motion artifacts, power line interference, electromagnetic interference and noise from electronic devices.
II. INDEPENDENT COMPONENT ANALYSIS
Independent Component analysis (ICA) is a processing process which performs blind source separation of independent statistical sources components by assuming linear mixing of sources with sensors; this generally uses higher order statistics. ICA in this context we, thus, have a means of identifying a non-orthogonal basis (and the basis coefficients) which spans the measurement space, based on the implicit statistical assumptions underlying the ICA decomposition. In this paper [4-7] a different implementation of ICA is considered. The basic overview of ICA algorithms is given in [4] [5] which gives the information to also use Fast ICA algorithm, due to ease of implementation and speed of operation. The other methods are also proposed in literature, among this Fast ICA provides speed to separate components from a mixed measurement of channels based on non-Gaussianity fast ICA provides a very fast iterative algorithm to find projections and non-Gaussianity components by kurtosis or negative entropy.
Independent component analysis (ICA) was used for the processing of the filtered ECG recordings. ICA is a signal processing technique that models a set of input data in terms of statistically independent variables it is able to separate independent components produced by distinct sources from linearly mixed signals.
mi i i
s
a
AS
X
1 ^ ^
.
International Journal of Emerging Technology and Advanced Engineering
Website: www.ijetae.com (ISSN 2250-2459, ISO 9001:2008 Certified Journal, Volume 7, Issue 7, July 2017)
308
The amplitude rate of increasing cardiac action potential decreases from cell to cell because of decremental properties of AV node. Due to this property the impulses traverse through AV node before blocking [2]. In clinical investigations the phenomenon property of concealed conduction, in which atrial does not conduct to ventricles may impair the conduction of impulses, blocking the propagation of other impulses. An atrial wave fronts are not able to produce or do not reach ventricular depolarization due to the consequences of properties of AV node. In other the physical origin of atrial wave fronts which has been able to produce ventricular depolarization is very variable. During an AF episode AA node VA node are reasonably responsible for both activities of physical independent and statistically independent sources of cardio electric activity. In this paper the characteristics and validity of atria ventricular statistical independence is presented [1] [2] [3].A continuous electrophysiological signal from cardiac muscle constitutes electrocardiogram (ECG) for monitoring of heart rate. ECG signal is several times used for analysis of patient for various diagnostics requirement. QRS complex is most significant requirement from PQRST complex of ECG. This QRS complex waveform gives the best analysis of the human heart rate. Various performance measures such as accuracy, sensitivity and all other relies on this QRS detection [10] [11]. QRS complex is a continuous varying signal which gets affected from noise signal due to electrodes, motion artifacts and EMG. QRS signal detection algorithm is must for realization of accurate ECG diagnosis.
Digital signal processing (DSP) and VLSI are most reliable for implementation of mixed signal filters. Mixed signal filters basically consist of sample and hold circuit and analog to digital converters proceed by DSP and VLSI processors [12]-[16]. Mixed signal filter implementation is an efficient method that can provide low power efficient circuits at a wide range of frequency. A nonlinear analog circuit can serve as channel decoders with low power consumption at higher speed for digital decoders. Analog decoders with analog inputs and outputs are compatible for digital receivers.
To perform the decision-making for detecting QRS complexes an adaptive thresholding scheme is applied to the feature waveform generated from the non-linear LPF stage. A QRS complex is said to be detected, only if the peak level of the feature signal exceeds the threshold. The value of the threshold is then updated each time when a new QRS complex is detected [17].
III. BLIND SOURCE SEPARATION
The BSS is termed as blind source separation, the term blind considers that nothing is known about the source signals or linear mixture sources only the hypothesis is being the source mutual independence. If the signal obtained from AA node from the 12 lead ECG is to be analyzed using blind source separation (BSS) methods based on independent component analysis (ICA) the three basic considerations arise on body surface is to be justified. These three basic considerations are independence of sources, non-Gaussianity and signal generated from linear mixing of bioelectric sources [8]. This paper gives an outline of mathematical modeling principles behind BSS of linear mixtures.
AF generation gives a strong support to independence and non-Gaussianity of AA and VA. The analysis of linear mixing model for the ECG is obtained from the matrix solution for the forward problem of electrocardiography. The correlation to these conditions makes possible to suitable assume the ECG of patient AF satisfied with BSS instantaneous linear mixture model. This justifies that it is application of independent component analysis. The BSS is considered to recover the set of source signals from the linear observation of mixture sources [9].
The process flow of our proposed method is as follows:
Input the noisy ECG Signal.
Separation of ECG signal using ICA.
IV. IMPLEMENTATION &RESULTS
In this paper the ICA is used for the separation of the Noise Signal and ECG Signal. The noise signal can be due to motion artifacts or other signal from body tries to override on it. ICA is validated based on Atrial Activity (AA) and Ventricular activity (VA) generated by independent sources, AA and VA presents non-Gaussian distributions and ECG potentials from the cardio-electric sources can be considered as a narrow-band linear propagation process.
International Journal of Emerging Technology and Advanced Engineering
Website: www.ijetae.com (ISSN 2250-2459, ISO 9001:2008 Certified Journal, Volume 7, Issue 7, July 2017)
[image:3.612.63.292.144.342.2]309
[image:3.612.333.554.146.358.2]Fig. 1 Normal ECG Signal
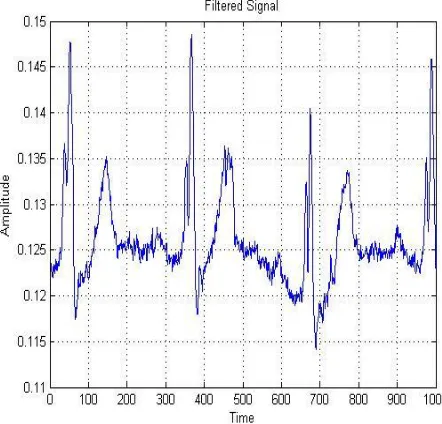
[image:3.612.56.292.430.626.2]Figure 1 shows the normal ECG signal. The ECG signals captured by utilizing electrodes are always have small frequency which offer a chance to composite other artifactual signals of smaller frequency and often large amplitude signals with the ECG signals. It is shown in figure 2.
Fig. 2 ECG Signal along with Noise Signal
Fig. 3 Accurate ECG signal Response using ICA
The electric and magnetic signals created by the fetal heart are constantly installed in a background noise originating from electronic interference and from an immense number of electronic and organic sources which conceal a noteworthy part of the cardiovascular wave complex. For the above reason, the extraction of the fetal heart signal from the background noise and its complete partition from the mother's signal is required. This brings the need for ICA in our proposed method. Figure 3 shows the accurate separation of ECG signal using ICA.
[image:3.612.336.552.502.661.2]International Journal of Emerging Technology and Advanced Engineering
Website: www.ijetae.com (ISSN 2250-2459, ISO 9001:2008 Certified Journal, Volume 7, Issue 7, July 2017)
310
A. Performance Measures
To Evaluate the Performance of the proposed algorithm, several terms are considered as FP (False Positive) which means false hear beat detection and FN (False Negative) which means failed to detect true heart beat rate.
1. Accuracy
Accuracy is used as a statistical measure of how a classifier and filtering techniques identifies the condition. The accuracy is the proportion of true results both true positives and true negatives among the total number of cases examined.
100%
TP TN Accuracy
TP FN TN FP
2. Specificity
Specificity is related to the ECG signal condition is normal (no disease). High Specificity shows that the Monitoring System obtains the Normal Condition as Normal.
100%
TN Specificity
TN FP
3. Sensitivity
Sensitivity is related to the ECG signal condition is abnormal (disease). High Sensitivity shows that the Monitoring System obtains the Abnormal Condition as Abnormal.
100%
TP Sensitivity
TP FN
4. False Positive Rate
The false positive rate is the proportion of the conditional probability of a positive test result given an absent event.
5. Positive Predictive Value
The Positive predictive values PPV are the proportions of positive results in statistics and diagnostic tests that are true positive results.
6. Negative Predictive Value
The Negative predictive values NPV are the proportions of negative results in statistics and diagnostic tests that are true negative results.
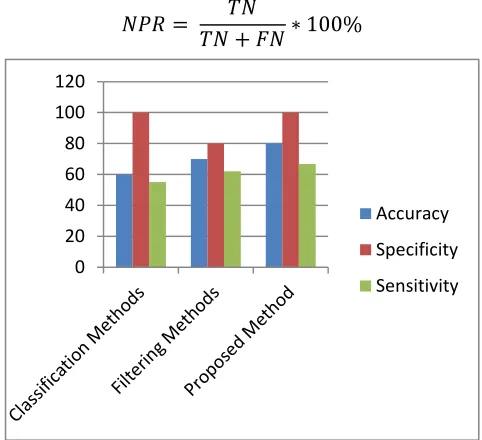
[image:4.612.323.564.196.416.2]
Fig. 5 Graphical Representation Comparison of different methods
The Graph shows the statistical analysis of filtering methods, classification methods and proposed method. The performance parameters such as accuracy, specificity and sensitivity are considered and compared.
Fig. 6 Graphical Representation of performance Comparison
0 20 40 60 80 100 120
Accuracy Specificity Sensitivity
0 0.2 0.4 0.6 0.8 1 1.2
FPR
PPV
[image:4.612.326.568.488.644.2]International Journal of Emerging Technology and Advanced Engineering
Website: www.ijetae.com (ISSN 2250-2459, ISO 9001:2008 Certified Journal, Volume 7, Issue 7, July 2017)
311
The Graph shows the statistical analysis of filtering methods, classification methods and proposed method. The performance measures such as False Positive Rate, Positive Predictive Value and Negative Predictive Value are compared.V. CONCLUSION
This paper focuses on AA recorded from the surface ECG signal analysis can be effectively carried out based on BSS technique for instantaneous linearly mixed signals. This technique in biomedical problem is considered in connection with three main assumptions. Initially during atrial arrhythmia activity complex, AA and VA is considered as statistically independent sources obtained from cardio-electric sources. Secondly, this both the signal obtained presence a non-Gaussian character. Finally, these both nodes are linear mixture of cardiac sources, in this unknown mixture coefficients depends upon ECG electrodes position conductivity with body tissues. This makes a main reason for considering the BSS along with ICA for analysis of exact and accurate detection of the ECG signal. Traditional techniques to obtain and process AA signal are presented in many algorithms, in contrast the BSS based method estimates a single signal which is able to reconstruct AA present in every ECG signal completely. In other BSS approach provides a best alternative procedure for QRST cancellation in atrial arrhythmia analysis.
REFERENCES
[1] V. Fuster, et al,―ACC/AHA/ESC guide-lines for the management of patients with atrial fibrillation: a report of the American College of Cardiology/American Heart Association Task Force on Practice Guidelines and the European Society of Cardiology Committee for Practice Guidelines and Policy Conferences (Committee to Develop Guidelines for the Management of Patients With Atrial Fibrillation),‖J. Amer. Coll. Cardio., vol. 38, pp. 1266 i–1266 lxx, 2001.
[2] S. Levyet al., ―Atrial fibrillation: Current knowledge and recommendations for management, ‖Eur. Heart J., vol. 19, no. 9, pp. 1294–1320, 1998.
[3] M. Stridh and L. Sörnmo, ―Spatiotemporal QRST cancellation techniques for analysis of atrial fibrillation, ‖IEEE Trans. Biomed. Eng., vol. 48, pp. 105–111, Jan. 2001.
[4] Hyvärinen and E. Oja, ―A fast fixed-point algorithm for independent component analysis,‖ Neural Computation,vol.9, pp. 483–492, 1997. [5] P. Comon, ―Independent component analysis, a new concept,‖
Signal Process., vol. 36, pp. 287–314, 1994.
[6] J. Bell and T. J. Sejnowski, ―An information-maximization approach to blind separation and blind deconvolution,‖Neural Computation, vol. 7, pp. 129–1159, 1995.
[7] S. Makeig, T. P. Jung, A. J. Bell, D. Ghahremani, and T. J. Sejnowski, ―Blind separation of auditory event-related brain responses into independent components, ‖Proc. Nat. Acad. Sci., vol. 94, pp. 10 979–10 984, 1997.
[8] V. Zarzoso and A. K. Nandi,―Blind source separation,‖ in Blind Estimation Using Higher-Order Statistics, A. K. Nandi, Ed. Boston, MA: Kluwer, 1999, pp. 167–252.
[9] J. F. Cardoso, ―Blind signal separation: Statistical principles,‖ Proc. IEEE, vol. 86, pp. 2009–2025, Oct. 1998.
[10] B.-U. Kohler, C. Hennig, R. Orglmeister, The principles of software QRS detection, IEEE Eng. Med. Biol. Mag. (2002) 42–57.
[11] H.-L. Chan, W.-S. Chou, S.-W. Chen, S.-C. Fang, C.-S. Liou, Y.-S. Hwang, Continuous and online analysis of heart rate variability, J. Med. Eng. Technol. (2005) 227–234.
[12] M. Zahabi, V. Meghdadi, J. Cances and A. Saemi, "Mixed-signal matched filter for high-rate communication systems", IET Signal Processing, vol. 2, no. 4, p. 354, 2008.
[13] L. Milor,"A tutorial introduction to research on analog and mixed-signal circuit testing", IEEE Transactions on Circuits and Systems II: Analog and Digital Signal Processing, vol.45, no.10, pp.1389-1407, 1998.
[14] D. Campbell, E. Jones and M. Glavin, "Audio quality assessment techniques—A review, and recent developments", Signal Processing, vol. 89, no. 8, pp. 1489-1500, 2009.
[15] M. Gudmundson, "Correlation model for shadow fading in mobile radio systems", Electron. Lett., vol. 27, no. 23, p. 2145, 1991. [16] N. Murata, S. Ikeda and A. Ziehe, "An approach to blind source
separation based on temporal structure of speech signals", Neurocomputing, vol. 41, no. 1-4, pp. 1-24, 2001.