Development and Validation of a Diagnostic DNA Microarray To
Detect Quinolone-Resistant
Escherichia coli
among
Clinical Isolates
Xiaolei Yu,
1Milorad Susa,
2Cornelius Knabbe,
2Rolf D. Schmid,
1and Till T. Bachmann
1*
Institute of Technical Biochemistry, University of Stuttgart,1and Department of Clinical Chemistry and
Laboratory Medicine, Robert Bosch Hospital,2Stuttgart, Germany
Received 21 January 2004/Returned for modification 17 March 2004/Accepted 27 May 2004
The incidence of resistance against fluoroquinolones among pathogenic bacteria has been increasing in accordance with the worldwide use of this drug.Escherichia coliis one of the most relevant species for quinolone resistance. In this study, a diagnostic microarray for single-base-mutation detection was developed, which can readily identify the most prevalent E. coli genotypes leading to quinolone resistance. Based on genomic sequence analysis using public databases and our own DNA sequencing results, two amino acid positions (83 and 87) on the A subunit of the DNA gyrase, encoded by thegyrAgene, have been identified as mutation hot spots and were selected for DNA microarray detection. Oligonucleotide probes directed against these two positions were designed so that they could cover the most important resistance-causing and silent mutations. The performance of the array was validated with 30 clinical isolates ofE. colifrom four different hospitals in Germany. The microarray results were confirmed by standard DNA sequencing and were in full agreement with phenotypic antimicrobial susceptibility testing.
Quinolones are among the most potent antibacterial agents used in human therapy. Fluoroquinolones have been widely applied as broad-spectrum antimicrobial agents in clinical medicine since 1983. With the worldwide use of this drug, the corresponding resistance among bacteria has increased signif-icantly. One of the most relevant species isEscherichia coli, in particular for urinary tract infections, where E. coli is the infection-causing pathogen in 80% of cases. In clinical routine, 90% of these kinds of infections are treated with quinolone antibiotics. However, 7 to 9% of the pathogenicE. coliisolates are quinolone resistant and cause clinical complications (M. Susa, unpublished data). In addition, quinolone-resistant E. coli could be a potential threat to neutropenic patients with leukemia who receive a quinolone as prophylaxis (36). The molecular background of quinolone resistance is missense mu-tations (single-nucleotide exchanges) in the target enzyme genes and, less importantly, the reduction of quinolone accu-mulation inside the cells (2, 10, 16, 22, 27). In gram-negative organisms, such asE. coli, the primary target of fluoroquino-lones is the DNA gyrase (3, 11). Missense mutations in the A subunit of the DNA gyrase are commonly considered to be the main reason for quinolone resistance inE. coli (8, 9, 28, 30). Such single-nucleotide exchanges are clustered in a small re-gion called the quinolone resistance-determining rere-gion (QRDR) (5, 27, 37). Up to now, the standard methods to determine antibiotic resistance, e.g., disk diffusion tests or E-tests, have been based on phenotypic identification; these methods are time-consuming, are culture-based, and have
room for improvement in terms of sensitivity and precision. A rapid and precise genotype-based diagnostic resistance test would be of great value for the clinic. Although several mo-lecular genetic methods, such as single-stranded conforma-tional polymorphism (SSCP) analysis (25), mismatch amplifi-cation mutation assay (MAMA) (29), and restriction fragment length polymorphism (RFLP) analysis (12), have been used to investigate QRDRs of gyrA, all of them have limitations in different aspects and are not yet established in clinical routine diagnostics of microbial antibiotics resistance. As an example, SSCP can detect only the region of the missense mutation and not the exact position of the missense mutation, MAMA can either detect one genotype or requires the use of multiplex PCR, and RFLP can detect missense mutations inside the recognition sequence of the restriction enzyme but not the exact position and the substitution. In contrast, DNA microar-ray technology provides a promising alternative for high-throughput genotype-based diagnostics. The potential of min-iaturization and multiplexing offers a considerable advantage over other molecular genetic methods for clinical application, which could be demonstrated, for example, in the case of DNA microarray-based assays developed for the detection of ri-fampin-resistantMycobacterium (20, 21, 33). Although a sys-tem for the detection of ciprofloxacin-resistantNeisseria
gon-orrhoeaewas also developed recently (4), there is no such assay
for the detection of quinolone-resistantE. coli, which is one of the most relevant species.
In this study, we developed a microarray-based genotyping method to detect quinolone resistance in a short time and to cover different E. coligenotypes. Based on allele frequency analysis using public databases and in-house DNA sequencing of clinicalE. coliisolates, two amino acid positions (83 and 87) in the gyrase A subunit were identified as hot spots for the
* Corresponding author. Mailing address: Institute of Technical Biochemistry, University of Stuttgart, Allmandring 31, D-70569 Stutt-gart, Germany. Phone: (49)-711-685-3197. Fax: (49)-711-685-3196. E-mail: [email protected].
4083
on May 15, 2020 by guest
http://jcm.asm.org/
detection of quinolone resistance. Although there are several platforms available for array-based single-nucleotide polymor-phism, e.g., allele-specific hybridization (34), single-base primer extension (26), allele-specific amplification (1), or al-lele-specific oligonucleotide ligation (13), we chose allele-spe-cific hybridization because its robust performance should be suitable for routine clinical application. In contrast to the above-mentioned genotyping methods, the use of allele-spe-cific hybridization allowed not only the identification of the mutated amino acid but also the exact substitution, which could have different contributions to resistance and can be used as a marker in epidemiological studies.
MATERIALS AND METHODS
Strains.In total, 30E. coliclinical isolates from four different hospitals in Germany (Backnang, Stuttgart, Schorndorf, and Winnenden) (referred to here asE. coli1 to 30) were used for this study. These strains were isolated from urine (n⫽20), swabs (n⫽7), secretions (n⫽2), and blood (n⫽1) of patients. The susceptibility against quinolone was determined according to NCCLS guidelines by using either ciprofloxacin alone (n⫽23) or both ciprofloxacin and levofloxa-cin (n⫽7). The genomic DNA was isolated from a bacterial pure culture by using a QIAamp DNA minikit (Qiagen, Hilden Germany) according to the manufacturer’s protocol.
DNA sequencing.For the DNA sequencing, a 418-bp fragment of E. coli, which included the QRDRs, was amplified by PCR with primers described previously (35). The 50-l PCR mixture included approximately 80 ng of tem-plate (genomic DNA ofE. coli), a 0.4 pM concentration of each primer, 0.25 mM deoxynucleoside triphosphates, 1.5 mM Mg2⫹, and 2.5 U ofTaqpolymerase
(Eppendorf, Hamburg, Germany). The PCRs were performed in a thermocycler (Mastercycler gradient) (Eppendorf) with the following parameters: 94°C for 5 min; 30 cycles at 94°C for 1 min, 52°C for 1 min, and 72°C for 1 min; and a final elongation at 72°C for 10 min. The amplified fragment, which was purified with a QIAquick PCR purification kit (Qiagen) according to the manual provided by the manufacturer, was used for direct sequencing. The sequencing was done with the same primer pairs, a Big-Dye terminator cycle sequencing kit (Applied Biosystems, Darmstadt, Germany), and a Prism 377 DNA sequencer (Applied
Biosystems). For each isolate, two PCR products from separate reactions were sequenced, using both the forward and reverse primers.
Amplification and labeling.The labeling PCRs were performed with forward primer 5⬘-ACGTACTAGGCAATGACTGG-3⬘and reverse primer 5⬘-AGAGT CGCCGTCGATGGAAC-3⬘. The 50-l PCR mixture included approximately 80 ng of template (genomic DNA ofE. coli), a 0.4 pM concentration of each primer, 0.1 mM deoxynucleoside triphosphates (the ratio between dCTP and Cy5-dCTP was 3:2), 1.5 mM Mg2⫹, and 2.5 U ofTaqpolymerase (Eppendorf). The same
parameters as described above were used for the labeling PCRs. The amplified 189-bp fragment, which was purified by using a QIAquick PCR purification kit, was used for hybridization.
Array fabrication.Using a Microgrid II microarrayer (Biorobotics, Cam-bridge, United Kingdom), the oligonucleotide capture probes (Invitrogen, Karlsruhe, Germany), which were dissolved in 50% dimethyl sulfoxide at a concentration of 20M, were spotted on poly-L-lysine slides (Sigma, Deisen-hofen, Germany) in two subarrays. On each slide a spotting control (Cy5-labeled oligonucleotide 5⬘-Cy5-CTAGACAGCCACTCATA-3⬘), a hybridization control (5⬘-GATTGGACGAGTCAGGAGC-3⬘) complementary to a labeled oligonu-cleotide target, a negative control (5⬘-CTAGACAGCCACTCATA-3⬘), and a process control (an oligonucleotide with the consensus sequence forgyrA, 5⬘-T AATCGGTAAATACCATCC-3⬘) were also included. The sequences of the first three controls were unrelated to the bacterium. After spotting, the slides were irradiated with UV light at 120 mJ/m2by using a UV cross-linker (Biometra, Go¨ttingen, Germany), blocked with a blocking solution (0.18 M succinic anhy-dride in methylpyrrolidinone–44 mM sodium borate [pH 8.0]) for 10 min, rinsed with distilled water and 98% ethanol, and finally air dried for 10 min.
Hybridization, washing, and scanning.The purified amplicon in 40l of hybridization solution (6⫻SSPE [1⫻SSPE is 0.18 M NaCl, 10 mM NaH2PO4, and 1mM EDTA {7.7}] and 0.1 pmol of Cy5-labeled DNA complementary to the hybridization control) was incubated on poly-L-lysine slides at 45°C for 3 h in hybridization chambers (Corning) in a hybridization oven (OV5; Biometra, Go¨t-tingen, Germany). For hybridization, 4 pmol target of DNA was used. After hybridization, the slides were washed with 2⫻SSC (1⫻SSC is 0.15 M NaCl plus 0.015 M sodium citrate)–0.1% sodium dodecyl sulfate for 15 min and with 0.2⫻ SSC for 3 min at room temperature and subsequently were dried with N2.
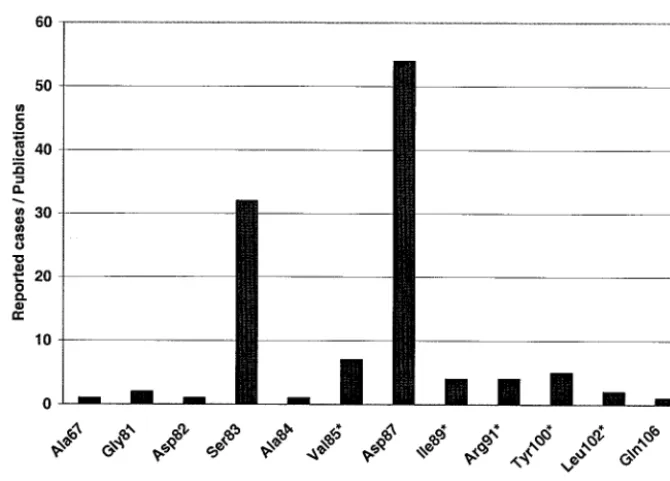
[image:2.603.126.461.68.308.2]Image acquisition and data processing.Data from hybridized oligonucleotide arrays were extracted by acquisition of fluorescence signals with a 418 array scanner (Affymetrix, Santa Clara, Calif.), using 100% laser power and 100% gain. The image processing and calculation of signal intensities were performed with FIG. 1. Frequency of reported cases of mutation in the literature according to amino acid position of the A subunit of theE. coligyrase (gyrA
product) (literature data analysis from January 1985 to June 2003 through PubMed of NCBI). Positions with silent mutations are indicated with an asterisk.
on May 15, 2020 by guest
http://jcm.asm.org/
ImaGene, version 3.0 (Biodiscovery Inc., Los Angeles, Calif.). For the calcula-tion of the individual net signal intensities, the local background was subtracted from the raw spot intensity value. The raw data were saved as plain-text files and processed by using Excel. The perfect match (PM) intensity (highest intensity among four probes for one single-nucleotide polymorphism) and the ratio be-tween PM and mismatch (MM) (intensity of PM/mean intensity of MM) were used for resistance detection. For further process automation, an analysis tool was developed (X. L. Yu, R. D. Schmid, and T. T. Bachmann, unpublished data).
RESULTS
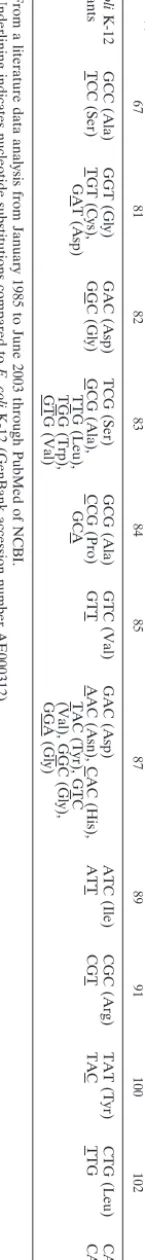
Allele frequency analysis.With a homology search in Gen-Bank (National Center for Biotechnology Information [NCBI]) 21 sequences ofE. coli gyrAwhich were longer than 120 bp and had an E-value (expected threshold, or the statis-tical significance threshold for reporting matches against data-base sequences according to the stochastic model of Karlin and Altschul [17]) smaller than 0.15 have been found. The se-quence analysis revealed one missense mutation at position 87 for one isolate (accession number Y00544 in GenBank) and two silent mutations at position 84 (accession numbers AE005455 and AP002560) and 85 (accession numbers AE005455, AP002560, and AF052254) for several isolates. In order to obtain additional information, 130 publications from 1985 to June 2003 were analyzed. Altogether, 12 positions (Fig. 1 and Table 1) which contained either missense mutations or silent mutations were found. To ensure a reliable probe design for clinicalE. colistrains, five clinical isolates were sequenced. The sequences were in good accordance with the literature data and were included in the probe design.
Capture probe design.All positions containing missense mu-tations or silent mumu-tations were evaluated based on the fre-quency of the corresponding publications and their contribu-tion to resistance. Amino acid posicontribu-tions 83 (second posicontribu-tion of the codon) and 87 (first and second positions of the codon) turned out to be the most important for quinolone resistance. Consequently, the capture probes were designed against these two positions. All probes were 19 bases long and had various base positions in their centers. The probe sequences are listed in Table 2. As the sequence data analysis revealed strain-associated silent mutations in close vicinity (amino acid posi-tions 85 and 89), two sets of specific probes (8 probes in total) for amino acid position 83 and eight sets of specific probes (32 probes in total) for amino acid position 87 were designed, with four sets directed against the first position of the codon and the other four sets directed against the second position of the triplet. In order to reduce the capture probe numbers in the future, the use of degenerate capture probes was investigated. Universal capture probes with inosine at the sites of these two strain-associated silent mutations at amino acid positions 85 and 89 were designed (one set for amino acid position 83 and two sets for amino acid position 87), which should match all genotypes.
Microarray testing of clinical isolates.The performance of each step in the microarray experiments was checked with four types of control probes. A spotting control which was 5⬘-Cy5 labeled indicated correct spotting and immobilization perfor-mance. The hybridization control together with a spiked, la-beled complementary oligonucleotide indicated a successful hybridization reaction. The absence of signals for these two controls would have indicated a spotting failure and a
distur-TABLE 1. Previously reported mutations in gyrA QRDRs among E. coli strains a Strain(s) Codon(s) (amino acid[s]) at amino acid position b : 67 81 82 83 84 85 87 89 91 100 102 106 coli K-12 GCC (Ala) GGT (Gly) GAC (Asp) TCG (Ser) GCG (Ala) GTC (Val) GAC (Asp) ATC (Ile) CGC (Arg) TAT (Tyr) CTG (Leu) CAG (Gln) TCC (Ser) TGT (Cys), GAT (Asp) GGC (Gly) GCG (Ala), TTG (Leu), TGG (Trp), GTG (Val) CCG (Pro) GCA GTT AAC (Asn), CAC (His), TAC (Tyr), GTC (Val), GGC (Gly), GGA (Gly) ATT CGT TAC TTG CAT (His) a From a literature data analysis from January 1985 to June 2003 through PubMed of NCBI. b Underlining indicates nucleotide substitutions compared to E. coli K-12 (GenBank accession number AE000312).
on May 15, 2020 by guest
http://jcm.asm.org/
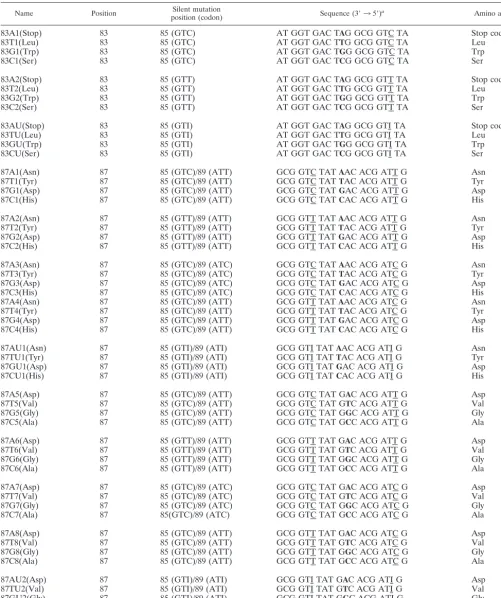
[image:3.603.384.457.87.718.2]TABLE 2. Capture probes directed against amino acid positions 83 and 87 ofE. coliGyrA, with consideration of silent mutations at amino acid positions 85 and 89
Name Position position (codon)Silent mutation Sequence (3⬘35⬘)a Amino acid
83A1(Stop) 83 85 (GTC) AT GGT GAC TAG GCG GTC TA Stop codon
83T1(Leu) 83 85 (GTC) AT GGT GAC TTG GCG GTC TA Leu
83G1(Trp) 83 85 (GTC) AT GGT GAC TGG GCG GTC TA Trp
83C1(Ser) 83 85 (GTC) AT GGT GAC TCG GCG GTC TA Ser
83A2(Stop) 83 85 (GTT) AT GGT GAC TAG GCG GTT TA Stop codon
83T2(Leu) 83 85 (GTT) AT GGT GAC TTG GCG GTT TA Leu
83G2(Trp) 83 85 (GTT) AT GGT GAC TGG GCG GTT TA Trp
83C2(Ser) 83 85 (GTT) AT GGT GAC TCG GCG GTT TA Ser
83AU(Stop) 83 85 (GTI) AT GGT GAC TAG GCG GTI TA Stop codon
83TU(Leu) 83 85 (GTI) AT GGT GAC TTG GCG GTI TA Leu
83GU(Trp) 83 85 (GTI) AT GGT GAC TGG GCG GTI TA Trp
83CU(Ser) 83 85 (GTI) AT GGT GAC TCG GCG GTI TA Ser
87A1(Asn) 87 85 (GTC)/89 (ATT) GCG GTC TATAAC ACG ATT G Asn
87T1(Tyr) 87 85 (GTC)/89 (ATT) GCG GTC TATTAC ACG ATT G Tyr
87G1(Asp) 87 85 (GTC)/89 (ATT) GCG GTC TATGAC ACG ATT G Asp
87C1(His) 87 85 (GTC)/89 (ATT) GCG GTC TATCAC ACG ATT G His
87A2(Asn) 87 85 (GTT)/89 (ATT) GCG GTT TATAAC ACG ATT G Asn
87T2(Tyr) 87 85 (GTT)/89 (ATT) GCG GTT TATTAC ACG ATT G Tyr
87G2(Asp) 87 85 (GTT)/89 (ATT) GCG GTT TATGAC ACG ATT G Asp
87C2(His) 87 85 (GTT)/89 (ATT) GCG GTT TATCAC ACG ATT G His
87A3(Asn) 87 85 (GTC)/89 (ATC) GCG GTC TATAAC ACG ATC G Asn
87T3(Tyr) 87 85 (GTC)/89 (ATC) GCG GTC TATTAC ACG ATC G Tyr
87G3(Asp) 87 85 (GTC)/89 (ATC) GCG GTC TATGAC ACG ATC G Asp
87C3(His) 87 85 (GTC)/89 (ATC) GCG GTC TATCAC ACG ATC G His
87A4(Asn) 87 85 (GTC)/89 (ATT) GCG GTT TATAAC ACG ATC G Asn
87T4(Tyr) 87 85 (GTC)/89 (ATT) GCG GTT TATTAC ACG ATC G Tyr
87G4(Asp) 87 85 (GTC)/89 (ATT) GCG GTT TATGAC ACG ATC G Asp
87C4(His) 87 85 (GTC)/89 (ATT) GCG GTT TATCAC ACG ATC G His
87AU1(Asn) 87 85 (GTI)/89 (ATI) GCG GTI TATAAC ACG ATI G Asn
87TU1(Tyr) 87 85 (GTI)/89 (ATI) GCG GTI TATTAC ACG ATI G Tyr
87GU1(Asp) 87 85 (GTI)/89 (ATI) GCG GTI TATGAC ACG ATI G Asp
87CU1(His) 87 85 (GTI)/89 (ATI) GCG GTI TATCAC ACG ATI G His
87A5(Asp) 87 85 (GTC)/89 (ATT) GCG GTC TAT GAC ACG ATT G Asp
87T5(Val) 87 85 (GTC)/89 (ATT) GCG GTC TAT GTC ACG ATT G Val
87G5(Gly) 87 85 (GTC)/89 (ATT) GCG GTC TAT GGC ACG ATT G Gly
87C5(Ala) 87 85 (GTC)/89 (ATT) GCG GTC TAT GCC ACG ATT G Ala
87A6(Asp) 87 85 (GTT)/89 (ATT) GCG GTT TAT GAC ACG ATT G Asp
87T6(Val) 87 85 (GTT)/89 (ATT) GCG GTT TAT GTC ACG ATT G Val
87G6(Gly) 87 85 (GTT)/89 (ATT) GCG GTT TAT GGC ACG ATT G Gly
87C6(Ala) 87 85 (GTT)/89 (ATT) GCG GTT TAT GCC ACG ATT G Ala
87A7(Asp) 87 85 (GTC)/89 (ATC) GCG GTC TAT GAC ACG ATC G Asp
87T7(Val) 87 85 (GTC)/89 (ATC) GCG GTC TAT GTC ACG ATC G Val
87G7(Gly) 87 85 (GTC)/89 (ATC) GCG GTC TAT GGC ACG ATC G Gly
87C7(Ala) 87 85(GTC)/89 (ATC) GCG GTC TAT GCC ACG ATC G Ala
87A8(Asp) 87 85 (GTC)/89 (ATT) GCG GTT TAT GAC ACG ATC G Asp
87T8(Val) 87 85 (GTC)/89 (ATT) GCG GTT TAT GTC ACG ATC G Val
87G8(Gly) 87 85 (GTC)/89 (ATT) GCG GTT TAT GGC ACG ATC G Gly
87C8(Ala) 87 85 (GTC)/89 (ATT) GCG GTT TAT GCC ACG ATC G Ala
87AU2(Asp) 87 85 (GTI)/89 (ATI) GCG GTI TAT GAC ACG ATI G Asp
87TU2(Val) 87 85 (GTI)/89 (ATI) GCG GTI TAT GTC ACG ATI G Val
87GU2(Gly) 87 85 (GTI)/89 (ATI) GCG GTI TAT GGC ACG ATI G Gly
87CU2(Ala) 87 85 (GTI)/89 (ATI) GCG GTI TAT GCC ACG ATI G Ala
aBoldface indicates missense mutations; underlining indicates silent mutations.
on May 15, 2020 by guest
http://jcm.asm.org/
bance in the hybridization step, respectively. The process con-trol, comprised of a gyrA consensus sequence, was used to monitor the correct function of the labeling PCR and hybrid-ization. The correct washing and the absence of unspecific hybridization was checked with the negative control probe, which was comprised of an Arabidopsis thalianasequence. If slides showed no signal for the first three controls or a detect-able signal for the negative control, they would be excluded from the study.
The specificity of the probes and the applicability for clinical isolates were validated by using 30 clinical E. coli isolates, which were isolated from four different hospitals in Germany. Initially, the specificity of the probes was checked by using five sequenced isolates. The final fluorescence intensities showed an array-to-array variation of up to 100%, which was related to the varying labeling efficiency achieved by each PCR and the inconsistency of the fluorescence background evoked by the poly-L-lysine. In order to set the cutoff values for a significant
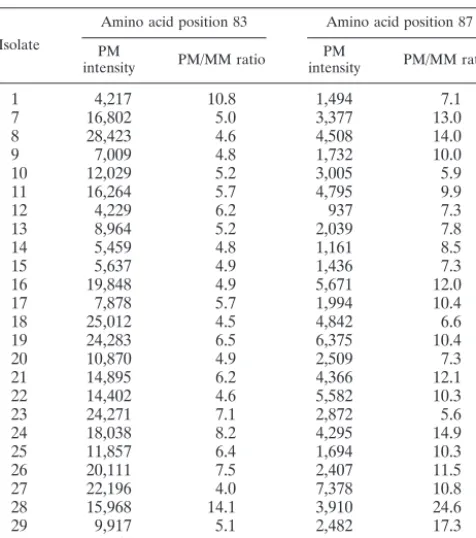
signal for further analysis, repeated experiments with these five isolates were performed. Here, the lowest quantifiable signal associated with a probe spot was found to be 300. To make the chip-based assay reliable, a value of 1,000 was chosen as a cutoff value for the PM intensity. For all five isolates, the discrimination between PM and MM signals could be made with PM/MM ratios above 4. Consequently, the cutoff value for the PM/MM ratio was set to 4. The cutoff values of 1,000 for the signal intensity and 4 for the PM/MM ratio were applied for further experiments using the remaining 25 isolates and were exceeded in all cases. The results of these experiments are shown in Table 3. The microarray results were in agreement with the outcome of the direct DNA sequencing and were in
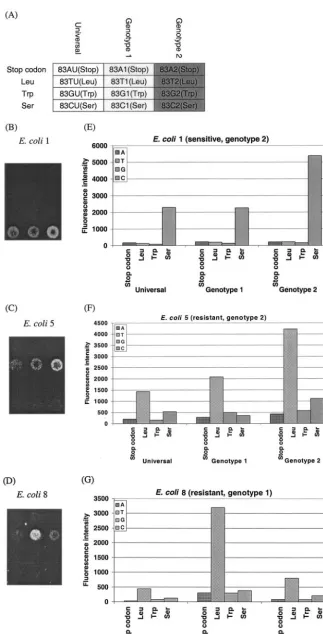
accordance with standard susceptibility testing. Three exam-ples (one sensitiveE. colistrain [E. coli1] and two resistantE. colistrains with different genotypes [E. coli5 andE. coli8]) of the missense mutations for position 83 are shown in Fig. 2. The different hybridization patterns on the microarray between quinolone-sensitive and -resistantE. coliand among different
E. coligenotypes could be seen clearly. The sensitiveE. coli
strain showed a signal corresponding with serine (Fig. 2B), while both resistantE. colistrains showed a hybridization sig-nal indicating a leucine at position 83 (Fig. 2C and D). Con-sidering the performance of the different probe sets for one amino acid position, the highest intensity of the sensitiveE. coli
strain was found for genotype 2 (Fig. 2B), while the genotypes of the two resistantE. colistrains for leucine varied between genotype 1 (Fig. 2D) and genotype 2 (Fig. 2C). The identifi-cation could be performed unambiguously, as the intensities of the PM signals were at least five fold higher than that of an MM signal, and the genotype-corresponding PM signals were at least twofold higher than those of the nonmatching probes.
Genotype analysis.An overview of the genotypes of all 30 clinical isolates determined with the diagnostic DNA microar-ray is shown in Table 4. The phenotypes of the isolates were determined by using ciprofloxacin alone or by using ciprofloxa-cin and levofloxaciprofloxa-cin (data not shown). Besides one quinolone-sensitiveE. colistrain, we identified altogether 29 quinolone-resistantE. colistrains. The quinolone-sensitive isolate had no mutation at amino acid positions 83 and 87. It appeared that 27 quinolone-resistant isolates contained the double mutations S83L and D87N. For one quinolone-resistant isolate we found the mutations S83L and D87Y. Only one quinolone-resistant isolate had the single mutation D87G. The isolates could be further classified into two genotypes with respect to their silent mutations at position 85, 91, and 100. Genotype 1 contained GTC at amino acid position 85, CGC at position 91, and TAT at position 100. Genotype 2 had GTT at position 85, CGT at position 91, and TAC at position 100. In this study, three isolates belonged to genotype 1 and 27 isolates, including the sensitive one, belonged to genotype 2.
DISCUSSION
In this study, we have developed a microarray-based assay for the detection of quinolone resistance-causing mutations in
E. coli gyrA at amino acid positions 83 and 87 for clinical
diagnostic purposes.
[image:5.603.46.284.80.349.2]Although the conventionally used disk diffusion or dilution tests are easy to perform and are applicable without additional equipment, they are time-consuming (requiring more than 1 day) and in some cases are not sensitive enough. In contrast, the microarray-based test can give unambiguous information of deeper depth (genotype) in a shorter assay time (6 h). Nevertheless, presently the use of this methods requires well-trained personnel, more steps involving handling of liquids, and expensive equipment such as fluorescently labeled nucle-otides and microarray scanners. Concerning the information depth of the microarray analysis, it is important to note that quinolone resistance (gyrAorparCdependent) may be a ques-tion of the selecques-tion of naturally occurring mutaques-tions in the microbial population.E. coliclones carrying these mutations, which may be overlooked by the usual phenotypic tests, can be
TABLE 3. Microarray data for 25 clinical isolates
Isolate
Amino acid position 83 Amino acid position 87
PM
intensity PM/MM ratio intensityPM PM/MM ratio
1 4,217 10.8 1,494 7.1
7 16,802 5.0 3,377 13.0
8 28,423 4.6 4,508 14.0
9 7,009 4.8 1,732 10.0
10 12,029 5.2 3,005 5.9
11 16,264 5.7 4,795 9.9
12 4,229 6.2 937 7.3
13 8,964 5.2 2,039 7.8
14 5,459 4.8 1,161 8.5
15 5,637 4.9 1,436 7.3
16 19,848 4.9 5,671 12.0
17 7,878 5.7 1,994 10.4
18 25,012 4.5 4,842 6.6
19 24,283 6.5 6,375 10.4
20 10,870 4.9 2,509 7.3
21 14,895 6.2 4,366 12.1
22 14,402 4.6 5,582 10.3
23 24,271 7.1 2,872 5.6
24 18,038 8.2 4,295 14.9
25 11,857 6.4 1,694 10.3
26 20,111 7.5 2,407 11.5
27 22,196 4.0 7,378 10.8
28 15,968 14.1 3,910 24.6
29 9,917 5.1 2,482 17.3
30 13,254 4.3 2,827 11.7
aPM intensity values are in arbitrary units.
on May 15, 2020 by guest
http://jcm.asm.org/
FIG. 2. Diagnostic microarray results for three clinicalE. coliisolates. (A) Partial microarray layout (position 83); (B to D) microarray images ofE. coliisolates 1, 5, and 8, respectively; (E to G) quantitative fluorescent signal intensity analysis forE. coliisolates 1, 5, and 8, respectively.
on May 15, 2020 by guest
http://jcm.asm.org/
selected and enriched due to improper quinolone use. There-fore, the early screening of such mutations that are relevant for quinolone resistance could be helpful in complementing con-ventional plate assays. Additionally, the exact knowledge of the genotype of a clinical sample containing a putative resistant strain obtained by this assay can help to identify the source of infection and/or the background of an emerging resistance phenomenon in a clinical facility (6, 23, 36).
The advantages of the microarray-based assay over other genotyping assays (SSCP [25], RFLP [29] and MAMA [12]) are (i) the designed probes are directed only against the base change that is relevant to resistance, (ii) different E. coli ge-notypes can be covered, and (iii) the substitution can be iden-tified. A greater depth of information concerning the identity of the exchanged nucleotide, which cannot be obtained by any of the other three methods, can be obtained by method pre-sented here, due to the use of specific capture probes. In case of microbial antibiotic resistance, such information could be very important. The allele-specific hybridization used in this study is easy to perform compared to other microarray plat-forms, such as single-base primer extension (26), allele-specific amplification (1), and allele-specific oligonucleotide ligation (13), and therefore is more suitable for clinical applications.
The evaluation of clinical isolates in this work was done with a setup which used hybridization under a standard coverslip. This hybridization method may be disadvantageous in terms of signal yield and reproducibility because of the limited mixing of the sample under the coverslip. To circumvent this draw-back, we considered a system using active mixture of samples. In preliminary experiments using automated hybridization sta-tions, we found that with the same amount of target DNA we could increase the specific hybridization signal by a factor of three (data not shown). A further possibility for enhancement of the signal was reviewed by Southern et al. (31). By using a spacer at the 5⬘end of the probe, the sensitivity may be further increased. The variation in intensities for different target po-sitions observed in this study is a well known fact and can be explained by a dependency of the hybridization behavior of the capture probe on the nucleotide context of the addressed tar-get sequence (32). The overall intensities corresponding to capture probes designed for position 83 were higher than those for probes directed to position 87. The universal probes for both amino acid positions, which were intended to replace the specific probes in future applications, showed noticeably lower signals than the specific capture probes. This observation can be linked to the lower stability of the DNA duplexes containing inosine compared to those of the standard DNA bases (A:T and G:C) (19). The use of specific probe sets will be preferred in the future, especially as additional information about theE. coligenotype can be extracted for epidemiological studies.
All of the E. coliisolates investigated could be identified correctly regarding the mutations at positions 83 and 87 by using designed probes. All isolates except one had a uniform missense mutation, S83L, which is in accordance with the lit-erature data (5). The further missense mutation at position 87 was either D87N (n⫽27) or D87Y (n⫽1). The quinolone-resistant isolate without a mutation at position 83 had a D87G mutation, which is also reported for this position, but only in combination with a mutation at position 83 (7). It was specu-lated that the quinolone resistance ofE. coliis developed by
TABLE 4. Genotypes of 30 clinical isolates determined by using the diagnostic DNA microarray or no. of isolates Codon(s) (amino acid[s]) at amino acid position a : Phenotype 67 b 81 82 83 84 85 87 89 91 b 100 b 102 b 106 b coli K-12 GCC (Ala) GGT (Gly) GAC (Asp) TCG (Ser) GCG (Ala) GTC (Val) GAC (Asp) ATC (Ile) CGC (Arg) TAT (Tyr) CTG (Leu) CAG (Gln) C G (Ser) GTT G AC (Asp) CGT TAC Sensitive T G (Leu) GTC A AC (Asn) CGC TAT Resistant T T G (Leu) GTT A AC (Asn) CGT TAC Resistant T G (Leu) GTT T AC (Tyr) CGT TAC Resistant C G (Ser) GTT G G C (Gly) CGT TAC Resistant a Boldface indicates missense mutations; underlining indicates silent mutations. b This position was outside the region covered by the capture probe and therefore was determined by DNA sequencing.
on May 15, 2020 by guest
http://jcm.asm.org/
[image:7.603.103.221.81.725.2]stepwise mutation of thegyrAgene followed by theparCgene (14, 15). According to reports to date, the first mutation step on the A subunit of the DNA gyrase takes place at amino acid position 83. The mutation at position 87 without a change at position 83, which was observed in this study, was rarely re-ported (25). Theoretically, these 29 isolates could contain ad-ditional missense mutations in gyrA or other genes, such as
parC, because they are not covered by the array described in this publication. However, the two missense mutations in amino acid positions 83 and 87 alone are enough to cause quinolone resistance. From a clinical viewpoint, special atten-tion should be paid to the treatment ofE. coliwith missense mutations at these two positions because they are the starting point for further missense mutations (for example, in parC) which cause increased quinolone MICs (3, 11, 18, 24). In the future, new capture probes will be designed and added to the microarray as soon as new resistance-causing mutations are discovered in order to broaden the spectrum of the diagnostic microarray.
Conclusion.The application of the microarray-based single-base-mutation identification assay for resistance detection in clinical diagnostics has been demonstrated with 30 clinicalE. coli isolates. Our data show that this kind of assay can be a suitable screening method for identifying prevalentgyrA mu-tations in clinical isolates ofE. coli. Furthermore, such an assay could be used for monitoring of resistance occurrence for long-term antibiotic treatment in medical practices, as well as for the investigation of resistance mechanisms in basic research. The ability to distinguish among different E. coli genotypes including silent mutations also makes it suitable for epidemi-ological studies. Combined with capture probes designed for other antibiotic resistances, such as beta-lactam resistance and aminoglycoside resistance, the assay could be extended for the detection of multiresistant pathogenic microorganisms in hu-man health care.
ACKNOWLEDGMENTS
This project is funded within the GenoMik research initiative by the German Federal Ministry of Education and Research (BMBF).
REFERENCES
1. Ahmadian, A., B. Gharizadeh, D. O’Meara, J. Odeberg, and J. Lundeberg.
2001. Genotyping by apyrase-mediated allele-specific extension. Nucleic Ac-ids Res.29:e121.
2. Aoyama, H., K. Sato, T. Kato, K. Hirai, and S. Mitsuhashi.1987. Norfloxacin resistance in a clinical isolate ofEscherichia coli. Antimicrob. Agents Che-mother.31:1640–1641.
3. Bagel, S., V. Hullen, B. Wiedemann, and P. Heisig.1999. Impact ofgyrAand parCmutations on quinolone resistance, doubling time, and supercoiling degree ofEscherichia coli. Antimicrob. Agents Chemother.43:868–875. 4. Booth, S. A., M. A. Drebot, I. E. Martin, and L. K. Ng.2003. Design of
oligonucleotide arrays to detect point mutations: molecular typing of anti-biotic resistant strains of Neisseria gonorrhoeae and hantavirus infected deer mice. Mol. Cell. Probes17:77–84.
5. Cambau, E., and L. Gutmann.1993. Mechanisms of resistance to quino-lones. Drugs45(Suppl. 3):15–23.
6. Chen, J. Y., L. K. Siu, Y. H. Chen, P. L. Lu, M. Ho, and C. F. Peng.2001. Molecular epidemiology and mutations at gyrA and parC genes of cipro-floxacin-resistant Escherichia coli isolates from a Taiwan medical center. Microb. Drug Resist.7:47–53.
7. Conrad, S., M. Oethinger, K. Kaifel, G. Klotz, R. Marre, and W. V. Kern.
1996. gyrA mutations in high-level fluoroquinolone-resistant clinical isolates of Escherichia coli. J. Antimicrob. Chemother.38:443–455.
8. Crumplin, G. C.1990. Mechanisms of resistance to the 4-quinolone antibac-terial agents. J. Antimicrob. Chemother.26(Suppl. F):131–144.
9. Cullen, M. E., A. W. Wyke, R. Kuroda, and L. M. Fisher.1989. Cloning and characterization of a DNA gyrase A gene fromEscherichia colithat confers
clinical resistance to 4-quinolones. Antimicrob. Agents Chemother.33:886– 894.
10. Denis, A., and N. J. Moreau.1993. Mechanisms of quinolone resistance in clinical isolates: accumulation of sparfloxacin and of fluoroquinolones of various hydrophobicity, and analysis of membrane composition. J. Antimi-crob. Chemother.32:379–392.
11. Everett, M. J., Y. F. Jin, V. Ricci, and L. J. Piddock.1996. Contributions of individual mechanisms to fluoroquinolone resistance in 36Escherichia coli strains isolated from humans and animals. Antimicrob. Agents Chemother.
40:2380–2386.
12. Fisher, L. M., J. M. Lawrence, I. C. Josty, R. Hopewell, E. E. Margerrison, and M. E. Cullen.1989. Ciprofloxacin and the fluoroquinolones. New con-cepts on the mechanism of action and resistance. Am. J. Med.87:2S–8S. 13. Gunderson, K. L., X. H. C. Huang, M. S. Morris, R. J. Lipshutz, D. J.
Lockhart, and M. S. Chee.1998. Mutation detection by ligation to complete n-mer DNA arrays. Genome Res.8:1142–1153.
14. Heisig, P.1996. Genetic evidence for a role ofparCmutations in develop-ment of high-level fluoroquinolone resistance inEscherichia coli. Antimi-crob. Agents Chemother.40:879–885.
15. Heisig, P., and R. Tschorny.1994. Characterization of fluoroquinolone-resistant mutants ofEscherichia coliselected in vitro. Antimicrob. Agents Chemother.38:1284–1291.
16. Hooper, D. C., J. S. Wolfson, E. Y. Ng, and M. N. Swartz.1987. Mechanisms of action of and resistance to ciprofloxacin. Am. J. Med.82:12–20. 17. Karlin, S., and S. F. Altschul.1990. Methods for assessing the statistical
significance of molecular sequence features by using general scoring schemes. Proc. Natl. Acad. Sci. USA87:2264–2268.
18. Khodursky, A. B., E. L. Zechiedrich, and N. R. Cozzarelli.1995. Topoisom-erase IV is a target of quinolones in Escherichia coli. Proc. Natl. Acad. Sci. USA92:11801–11805.
19. Martin, F. H., M. M. Castro, F. Aboulela, and I. Tinoco.1985. Base-pairing involving deoxyinosine—implications for probe design. Nucleic Acids Res.
13:8927–8938.
20. Mikhailovich, V., S. Lapa, D. Gryadunov, A. Sobolev, B. Strizhkov, N. Chernyh, O. Skotnikova, O. Irtuganova, A. Moroz, V. Litvinov, M. Vladimir-skii, M. Perelman, L. Chernousova, V. Erokhin, A. Zasedatelev, and A. Mirzabekov.2001. Identification of rifampin-resistantMycobacterium tuber-culosisstrains by hybridization, PCR, and ligase detection reaction on oli-gonucleotide microchips. J. Clin. Microbiol.39:2531–2540.
21. Mikhailovich, V. M., S. A. Lapa, D. A. Gryadunov, B. N. Strizhkov, A. Y. Sobolev, O. I. Skotnikova, O. A. Irtuganova, A. M. Moroz, V. I. Litvinov, L. K. Shipina, M. A. Vladimirskii, L. N. Chernousova, V. V. Erokhin, and A. D. Mirzabekov.2001. Detection of rifampicin-resistant Mycobacterium tuberculosis strains by hybridization and polymerase chain reaction on a specialized TB-microchip. Bull. Exp. Biol. Med.131:94–98.
22. Moniot-Ville, N., J. Guibert, N. Moreau, J. F. Acar, E. Collatz, and L. Gutmann.1991. Mechanisms of quinolone resistance in a clinical isolate of Escherichia colihighly resistant to fluoroquinolones but susceptible to nali-dixic acid. Antimicrob. Agents Chemother.35:519–523.
23. Ng, L. K., P. Sawatzky, I. E. Martin, and S. Booth.2002. Characterization of ciprofloxacin resistance in Neisseria gonorrhoeae isolates in Canada. Sex. Transm. Dis.29:780–788.
24. Oethinger, M., W. V. Kern, A. S. Jellen-Ritter, L. M. McMurry, and S. B. Levy.2000. Ineffectiveness of topoisomerase mutations in mediating clini-cally significant fluoroquinolone resistance inEscherichia coliin the absence of the AcrAB efflux pump. Antimicrob. Agents Chemother.44:10–13. 25. Ouabdesselam, S., D. C. Hooper, J. Tankovic, and C. J. Soussy.1995.
Detection ofgyrAandgyrBmutations in quinolone-resistant clinical isolates ofEscherichia coliby single-strand conformational polymorphism analysis and determination of levels of resistance conferred by two different single gyrAmutations. Antimicrob. Agents Chemother.39:1667–1670.
26. Pastinen, T., A. Kurg, A. Metspalu, L. Peltonen, and A. C. Syvanen.1997. Minisequencing: a specific tool for DNA analysis and diagnostics on oligo-nucleotide arrays. Genome Res.7:606–614.
27. Piddock, L. J.1999. Mechanisms of fluoroquinolone resistance: an update 1994–1998. Drugs58(Suppl. 2):11–18.
28. Power, E. G., J. L. Munoz Bellido, and I. Phillips.1992. Detection of ciprofloxacin resistance in gram-negative bacteria due to alterations in gyrA. J. Antimicrob. Chemother.29:9–17.
29. Qiang, Y. Z., T. Qin, W. Fu, W. P. Cheng, Y. S. Li, and G. Yi.2002. Use of a rapid mismatch PCR method to detect gyrA and parC mutations in cip-rofloxacin-resistant clinical isolates of Escherichia coli. J. Antimicrob. Che-mother.49:549–552.
30. Smith, J. T.1986. The mode of action of 4-quinolones and possible mech-anisms of resistance. J. Antimicrob. Chemother.18(Suppl. D):21–29. 31. Southern, E., K. Mir, and M. Shchepinov.1999. Molecular interactions on
microarrays. Nat. Genet.21:5–9.
32. Southern, E. M., S. C. Casegreen, J. K. Elder, M. Johnson, K. U. Mir, L. Wang, and J. C. Williams.1994. Arrays of complementary oligonucleotides for analyzing the hybridization behavior of nucleic-acids. Nucleic Acids Res.
22:1368–1373.
33. Troesch, A., H. Nguyen, C. G. Miyada, S. Desvarenne, T. R. Gingeras, P. M.
on May 15, 2020 by guest
http://jcm.asm.org/
Kaplan, P. Cros, and C. Mabilat.1999.Mycobacteriumspecies identification and rifampin resistance testing with high-density DNA probe arrays. J. Clin. Microbiol.37:49–55.
34. Wang, D. G., J. B. Fan, C. J. Siao, A. Berno, P. Young, R. Sapolsky, G. Ghandour, N. Perkins, E. Winchester, J. Spencer, L. Kruglyak, L. Stein, L. Hsie, T. Topaloglou, E. Hubbell, E. Robinson, M. Mittmann, M. S. Morris, N. P. Shen, D. Kilburn, J. Rioux, C. Nusbaum, S. Rozen, T. J. Hudson, R. Lipshutz, M. Chee, and E. S. Lander.1998. Large-scale identification, map-ping, and genotyping of single-nucleotide polymorphisms in the human ge-nome. Science280:1077–1082.
35. Wilson, D. L., S. R. Abner, T. C. Newman, L. S. Mansfield, and J. E. Linz.
2000. Identification of ciprofloxacin-resistantCampylobacter jejuniby use of a fluorogenic PCR assay. J. Clin. Microbiol.38:3971–3978.
36. Yoo, J. H., D. H. Huh, J. H. Choi, W. S. Shin, M. W. Kang, C. C. Kim, and D. J. Kim.1997. Molecular epidemiological analysis of quinolone-resistant Escherichia coli causing bacteremia in neutropenic patients with leukemia in Korea. Clin. Infect. Dis.25:1385–1391.
37. Yoshida, H., M. Bogaki, M. Nakamura, and S. Nakamura.1990. Quinolone resistance-determining region in the DNA gyrasegyrAgene ofEscherichia coli. Antimicrob. Agents Chemother.34:1271–1272.