ISSN Online: 2327-6053 ISSN Print: 2327-6045
Response Surface Methodology as an Approach
for Optimization of the Synthesis of
1-(2-Aminoethyl)-2-imidazolidone
Yaoyi He, Jianguo Cai, Yu Zhang
Chemical Engineering Research Institute, East China University of Science and Technology, Shanghai, China
Abstract
Ruthenium loaded on activated carbon pre-treated by HNO3 was used to cat-alyze the reaction of 1-(2-Aminoethyl)-2-imidazolidone (AEI) synthesized from ethylenediamine, ethanolamine and CO2. Response surface methodology (RSM) based on Box-Behnken design (BBD) was employed to optimize the synthesis of AEI. The statistical analysis results showed that the yield of AEI was significantly affected by the CO2 pressure, reaction temperature and reac-tion time. According to the results of variance analysis, the value of the de-termination coefficient of 0.9854 was in reasonable agreement with the “Adj R-Squared” of 0.9666, which means this model can predict the yield of AEI well and can be used to optimize reaction conditions for higher AEI yield. The optimal values of AEI yield predicted by RSM was 84.9% under temperature 206.51˚C, CO2 pressure 9.35 Mpa, reaction time 10.11 h, and the verification experiment yield of AEI was 83.1%.
Keywords
1-(2-Aminoethyl)-2-imidazolidone, Synthesis, Ru/AC, Response Surface Design
1. Introduction
The development of efficient approach to the production of imidazolidone de-rivative is a valued research area since many imidazolidone dede-rivatives are wide-ly used in pharmaceutical, material and some other field [1]. 1-(2-Ami-noe- thyl)-2-imidazolidone, also been called AEI, is one of the most important 2-imidazolidone derivative which is widely used as intermediates in the synthesis of tetrazolium diamine somatotropin secretagogue [2] and oxadiazoles enzyme inhibitors [3], it can be also used as functional additive in the material field [4]. How to cite this paper: He, Y.Y., Cai, J.G.
and Zhang, Y. (2017) Response Surface Methodology as an Approach for Optimi-zation of the Synthesis of 1-(2-Aminoe- thyl)-2-imidazolidone. Journal of Materials Science and Chemical Engineering, 5, 155- 167.
http://dx.doi.org/10.4236/msce.2017.51019
The first synthetic method of AEI was mentioned in a patent of American in 1952 [5]. Since then, few related synthetic methods were reported. Liu has de-signed the method using ethanolamine and imidazolidone as reactants to syn-thesis AEI with the existence of thionyl chloride and the side-product of this route contains HCl [6]. Ren use triethylene diamine and urea to synthesis AEI under high temperature [7].
This is the first time to synthesize AEI from ethylene diamine, ethanolamine and CO2 catalyzed by Ru/AC. The reaction was carried out in a reactor as Equa-tion 1, and actually it consists of two reacEqua-tions (EquaEqua-tion 2, EquaEqua-tion 3). Ruthe-nium loaded on activated carbon (AC) was used as the catalyst. CO2, one of the reactants, exists in supercritical state which has excellent solubility and mass transfer ability, and that would be conducive to the synthesis of AEI [8] [9] [10]. Response surface methodology (RSM) is an effective method of optimizing process conditions, it can collectively optimize all the affecting parameters to eliminate the limitations of a single factor optimization process, it’s also an ef-fective way to identify the important factor among a large number of variables. RSM, which includes factorial design and regression analysis, helps in evaluating the important factors, building models to study the interaction between the va-riables, and selecting the optimum conditions of variables or desirable responses. [11] [12].
2. Experimental
2.1. MaterialsAnhydrous ethylenediamine and ethanolamine, analytically pure, were purchased
CO2 H
2N
NH2 HN N
O
NH2
2 H2O
H2N
OH
+ +
+
Equation 1. Reaction equation of the synthesis of AEI.
CO2
H2N
NH2
+ HN NH + H2O
O
Equation 2. 2-Imidazolidone synthesized from ethylenediamine and CO2.
HN NH
O
HN N
O
NH2
H2O H2N
OH
+ +
from Shanghai Lingfeng Chemical reagent Industrial Co., Ltd., China. High- purity hydrogen and CO2 (>98%v/v), Shanghai Wujing Industrial Co., Ltd., China and directly used from a cylinder. Ruthenium (RuCl3·3H2O, Ru ≥ 37%), the AC carrier were purchased from Sinopharm Chemical Reagent Co., Ltd., China. Reference AEI (>98%), Sigma-Aldrich.
2.2. Catalyst Preparation
It was reported that there are oxygen containing functional groups and nitrogen containing functional groups on the surface of AC [13], and those groups (espe-cially oxygen containing functional groups) has proven to be the depocenter of metal which loaded on AC. Treated by acidic or alkaline can change the quanti-ties of groups on the surface of AC [14] [15]. The more oxygen containing func-tional groups contains on the surface of AC is, the easier solution of metal salts conducts with surface of AC.
AC was pre-treated by 20% nitric acid (HNO3-TAC), 20% hydrochloric acid (HCl-TAC) and 2 mol/L sodium hydroxide (NaOH-TAC) before ruthenium loaded on it. Those pre-treated AC would be tested by Boehm titration method to confirm the amount of oxygen containing functional groupssince those func-tional groups would make it easier for Ru3+ to contact with and to load on the surface of AC.
The 1% Ru/TAC catalyst was prepared by incipient-wetness impregnation method. RuCl3·3H2O was dissolved in a certain amount of water, TAC was add-ed to the resulting solution with stirring. After 12 hours, NaOH was addadd-ed into solution above, stirring for another 12 hours. The Ru3+/TAC was reduced under 5 MPa, 240˚C for 4 hours.
2.3. Synthesis of AEI
[image:3.595.212.533.584.706.2]The schematic diagram of reaction system is given in Figure 1. Synthesis of AEI was carried out in a 140 ml high pressure reactor. 1.5 g of 1% Ru/TAC, 1.5 g ethylenediamine and 1.5 g ethanolamine were loaded into the reactor, assemble the reaction equipment. Flush the reactor with CO2 twice, heat the reactor to the required temperature and then fill the reactor with CO2 to required pressure. When the reaction finish, the liquid product is separated from the catalyst by
Figure 1. Schematic diagram of reaction system. 1. CO2 cylinder, 2.CO2 Compressor, 3.
filtration and was analyzed by GC-FID (capillary column, 50 m × 0.32 mm × 0.52 μm, Agilent Technologies Inc.).
3. Results and Discussion
3.1. The TAC and Its CatalysisBoehm titration [16] is a method of titration which can confirm the amount of oxygen containing functional groups since NaHCO3 can only react with carbox-yle on the surface of TAC, Na2CO3 can react with carboxyle and lactonic group on the surface of TAC and NaOH can react with carboxyle, lactonic, phenolic hydroxyl group on the surface of TAC. The results of Boehm titration are in Ta-ble 1. As it shows in TaTa-ble 1, the amount of oxygen containing functional groups on the surface of HNO3-TAC was increased a lot, while HCl-TAC just had a slight increase comparing with AC. It can also be seen that the amount of oxygen containing functional groups on the surface of NaOH-TAC was de-creased comparing with AC.
Load 1% ruthenium on those TAC and use them to synthesis AEI, results were in Table 2. From Table 2, it can be seen that Ru/HNO3-TAC has a better catalytic activity than those of others under 6 MPa, 200˚C, 8 hours.
3.2. Single Factor Experiment
3.2.1. Effect of CO2 Pressure
[image:4.595.209.540.587.665.2]To evaluate the influence of the CO2 pressure, AEI was synthesized at fixed temperature of 220˚C and reaction time of 10 hours with 1% Ru/HNO3-TAC as catalyst. The CO2 pressure was varied from 6 MPa to 12 MPa. Results are shown in Figure 2, as it can be seen from Figure 2, the yield of AEI is significantly af-fected by the CO2 pressure. When the CO2 pressure increases to 8 MPa, the yield of AEI reach the maximum value, while the CO2 pressure exceed 8 MPa, the yield of AEI decrease. The possible reason was that when CO2 pressure was un-der 8 MPa, increase of CO2 pressure is good for the generation of 2-imidazoli- done, while continually increase the CO2 pressure will dilute ethanolamine, and influence and affect the second step of the reaction (Equation 3). What’s more, CO2 can interact with the amidogen of 2-imidazolidone, that impede the reaction
Table 1. Concentration of oxygen containing functional groups on the surface of TAC.
Carboxyle (mol/g) Lactonic (mol/g) Phenolic hydroxyl group (mol/g)
HNO3-TAC 5.732 × 10⁻⁴ 3.264 × 10⁻⁴ 1.716 × 10⁻⁴
HCl-TAC 2.937 × 10⁻⁴ 1.992 × 10⁻⁴ 8.143 × 10⁻⁵
NaOH-TAC 7.237 × 10⁻⁵ 9.027 × 10⁻⁵ 2.719 × 10⁻⁵
AC 2.058 × 10⁻⁴ 1.773 × 10⁻⁴ 5.638 × 10⁻⁵
Table 2. Influence of Ru/TAC on the yield of AEI.
Catalyst Ru/HNO3-TAC Ru/HCl-TAC Ru/HNO3-TAC Ru/AC
[image:4.595.203.539.699.732.2]Figure 2. Influence of CO2 pressure reaction conditions: T = 220˚C, t = 10 h.
between 2-imidazolidone and ethanolamine [17] and cause decrease of the yield of AEI.
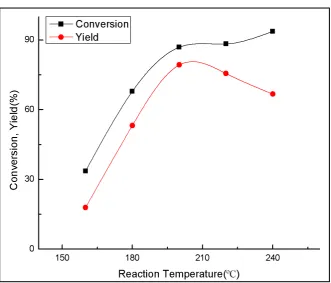
3.2.2. Effect of Temperature
Reaction temperature is also a critical factor for this reaction. Synthesis of AEI was studied in fixed CO2 pressure 8 MPa and reaction time 10 h, reaction tem-perature ranges from 160˚C to 240˚C, and experimental results are shown in Figure 3. As seen from Figure 3, yield of AEI is significantly affected by the reaction temperature. As the reaction temperature increases to 200˚C, the yield of AEI reach the maximum value. That means a higher temperature can raise the conversion of ethylenediamine and the yield of AEI. When the reaction temper-ature keeps increasing, there would be carbonization reaction carried out in the reactor. It can be observed that the color of final product is becoming deeper as the reaction temperature increasing.
3.2.3. Effect of Reaction Time
Figure 3. Influence of reaction temperature reaction conditions: P = 8 MPa, t = 10 h.
Figure 4. Influence of reaction time reaction conditions: T = 220˚C, P = 8 Mpa.
4. Response Surface Experiment Design
AEI. In this design, the effects of three independent factors, A (reaction temper-ature), B (CO2 pressure), C (reaction time), was examined at three levels: −1 for the low level,0 for the median and +1 for the high level. Table 3 illustrates the factors and their corresponding levels used in the experiment design. The values of three levels were set according to the previous single factor experiments.
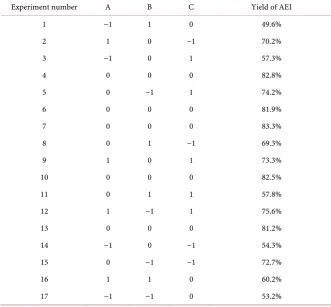
The Box-Behnken design and values of synthesis of AEI are shown in Table 4. It shows the Box-Behnken design for 3 factors number has 17 experiments. The experimental sequence was randomized in order to minimize the effects of the uncontrolled factors, five experiments are repeated in order to estimate the ex-perimental error. Multiple regression analysis was used to analyze the data and thus a second-order polynomial equation was derived, as follows:
4
6 3 4 2
2 2
yield 19.50387 0.15074 0.66512 0.33194 7.375 10 6.25 10 8.125 10 3.48437 10
0.023031 0.012719
A B C A B
A C B C A
[image:7.595.209.538.323.394.2]B c − − − − = − + ∗ + ∗ + ∗ − ∗ ∗ ∗ + ∗ ∗ ∗ − ∗ ∗ ∗ − ∗ ∗ − ∗ − ∗
Table 3. Factors levels table of response surface experiments.
level Factors
A (Temperature/˚C) B (CO2 pressure/MPa) C (time/h)
−1 180 8 8
0
1 200 220 10 12 10 12
Table 4. Scheme and results of response surface experiments.
Experiment number A B C Yield of AEI
1 −1 1 0 49.6%
2 1 0 −1 70.2%
3 −1 0 1 57.3%
4 0 0 0 82.8%
5 0 −1 1 74.2%
6 0 0 0 81.9%
7 0 0 0 83.3%
8 0 1 −1 69.3%
9 1 0 1 73.3%
10 0 0 0 82.5%
11 0 1 1 57.8%
12 1 −1 1 75.6%
13 0 0 0 81.2%
14 −1 0 −1 54.3%
15 0 −1 −1 72.7%
16 1 1 0 60.2%
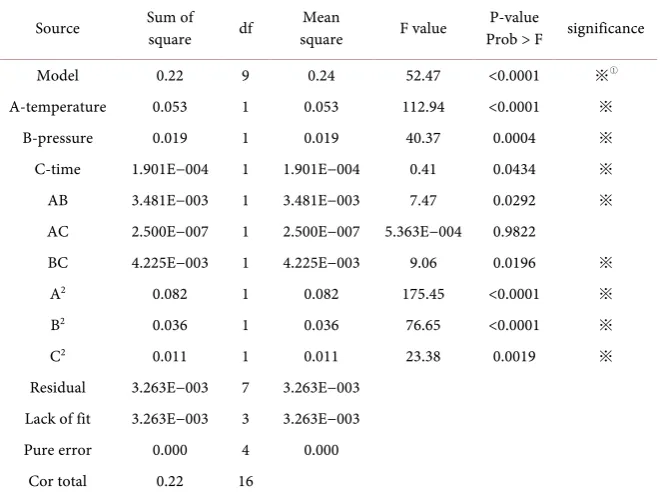
[image:7.595.206.538.428.735.2]4.1. Data Analysis and Evaluation of the Model by RSM [18]
Results of variance analysis for this regression model are shown in Table 5. As shown in Table 5, the model “F-value” of 52.47 implies the model is significant. Value of “Prob > F” less than 0.0500 indicate that model terms are significant. In this case, linear terms of A, B, C, quadratic terms of A2, B2, C2, and interactive terms of AB and BC are significant for the yield of AEI. Values greater than 0.1000 indicates that the model terms are not significant, interactive term AC is not significant for the yield of AEI. The R2 (coefficient of determination) value was 0.9854, which means 98.54% variability of the total variation in the yield of AEI is attributed to the experimental variables studies, “Adj R-Squared” valued 0.9666 indicated good agreement between the experimental and the predicted values ,and the adequate precision (greater than 4 is desirable) is the signal to noise ratio valued 20.026.
4.2. Response Surface Analysis
The graphical representations of the regression model, called the response sur-face plots (3D) and their corresponding contour plots (2D) were obtained using Design-Expert software and presented in Figures 5-7, where each response sur-face plot showed the effect of two independent factors while the third factor was hold at zero levels. Whether the mutual interaction between the independent factors is significant or not can be indicated by the shape of the corresponding contour plot, and the optimum point always lies in the area around the peak.
[image:8.595.209.540.470.718.2]Figure 5 show the effects of reaction temperature and CO2 pressure on the yield of AEI while reaction time were kept at zero level, it was shown that the
Table 5. Variance analysis of regression model.
Source Sum of square df square Mean F value Prob > F P-value significance
Model 0.22 9 0.24 52.47 <0.0001 ※①
A-temperature 0.053 1 0.053 112.94 <0.0001 ※
B-pressure 0.019 1 0.019 40.37 0.0004 ※
C-time 1.901E−004 1 1.901E−004 0.41 0.0434 ※
AB 3.481E−003 1 3.481E−003 7.47 0.0292 ※
AC 2.500E−007 1 2.500E−007 5.363E−004 0.9822
BC 4.225E−003 1 4.225E−003 9.06 0.0196 ※
A2 0.082 1 0.082 175.45 <0.0001 ※
B2 0.036 1 0.036 76.65 <0.0001 ※
C2 0.011 1 0.011 23.38 0.0019 ※
Residual 3.263E−003 7 3.263E−003 Lack of fit 3.263E−003 3 3.263E−003
Pure error 0.000 4 0.000
Cor total 0.22 16
Figure 5. Response surface and contours of temperature and CO2 pressure.
yield of AEI increases as reaction temperature and CO2 pressure increase to op-timum values, then the yield of AEI decreases when reaction temperature and CO2 pressure keep increasing. And the 2D corresponding contour plot showed a clearly elongated running diagonally on plot which suggesting interaction be-tween reaction temperature and CO2 pressure has a significant effect on the yield of AEI.
Figure 6. Response surface and contours of temperature and reaction time.
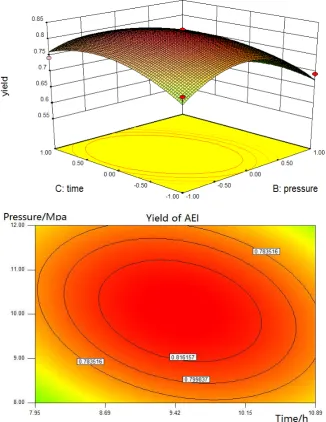
Effects on the yield of AEI produced by the interaction between reaction time and CO2 pressure are donated in Figure 7. As reaction time increases, the yield of AEI increases when the CO2 pressure is under 10 MPa, but when the CO2 pressure increases to higher than 10 Mpa, the yield of AEI decreases. And the 2D corresponding contour plot reveals that the effect of CO2 pressure and reaction time on the yield of AEI is very significant.
4.3. Optimal Conditions and Verification of the Model
Figure 7. Response surface and contours of CO2 pressure and reaction time.
5. Conclusion
References
[1] Xu, K. and Bai, G.Y. (2010) The Effect of Solvents on the Synthesis of 2-Imidazoli- done. Fine and Specialty Chemicals, 11, 22-24.
[2] Ronald, L.W., Scott, D.B., Wei, J.M., et al. (2008) Dual Binding Site Inhibitors of B-RAF Kinase Bioorg. Med Chem Lett, 18, 2825-2829.
https://doi.org/10.1016/j.bmcl.2008.04.002
[3] Li, J.J., Wang, H.X., Li, J., et al. (2008) Tetrazole Based Amides as Growth Hormone Secretagogues. Med Chem Lett, 18, 2536-2539.
https://doi.org/10.1016/j.bmcl.2008.03.059
[4] Michael, J.D. and Keith, W.W. (2000) Imidazolidinone Diamine Modified Polyure-thane Dispersions. J Adhes, 13, 99-106.
[5] Hurwitz, M.D. (1952) Synthesis of 2-Imidazolidinone Derivatives. The United Stated: US002613212.
[6] Liu, M. (2011) Synthesis and Study on Technology of 2-Imidazolidinone Derivatives and Trifluoroacetic Acid. East China University of Science and Technology, Shang-hai.
[7] Ren, Y.J. and Liu, M. (2011) Review of the Synthesisi of 2-Imidazolidinone Deriva-tives. Journal of Shanghai Institute of Technology, 11, 205-209.
[8] Yue, X.D. and He, L.N. (2006) Progress in the Study of Biphasic Systems Prompted by Supercritical Carbon Dioxide and Their Applications to Organic Syntheses.
Chi-nese Journal of Organic Chemistry, 26, 610-617.
[9] Du, Y., Wang, J.Q., et al. (2005) Organic Reactions Using Gases in Supercritical Carbon Dioxide. Fine Chemical Intermdiates, 35, 1-7.
[10]Zhang, L. (2013) Research on Synthesis of Salicylic Acid by Supercritical Carbon Dioxide. Hebei University of Science and Technology.
[11]Mao, C.P., Zhang, B., et al. (2014) Optimized Preparation of Zinc-Inorganic Anti-bacterial Material Containing Samarium Using Response Surface Methodology.
Journal of Rare Earths, 32, 900-906.https://doi.org/10.1016/S1002-0721(14)60161-7
[12]Palanivel, R. and Koshy Mathews, P. (2012) Prediction and Optimization of Process Parameter of Friction Stir Welded AA5083-H111 Aluminum Alloy Using Response Surface Methodology. Journal of central south University, 19, 1-8.
https://doi.org/10.1007/s11771-012-0964-y
[13]Rodriguez-Reinoso, F. (1998) The Role of Carbon Meterials in Heterogeneous Ca-talysis. Carbon, 36, 159-175.https://doi.org/10.1016/S0008-6223(97)00173-5
[14]Kowalcyzyk, Z, Sentek, J., Jodzis, S., et al. (1996) Thermally Modified Active Carbon as Support for Catalysts for Ammonia Synthesis. Carbon, 34, 403-409.
https://doi.org/10.1016/0008-6223(95)00199-9
[15]Auer, E., Freund, A., Pietsch, J., et al. (1998) Carbons as Supports for Industrial Pre-cious Metal Catalysts. Applied catalysis A: General, 173, 259-271.
https://doi.org/10.1016/S0926-860X(98)00184-7
[16]Goertzen, S.L., Oickle, A.M., Tarasuk, A.C., et al. (2010) Standardization of the Boehm Titration. Part I. CO Expulsion and Endpoint Determination. Carbon, 48, 1252-1261.https://doi.org/10.1016/j.carbon.2009.11.050
[17]Ma, H.X. and Cai, J.G. (2014) Catalytic Hydrogenation of 1,4-Phenylenediamine to 1,4-Cyclohexanediamine. Russ J Appl Chem, 87, 396-402.
https://doi.org/10.1134/S1070427214030239
Candida Tropicalis Z-04 Using Plackett-Burman Design and Response Surface Me-thodology. Journal of Environmental Sciences, 23, 22-30.
https://doi.org/10.1016/S1001-0742(10)60369-5
Submit or recommend next manuscript to SCIRP and we will provide best service for you:
Accepting pre-submission inquiries through Email, Facebook, LinkedIn, Twitter, etc. A wide selection of journals (inclusive of 9 subjects, more than 200 journals)
Providing 24-hour high-quality service User-friendly online submission system Fair and swift peer-review system
Efficient typesetting and proofreading procedure
Display of the result of downloads and visits, as well as the number of cited articles Maximum dissemination of your research work
Submit your manuscript at: http://papersubmission.scirp.org/