The Consequence of Particle Crushing in Engineering
Properties of Granular Materials
Omar H. Al Hattamleh1, Hussien H. Al-Deeky2, Mohammad N. Akhtar3 1
Associate Professor, Civil Engineering Department, Fahad Bin Sultan University, Tabuk, KSA 2
Assistant Lecturer, Hashemite University, Zarqa, Jordan 3
Lecturer, Fahad Bin Sultan University, Tabuk, KSA
Email: [email protected], [email protected], [email protected]
Received June 29, 2013; revised July 27, 2013; accepted August 25, 2013
Copyright © 2013 Omar H. Al Hattamleh et al. This is an open access article distributed under the Creative Commons Attribution License, which permits unrestricted use, distribution, and reproduction in any medium, provided the original work is properly cited.
ABSTRACT
This paper presents experimental investigation for particles breakage for natural sand. The particle breakage was in-duced by subjecting the sample to one dimensional compression. Grain size analyses were performed before and after induced breakage. Thereafter, the sand shear strength parameters were assessed using direct shear box tests and the co-efficient of permeability was assessed using constant head permeameter. Examining the obtained results revealed that the amount of breakage due to one dimensional compression was of order higher than the amount occurring during di-rect shear test. Peak shear strength parameters decreased with the particles breakage increasing. Moreover, dilation an-gle of shear strength pronouncedly decreases with the amount of particles breakage increasing. Crushing has obvious effect on the evaluated coefficient of permeability.
Keywords: Sand; Dilatancy; Frictional Materials; Crushing; Particle Breakage; Permeability
1. Introduction
Sand particles breakage represents one of the most im-portant factors that are able to alter the mechanical proper-ties of Sand through increasing the portion of fines. The topic is of interest to many research disciplines including powder technology, minerals and mining engineering, geology, geophysics and geomechanics [1-4]. Grain crushing is one of the micromechanisms that govern the stress-strain behavior of a granular material and also its permeability by altering the grain size distribution [5]. The behavior of granular materials is very multifaceted, behaving neither like solids nor like viscous fluids. Stresses inside the granular body are composed by multi- ple of stress chains, which can lead to local high-stress concentrations within the system. The high stress con- centration may lead to inducing crushing of single parti-cle even under relatively low stresses. If sand partiparti-cles are broken into smaller particles due to the application of external force, physical and mechanical properties of the granular matter will undergo substantial change. There- fore, the original engineering properties with which a structure was designed will change during its engineering life. Examples of these structures which will suffer from such changes are pavements: highway embankments,
earth dams’ embankment, and rock fill dams, etc. Changes in the original engineering properties could put the stability of such structure in jeopardy and make it unsafe during its life of operation. Therefore, under- standing the crushing in granular materials during the process of compression and shearing is of highly needs.
in shear strength of dry sand and the effect of particle breakage angle in the estimation of permeability coeffi- cient for granular material subjected to a one dimensional compression. The results of the tests conducted on Aqaba bay sand will be presented and analyzed.
2. Experimental Program
2.1. Material
The material used for the tests was sand samples col- lected form Aqaba Bay in Jordan. The specific gravity of the sand is 2.63. The particles shapes for the sample are subrounded. In sand natural location particle size and shape reflect material composition, grain formation, transpor tation, and depositional environments. Thus, physical and chemical weathering determines grain shape once it is released from the matrix of parent rocks. From X-ray diffraction analyses, the most dominant mineral in their composition is the quartz with traces of Na-plagio- clase and Anorthoclase, therefore, granite rock is the mother rock of the sample.
2.2. Equipment and Procedures
The natural sand samples were prepared as followed. The sands were rained from specific height to a standard compaction test mold of a size 944 cm3. Thereafter the sand was subjected to one-dimensional compression from a hydraulic Jack to a desire pressure. Grain size distribution analysis was made. Other samples were then subjected to direct shear tests using a standard laboratory shear box apparatus with an initial sample cross-section of 60 mm 40 mm. The sand samples were prepared by sieving a predetermined mass of sand over an open box-shaped metal grid inside the shear box, and then slowly raising the grid. This technique assures that there is no segregation of the particle sizes takes placed during the deposition of sands.
3. Experimental Results
3.1. Imposing Particle Breakage
Sand samples were subjected to different level of one- dimensional compression. Vertical stresses of 0 MPa, 5 MPa, 10 MPa, 15 MPa and 20 MPa were applied to the sand samples. Since the origin of sand was the granitic rocks, the chosen ranges of compressive stress induced on the sample to produce breakage was based on the ranges reported earlier by [6] for grantic’s sand.
The altering of grain size distribution due to one-di- mensional compression is shown in Figure 1. It is obvi-ous that the vertical stresses induced by one-dimen- sional compression increase the amount of fine particles as a sequence of particles breakage increase. AS2 sam-
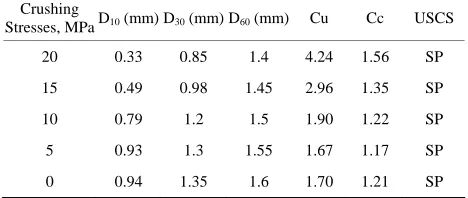
ples were also subjected to the same level pressure. However, the variation of grain size distribution to this level of pressure was diminutive. Table 1 lists the pro- gression of coefficient of uniformity, Cu, coefficient of curvature, Cc, and the classification of the soil samples as a sequence of particle breakage due to the applied ver- tical stress. The data listed in Table 1 clearly indicate the increase of both Cu and Cc. However, the classification and the description of soil samples according to unified soil classification system remain constant as a poorly graded soil.
3.2. Particle Breakage Quantification
Grain size distribution approaches that of a well graded soil for a large compressive loads found by [9] that if uniform sand is crushed. However, before the granular assembly reaches a well graded particle distribution, the granular assembly will experience gradual changes in particle size depending in the level of progressive load being applied.
The index of crushing calculated from the grain size distribution after one dimensional compression through [20] formula given as:
% i f 100i
M M
IC
M
(1)0 10 20 30 40 50 60 70 80 90 100
0.01 0.1 1 10
% F
in
e
r
Dia meter (mm)
0 MPa 5MPa 10 MPa
[image:2.595.312.537.374.568.2]15 MPa 20 MPa
Figure 1. Alteration of grain size after one-dimensional compression.
Table 1. Progression of, Cu, Cc, and the classification of the soil samples.
Crushing
Stresses, MPaD10 (mm) D30 (mm) D60 (mm) Cu Cc USCS
20 0.33 0.85 1.4 4.24 1.56 SP
15 0.49 0.98 1.45 2.96 1.35 SP
10 0.79 1.2 1.5 1.90 1.22 SP
5 0.93 1.3 1.55 1.67 1.17 SP
[image:2.595.306.540.636.735.2]where:
Mi = Initial percent passing sieve size.
Mf = Final percent passing sieve after compression.
The change of passing percentage of each size are shown in Figure 2 for each compression loads. The in-dex of crushing evolution as function of compression stresses is shown in Figure 3. Moreover, the amounts of particles breakage were evaluated from the grain size distribution curves using the method developed by [9]. In this method crushing evaluated by using the particle breakage factor named B10. This parameter is based on the effective size (i.e. D10 and can be obtained from
10 10 10
10
i
i
D D
B
D
f
(2)
in which B10 = particle breakage factor, D10f = effective
grain size of the final gradation, and D10i = effective
grain size of initial gradation. The Progress of particle breakage due to compressive stress is shown in Figure 4.
An alternative definition of particles breakage was proposed also by [21].
Figure 2. Changes of percent finer of samples after one-di- mensional compression.
0 5 10 15 20 25
0 10 20 3
IC
(
%
)
Applied Compression Stress, MPa 0
Figure 3. Evolution of index of crushing as function of compression stresses.
Einav [21] postulates that the grain size distribution will start from and an initial grading and ultimately reach a final grading due to shearing and compression. The relative breakage index, Br, is defined as an area ratio as
t
p
B Br
B
(3)
where Bp, the “breakage potential”, is defined by inte- grating the entire area confined between the initial and final grain size distribution whilst Bt between the current, at given compression stress, and the initial grain size distribution, when there is no applied shear or compres- sion stresses (see Figure 5). The Progress of particle breakage according to Einav (2007) postulate is shown in
Figure 6.
3.3. Influence of Particle Breakage on Shear Strength
The response of stress strain curve at deferent particle breakage factor under normal stress of n = 165 kPa are
shown in Figure 7 whilst Figure 8 shows the volumetric change. It is clearly shown from these figures that parti-cle breakage alter both the peak and residual stress strain response of the samples as well as the response of dila-tion/contraction of the volume of the samples.
0 0 .2 0 .4 0 .6 0 .8 1
0 5 10 15 20 2 5
Compressio n Stresses (MPa)
R
el
at
ive
B
re
aka
ge
I
nd
ex
, B
r
Figure 4. Evolution of The relative breakage index in one dimensional compression.
0 0 .2 0 .4 0 .6 0 .8 1
0 5 10 1 5 20 25
Compression Stresses (MPa)
[image:4.595.58.288.84.273.2]pa rt ic le br ea ka ge f a ct or , B 10 .
Figure 6. Progress of particle breakage due to compressive stress. 0 50 100 150 200 250
0 2 4 6 8 10 12
Hori zontal Displ acem ent (mm )
[image:4.595.57.290.312.465.2]Sh e a r St re s s ( k P a ) 14 B10=0.323 B10=0. 582 B10=0. 645 B10=0.649
Figure 7. Effect of particle breakage on shear stress dis-placement curve (n = 165 kPa).
The shear resistance of pulverized sand comes from interparticle friction and dilation. The two basic parame- ters can be deduced directly from the direct shear box. The direct shear friction angle, can be obtained from the boundary measurements of average horizontal shear stress, xy and the average vertical normal stress σyy by
tan xy yy. The dilation angle, ψ is obtained from
the ratio change of increment of vertical strain yy to
increment of horizontal strain xy as
tan yy xy . Moreover, at large displacement,
the direct shear friction angle reaches a constant value called the residual friction angle; res depend on the
initial density of the sand.
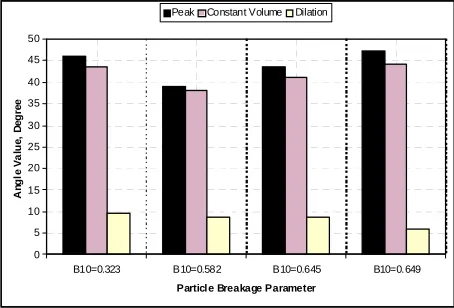
The effects of particle breakage on the peak friction, dilation, and residual angles for sand samples are shown
in Figures 9. The particle breakage was shown higher
effect on residual compared with anther component of the shear resistance component. This is due to the fact that more breakage occur more abrasion to the particle
occur which lead to less asperities of the sand particle, less interlocking and more particle arrangement and rota-tion occur.
3.4. Influence of Particle Breakage on Hydraulic Conductivity
The flow of water in sandy soils can be very significant, since it is important to know the amount of water that will enter the excavation during construction, or the amount of stored water that may be lost by seepage through or beneath a dam. Moreover, the behavior of soil is governed by the intergranular stress, which is the difference between total (overburden) stress and pore water pressure. Therefore, when water flows through the soil pores, the pore water pressures in the ground change. Thus, knowledge of how the pore water pressure changes can be important in considering the stability of earth dams, retaining walls and foundation. Because the pores in soils are so small the flow through most soils is laminar. This laminar flow is governed by Darcy’s Law. Darcy’s law states that the velocity is proportional to hydraulic gradient, the proportion constant called the coefficient of permeability, k, and can easily for sand soil measured by a constant head apparatus. The measured k for different compression strength is shown in Figure 10. It is clearly evident that crushing alters significantly the value of k. Moreover it is well know to relate the coefficient of permeability to effective grain size diameter, D10, as in Hazen (1930) where, k (cm/sec.) = (D10 in mm) or in the US Bureau of Reclamation, where k = 0.36 or in Chapuis (2004) where
2 10 D 2.3 20 D
2 3 3
10 emax max in which e =
current void ratio and emax = maximum void ratio. The predict k also presented in Figure 10. It is obvious from that Hazen formula still predict the measured k better than either US Bureau of Reclamation or Chapuis formula. Furthermore reexamine Figure 2, it’s clearly shown that the most particle breakage occur at diameters
1.5 1 1
k D e e e
0 5 10 15 20 25 30 35 40 45 50
B10=0.323 B10=0.582 B10=0.645 B10=0.649 Particle Breakage Parameter
A n g le V a lu e, D eg ree
Peak Constant Volume Dilation
[image:4.595.309.536.564.718.2]Figure 10. Prediction and measured k for different particle breakage parameters.
between D10 and D20, henceforth all the measured value lies between the two estimates.
4. Conclusion
Particle breakage for natural Aqaba sand was investi- gated experimentally. The natural sand specimens were subjected to one-dimensional compression to induce breakage. The grain size distributions of the specimens were reported before and after the application of the stresses. Thereafter, the sand shear strength parameters were assessed using direct simple shear. Inspection of the residual shear strength parameters, i.e. the residual angle of friction, showed an increase as the amount of particle crushing increasing regardless of the level of the normal stress being applied. Moreover, particles breakages re- duce the coefficient of permeability drastically. Hazen (1930) formula gave the closest prediction of k, compared with other formulas presented in the literature.
REFERENCES
[1] W. Choi, Y. Son, J. Park, S. Noh and T. Bong, “An In-vestigation on Crushing and Particle Size Distribution Characterizes of Bottom Ash as Compaction Energy,” 2013 World of Coal Ash (WOCA) Conference, Lexington, 22-25 April 2013.
http://energy.caer.uky.edu/AshSymposium/AshLibraryAg enda.asp#2013
[2] M. S. Lim, D. C. Wijeyesekera, A. Zainorabidin and I. Bakar, “The Effects of Particle Morphology (Shape and Sizes) Characteristics on its Engineering Behaviour and Sustainable Engineering Performance of Sand,”
Interna-tional Journal of Integrated Engineering, Vol. 4, No. 4 2012, pp. 27-37.
[3] H. Shahnazari and R. Rezvani, “Effective Parameters for the Particle Breakage of Calcareous Sands: An Experi- mental Study,” Engineering Geology, Vol. 159, 2013, pp. 98-105. doi:10.1016/j.enggeo.2013.03.005
[4] A. R. Russell and I. Einav, “Energy Dissipation from
Particulate Systems Undergoing a Single Particle Crush- ing Event,” Granular Matter, Vol. 15, No. 3, 2013, pp 299-314. doi:10.1007/s10035-013-0408-x
[5] G. Marketos and M. D. Bolton, “Quantifying the Extent of Crushing in Granular Materials: A Probability-Based Predictive Method,” Journal of the Mechanics and Phys-
ics of Solids, Vol. 55, No. 10, 2007, pp. 2142-2156. doi:10.1016/j.jmps.2007.03.003
[6] K. L. Lee and I. Farhoomand, “Compressibility and Crushing of Granular Soil in Anisotropic Triaxial Com- pression,” Canadian Geotechnical Journal, Vol. 4, No. 1, 1967, pp. 68-86. doi:10.1139/t67-012
[7] B. O. Hardin, “Crushing of Soil Particles,” ASCE Journal
of Geotechnical Engineering, Vol. 111, No. 10, 1985, pp. 1177-1192.
doi:10.1061/(ASCE)0733-9410(1985)111:10(1177)
[8] M. M. Hagerty, D. R. Hite, C. R. Ulrich and D. J. Hagerty, “One-Dimensional-High Pressure Compression of Gran- ular Media,” ASCE Journal of Geotechnical Engineering, Vol. 119, No. 1, 1993, pp. 1-18.
doi:10.1061/(ASCE)0733-9410(1993)119:1(1)
[9] P. V. Lade, J. A. Yamamuro and P. A. Bopp, “Significance of Particle Crushing in Granular Materials,” ASCE Jour-
nal of Geotechnical Engineering, Vol. 122, No. 4, 1996, pp. 309-316.
doi:10.1061/(ASCE)0733-9410(1996)122:4(309)
[10] G. R. McDowell and M. D. Bolton, “On the Microme- chanics of Crushable Aggregates,” Géotechnique, Vol. 48, No. 5, 1998, pp. 667-679.
doi:10.1680/geot.1998.48.5.667
[11] M. Takei, O. Kusakabe and T. Hayashi, “Time Dependent Behavior of Crushable Materials in One-Dimensional Compression Tests,” Soils and Foundations, Vol. 41, No. 1, 2001, pp. 97-121. doi:10.3208/sandf.41.97
[12] M. R. Coop, K. K. Sorensen, T. Bodas-Freitas and G. Georgoutos, “Particle Breakage during Shearing of a Carbonate Sand,” Géotechnique, Vol. 54, No. 3, 2004, pp. 157-163. doi:10.1680/geot.2004.54.3.157
[13] A. Tarantino and A. F. L. Hyde, “An Experimental Inves- tigation of Work Dissipation in Crushable Materials,”
Géotechnique, Vol. 55, No. 8, 2005, pp. 575-584. doi:10.1680/geot.2005.55.8.575
[14] J. R. Valdes and B. Caban, “Monitoring the Hydraulic Conductivity of Crushing Sands,” Geotechnical Testing
Journal, Vol. 29, No. 4, 2006, pp. 322-329.
[15] D. M. Wood and K. Maeda, “Changing Grading of Soil: Effect on Critical States,” Acta Geotechnica, Vol. 3, No. 1, 2008, pp. 3-14. doi:10.1007/s11440-007-0041-0
[16] Y. Erzin and I. Yilmaz, “Case Study of Crushing Resis- tance of Anatolian Sands at Lower and Higher Density,”
Bulletin of Engineering Geology and the Environment, Vol. 67, No. 1, 2008, pp. 71-77.
doi:10.1007/s10064-007-0111-4
[17] B. Melbouci, R. Bahar and B. Cambou, “Study of the Behaviour of Schist Grains under Crushing,” Bulletin of
Engineering Geology and the Environment, Vol. 67, No. 2, 2008, pp. 209-218. doi:10.1007/s10064-008-0125-6
Géotechnique, Vol. 36, No. 1, 1986, pp. 65-78. doi:10.1680/geot.1986.36.1.65
[19] J. Feda, “Notes on the Effect of Grain Crushing on the Granular Soil Behavior,” Engineering Geology, Vol. 63, No. 1-2, 2002, pp. 93-98.
doi:10.1016/S0013-7952(01)00072-2
[20] F. A. Shergold, “A Study of the Crushing and Wear of Surface-Dressing Chippings under Rolling and Light
Traffic,” Research Note No. RN/2298/FAS.B.P, 1954, p. 397.
http://www16.us.archive.org/stream/aggregatedegrada00 moav/aggregatedegrada00moav_djvu.txt
[21] I. Einav, “Breakage Mechanics—Part I: Theory,” Journal