Munich Personal RePEc Archive
The Global Financial Crisis and Indian
Banks: Survival of the Fittest?
Eichengreen, Barry and Gupta, Poonam
University of California, Berkeley, National Institute of Public
Finance and Policy, Delhi
December 2012
Online at
https://mpra.ub.uni-muenchen.de/43365/
1
The Global Financial Crisis and Indian Banks: Survival of the Fittest?
Barry Eichengreen and Poonam Gupta1
December, 2012
Abstract
The Indian banking system was initially thought to be insulated from the global financial crisis owing to heavy public ownership and cautious management. It was thus a surprise when some banks experienced a deposit flight, as depositors shifted their money toward government-owned banks and specifically toward the State Bank of India, the largest public bank. While there was some tendency for depositors to favour healthier banks and the banks with more stable funding, the reallocation of deposits toward the State Bank of India in particular cannot be explained by these factors alone. Nor can it be explained by the impact of explicit capital injections by the government into some public-sector banks. Rather it appears that the implicit guarantee of the liabilities of the
country’s largest public bank dominated other considerations.
Keywords: State-owned banks; banking and financial crises
JEL Classification: G01, G20,G21, G28
1
University of California, Berkeley and National Institute of Public Finance and Policy, Delhi, respectively. We thank
Honey Karun for excellent research assistance. Comments are welcome at eichengr@econ.berkeley.edu and
2
1. Introduction
The Indian banking system was initially believed to be insulated from the global financial
crisis owing to heavy public ownership and conservative management. To the surprise of observers,
however, Indian banks, private banks in particular, experienced a sharp increase in interbank
borrowing rates and deposit flight starting in mid-2008. In the case of the largest private bank,
ICICI, deposits dropped by a tenth between June and December, as depositors shifted their money
to government owned and operated banks. Public banks, led by the State Bank of India (SBI),
meanwhile posted significantly faster deposit growth than the system as a whole (Figures 1 and 2).2
We ask two sets of questions about this episode. First, which banks experienced the largest
deposit withdrawals and why? Did the reallocation of deposits depend on the health of individual
banks, as measured by publicly available indicators such as capital ratios, the quality of balance
sheets, and lending growth prior to the crisis? Or was it a function of public versus private
ownership pure and simple? Did deposits move to all public banks or only to select public financial
institutions? Did public banks attract depositors because they enjoyed an explicit government
guarantee, which was manifested by the public injection of bank capital where necessary, or
because they enjoyed an implicit guarantee, reflecting the understanding that the government would
not allow a public sector bank to fail?3
2
Apparently this shift to (perceived to be) safer public sector banks is not unique to India and has happened in other emerging markets as well as the advanced economies. Bertay et al (2012) report that in high income countries the share of government ownership in banking assets increased from 7.3 percent in 2007 to 10.8 percent in 2009 (though retreated to 9.9 percent in 2010).
3
3
Figure 1: Share in Assets across Ownership Groups
Figure 2: Deposit Growth (average annual) across ownership Groups
Note: Source for data in Figures 1 and 2 is the Statistical Tables Relating to Banks in India, Various issues, RBI. Years refer to fiscal years, e.g. 2009 refers to FY 2008-09 which runs from April 2008 to March 2009.
Our analysis confirms that private banks indeed experienced slower deposit growth during
and after the crisis than before; and that this differential was most pronounced in FY 2009 and
0 10 20 30 40 50 60 70 80 90 100 0 10 20 30 40 50 60 70 80 90 100
1993 1994 1995 1996 1997 1998 1999 2000 2001 2002 2003 2004 2005 2006 2007 2008 2009 2010 2011
Public Foreign Private
12.89 18.65 27.99 21.90 30.13 25.34 9.09 11.99 10.03 22.71 11.74 8.42 0 5 10 15 20 25 30 35
SBI a nd a ssocia tes other PSBs Priva te Ba nks Foreign Ba nks
(i
n
%)
Banks Deposits Growth
[image:4.612.147.515.361.595.2]4
2010. Public banks, in contrast, did not experience a similar slowdown in deposit growth, and the
largest and oldest public bank, the SBI, experienced especially rapid growth in deposits.4
We consider several explanations for the differential response, including the source of
funding, i.e. whether banks that relied more on wholesale funding experienced a sharper deposit
slowdown; credit growth prior to the crisis, which may have been an indication of low or declining
lending standards; lower realized profitability, as a measure of bank health; bank size, as a proxy
for capacity to diversify and too big to fail; and explicit capital support by the government.5
While there was some tendency for depositors to favour healthy banks with stable funding,
our results suggest that the reallocation of deposits toward the SBI, in particular, cannot be
explained by these factors alone. Nor can it be explained by explicit capital injections by the
government. It seems that depositors were confident for other reasons that their deposits were safer
with the SBI due to the government’s implicit guarantee of its liabilities, and that this dominated
other considerations.6
The consequences of this behaviour are unlikely to be desirable. Insofar as investors flee to
the SBI in the belief that it enjoys an implicit government guarantee, other banks will be
destabilized. Other banks will have to hold more capital and maintain more liquidity to reassure
depositors, which will work to their competitive disadvantage, and it is not clear in extreme
circumstances that any level of capital and liquidity will suffice.7 In addition, the perception that
public-sector banks, and larger public-sector banks especially, enjoy an implicit guarantee is a
4
Besides deposits we also look at credit growth, return on assets or capital ratio of the banks but do not find the relative effect of the crisis to be as sharp across banks under different ownership patterns.
5
We enter these variables in three ways: their historic (2004) values; their average values in three years prior to the crisis; and their values in the current and most recent year.
6
In addition, there is the fact that the SBI has the largest network of bank branches, which may make it relatively easy for depositors to shift their funds there, as opposed to other public banks, when time is of the essence.
7
5
moral hazard that limits the incentive to enhance efficiency and may encourage excessive risk
taking.
Extending the state guarantee from public to private sector banks would address the first
problem (flight from private banks) but aggravate the second (moral hazard). Blanket guarantees
are also expensive for the state. Efforts to reduce the implicit guarantee enjoyed by public-sector
banks, on the other hand, may not be credible and may have undesirable consequences for financial
stability. The best ways of squaring the circle are by preventing institutions from becoming too
large and connected to fail in the first place, requiring generation of the kind of data that enables the
authorities to clearly distinguish cases of insolvency from cases of illiquidity, and setting up
mechanisms for the orderly resolution of insolvent institutions (Demirguc-Kunt and Serven 2009).
Our second set of questions asks how different banks fared during the recovery from the
crisis. Did the same banks that did poorly when uncertainty spiked do well when it receded, or is
comparative performance during the recovery phase attributable to other factors? We compare the
behaviour of indicators of bank performance in the run-up to the crisis, during the crisis itself, and
in the subsequent recovery. To the extent that performance in the recovery differed across banks,
we ask how it is related to bank characteristics such as size, asset composition, ownership, capital
ratios, and source of funding.8
Our results show that the superior performance of public-sector banks did not last. Public
banks, including the SBI, experienced slower deposit growth after 2010. In particular, banks that
received capital injections in 2009 or 2010 had slower deposit growth. Public banks also
experienced slower credit growth, lower returns, and higher provisioning. These results hold after
8
6
controlling for the pace of credit growth during the crisis as well as for other bank-specific
indicators such as bank size, profitability and provisioning prior to the crisis.
The only previous attempt to provide such an analysis of the effect of the crisis on the
Indian banking system, of which we are aware, is Acharya, Agarwal and Kulkarni (2012). They
show that while Indian financial firms were fairly resilient to the crisis, private banks experienced
larger losses. Using a stock market-based measure of systemic risk, they estimate the systemic risk
contributed by each Indian bank in the period preceding the crisis (January 2007 to December
2007) and compare it to realized returns during the crisis (January 2008 to February 2009). They
find that public banks outperformed private banks during the crisis. They attribute this result to
explicit government support of public-sector banks.9 Our approach differs in that we consider a
wider variety of bank characteristics and utilize information on not just the pre-crisis and crisis
periods but also on the post-crisis recovery.
2. The Banking Sector
At independence, the Indian banking system consisted mainly of private and foreign banks.
The government took control of the larger banks in 1955, 1969, and 1982. By 1982 private and
foreign banks accounted for less than 10 per cent of bank assets.
Until the early 1990s, banks were subject to strict limits on asset allocation, interest rate
ceilings and entry barriers. Half of bank assets were channelled into cash, deposits with the central
bank, and investments in government securities. This was done through the Cash Reserve
Requirements (CRR), which required the banks to hold cash and other liquid assets, and the
Statutory Liquidity Requirements (SLR), which required them to hold safe and liquid assets, mostly
9
7
securities of central government and other approved securities such as state development loans of
the state governments.10
Financial reforms were initiated in 1991 and deepened in the mid-1990s. This entailed
removing controls on interest rates, reducing reserve and liquidity ratios, deregulating entry,
relaxing credit controls, creating an inter-bank money market, and introducing auction-based
repurchase agreements and reverse repos.
With data on financial reforms in 91 countries from Abiad, Detragiache and Tressel (2010),
we can compare the pace of financial liberalization in India with other countries. Abiad et al.
consider credit controls, reserve requirements, interest rate controls, entry barriers, policies on
securities markets, bank regulation, and restrictions on capital account, aggregating measures of
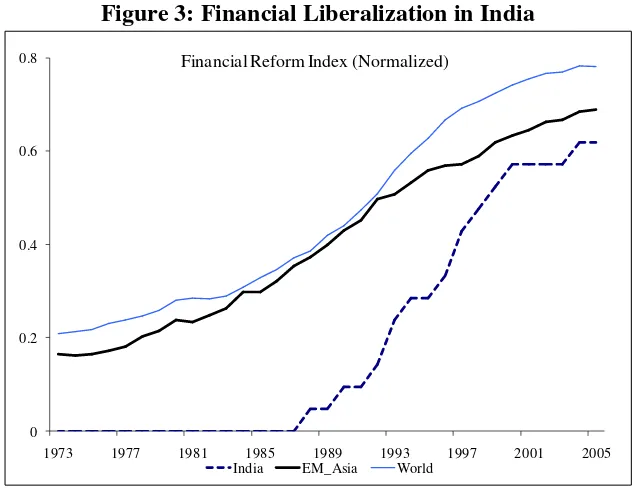
these elements into a composite index of financial liberalization.11 In Figure 3 we see that,
compared with both emerging Asian economies and other countries, India’s financial sector was
repressed until the late 1980s. Liberalization then gathered pace, and catch-up has been fast since
the mid-1990s.
Reform and liberalization had effects. With the easing of barriers to entry by private and
foreign banks, their share in total banking sector assets rose from 3.5 percent in 1991 to about 21
per cent in 2007. Still, compared to many other countries the Indian banking sector remained
predominantly under government ownership, with 70 per cent of assets of the banking sector in the
10
CRR is defined as percentage of a bank's net demand and time liabilities and has varied between 5 and 15 percent since 1990. Under the SLR, scheduled commercial banks are required to maintain an amount between 25 to 40 percent of demand and time liabilities in cash, gold, or unencumbered approved government securities. See Gupta et al (2011) on how public and private banks have responded to changes in these requirements.
11
8
hands of public banks.12 The share of public banks then increased further during and after the crisis,
[image:9.612.154.474.128.373.2]reversing the declining trend of the previous many years (see Table 1).
Figure 3: Financial Liberalization in India
Source: Constructed using the data from Abiad, Detragiache, and Tressel (2008)
Table 1: Number of Banks and the Share of Banks in Total Assets, by Ownership Groups
Bank Type No of Banks Percent Share in
Assets
No of Banks Percent Share
in Assets
2007 2011
All Public Sector Banks 28 70.5 26 73.7
State Bank of India 8 23.3 6 22.2
Other Public Sector Banks 20 47.2 20 51.5
Private Banks 25 21.5 21 19.5
Foreign Banks 29 8.0 34 6.8
Source: Statistical Tables Relating to Banks in India, various issues, RBI; years 2007 and 2011 refer to FY 2006-07 and 2010-11 respectively.
12
Due to the entry of new banks, the number of private sector banks first increased in the mid-1990s, but since then the number has declined due to mergers or closures. The number of foreign banks also increased steadily through the 1980s, and mid 1990s, and then declined. The total number of banks peaked at 105 in the mid-1990s, but by 2007 the number had declined to 82, which was only marginally higher than their number in the early 1990s when the
liberalization had started.
0 0.2 0.4 0.6 0.8
1973 1977 1981 1985 1989 1993 1997 2001 2005
Financial Reform Index (Normalized)
[image:9.612.70.572.437.603.2]9
Due to entry and the increase in the share of private institutions, concentration has declined
since the early 1990s. Figure 4 shows a Herfindhal Index based on the shares in assets for domestic
banks. It suggests a gradual decline in concentration from the late 1980s, followed by a sharp
decline after the turn of the century. Although the crisis raised concentration by increasing the
[image:10.612.169.490.247.482.2]share of the larger public banks in banking assets, that rise was not pronounced.
Figure 4: Herfindahl Index for the Banking Sector
There are indications that increased competition has been associated with improvements in
efficiency and profitability, especially among public banks. Having had significantly lower
operating profits and lower returns on assets in the early 1990s, public-sector banks caught up with
their private sector competitors by these metrics by 2007 (Table 2).
.0
0
6
5
.0
0
7
.0
0
7
5
.0
0
8
2002 2004 2006 2008 2010 2012
10
Table 2: Trends in Credit, Deposits and other Indicators for Public and Private Banks
1993 2000 2007
Public Private Public Public Public Private
Credit/assets 20.8* 24.98 18.5*** 25.2 27.2*** 32.1
Deposit Growth 8.4*** 14.4 12.3** 20.8 17.7 15.2
Capital/Assets 2.05** .74 1.81*** .91 .97 .98
Return on Assets -2.42*** .40 .42** .88 .86 .85
Provision/Assets 2.07*** .82 .95 1.03 .95 .98
Note: The numbers represent simple means of variables for bank groups. *, **, *** denote if the average of the public banks is significantly different from the average of the private banks at 10, 5, and 1 percent levels respectively.
3. Data, Methodology and Results
In the analysis that follows, we use annual bank-level data for the period 2004-2012 from
Reserve Bank of India (2012). These data are for fiscal years: 2008 refers to fiscal year 2007-08,
which runs from April 2007 to March 2008, for example. We consider only banks that existed
throughout the period. We have data for 44 private and public banks. Of these 25 are public sector
banks, including the SBI. Five additional banks are associated with the SBI. In addition there are19
other public sector banks and 19 are private banks.13
We use data on deposit growth (i.e. total deposits which include current, saving and term
deposits), as the dependent variable in our baseline regressions. In addition we report regressions
where asset growth, credit growth, return on assets, and capital are the dependent variables. As
controls we include profitability (return on assets), indicators of asset quality (loan loss provisions
13
11
and capital ratio), funding source (share of saving and current account deposits in total liabilities)
and size (log of assets) of the banks. We regress deposit growth on dummies for the crisis years, a
public-bank dummy interacted with the dummy variables for the crisis years, a vector of bank
characteristics, and the interaction of those bank characteristics with the crisis-year dummies.
(1)
where subscripts i and t refer to bank and year respectively. We include bank fixed effects and
report robust standard errors. In addition we include separate interaction effects for the SBI, which
media report suggest attracted especially large deposit inflows. The coefficients of the dummies for
2008, 2009, and 2010 capture the change in deposit growth for private banks relative to pre-crisis
years 2004-2007.14 The coefficients of the interaction between year dummies and ownership
dummies are “difference in difference” estimates measuring the change in deposit growth for public
banks in the respective crisis year over the pre crisis years, relative to the change experienced by the
control group, i.e. the private banks. Thus the coefficient on “Year 2008*Public Banks” estimates
the change in deposits growth for public banks in 2008 over their average growth in 2004-2007
minus the change in deposits growth for private banks in 2008 over average deposit growth in
2004-2007.
We estimate extensions of the specification in equation 1 by including bank characteristics
and their interactions with year dummies, as in equation 2 below.
(2)
14
12
In addition, to test whether explicit guarantees mattered more than ownership per se we
include capital injected in the banks before and during the crisis year to ask whether the coefficient
of public sector banks becomes smaller or insignificant.
The resulting estimates should help us to address questions such as: What was the effect on
deposit growth of the crisis? Did public-sector banks experience faster deposit growth? Is the
deposit slowdown correlated with ownership or other bank characteristics? Did funding affect the
deposit response? Did capital injections affect depositors’ confidence in a bank? How did private
banks do in terms of credit growth, return, provisioning, and investment in government securities?
In extensions we estimate similar regressions for other dependent variables such as credit growth;
credit over assets and return on assets?
In column 1 of Table 2 we club together all public banks in one dummy, while in column 2
we separate the SBI from the other public banks. In column 3 we include the dummies for SBI and
other public banks and drop the bank fixed effects, estimating the regressions using the random
effects rather. In column 4, finally, we include the interaction of the dummy for 2011 with dummies
for the SBI and other public banks.
The effect of the crisis on deposits is evident in 2009 and 2010. The results confirm that the
private banks experienced slower deposit growth (note the negative coefficients on the year dummy
variables for 2009 and 2010). The effect on deposit growth for public banks appears to have been
positive, although the coefficients do not differ significantly from zero. In contrast, the effect is
positive, large and significant for the SBI, although this effect is not evident in 2011.
These estimates lend some support to the view that depositors discriminate between
13
with lower provisioning display faster deposit growth (Table 3). But even when we include these
variables, individually or together, the coefficient for the SBI remains positive and significant in
2008 and 2009, while the coefficients on the year dummies remain negative and significant, except
when we include size. Even then, however, the faster deposit growth experienced by the SBI cannot
14
Table 2: Change in Bank Deposits
(Dependent variable: Percent Change in Real Deposits)
(1) (2) (3) (4)
Dummy, Year 2008 1.47 1.47 1.47 1.47
[0.42] [0.41] [0.44] [0.42]
Dummy, Year 2009 -7.00* -7.00* -7.00* -7.00*
[1.70] [1.69] [1.82] [1.70]
Dummy, Year 2010 -7.52* -7.52* -7.52** -7.52*
[1.86] [1.85] [1.99] [1.86]
Dummy, Year 2011 0.20
[0.05]
Dummy for State Bank of India -8.16***
[3.59]
Dummy for all other Public Banks -0.65
[0.27]
Year 2008*Public banks, State Bank of India -0.89
[0.23]
Year 2009*Public banks, State Bank of India 5.07
[1.12]
Year 2010*Public banks, State Bank of India 4.23
[0.93]
Year 2008*Public Banks -1.21 -1.21 -1.21
[0.31] [0.33] [0.31]
Year 2009*Public Banks 4.25 4.25 4.25
[0.94] [1.01] [0.95]
Year 2010*Public Banks 4.38 4.38 4.38
[0.95] [1.02] [0.95]
Year 2011*Public Banks -4.69
[-1.01]
Year 2008*State Bank of India 6.77* 6.77** 6.77*
[1.90] [2.05] [1.92]
Year 2009*State Bank of India 24.89*** 24.89*** 24.89***
[5.99] [6.46] [6.04]
Year 2010*State Bank of India 0.70 0.70 0.70
[0.17] [0.19] [0.17]
Year 2011*State Bank of India 0.03
[0.01]
Bank Fixed Effects Yes Yes No Yes
Observations 308 308 308 351
R-squared 0.25 0.26 0.25
Number of banks 44 44 44 44
15
Table 3: Change in Bank Deposits, Including other Controls (Dependent variable: Percent change in Real Deposits)
(1) (2) (3) (4) (5) (6) (7)
Year 2008 1.51 0.18 1.32 0.59 6.13** 1.47 3.85
[0.44] [0.06] [0.37] [0.16] [2.14] [0.41] [1.52]
Year 2009 -7.39* -7.88* -7.06* -8.15* 0.04 -7.00* -2.28
[1.74] [1.86] [1.69] [1.78] [0.01] [1.68] [0.72]
Year 2010 -7.84* -7.37* -7.57* -8.07** 0.30 -7.52* 0.12
[1.94] [1.72] [1.86] [2.03] [0.09] [1.85] [0.04]
Year 2008*Public Banks -1.03 0.81 -0.86 -1.63 -0.95 -1.21 1.14
[0.27] [0.24] [0.22] [0.43] [0.26] [0.31] [0.36]
Year 2009*Public Banks 4.80 7.13 4.57 3.49 4.21 4.25 7.18*
[1.05] [1.60] [0.97] [0.83] [0.99] [0.94] [1.74]
Year 2010*Public Banks 4.88 7.46 4.71 3.35 4.86 4.56 7.45*
[1.06] [1.65] [0.99] [0.77] [1.08] [0.96] [1.71]
Year 2008*State Bank of India 7.00** 5.11 6.92* 6.42* 4.36 6.77* 1.97
[2.02] [1.32] [1.94] [1.86] [1.46] [1.90] [0.63]
Year 2009*State Bank of India 25.14*** 24.30*** 24.96*** 24.59*** 22.66*** 24.89*** 21.62***
[5.92] [5.70] [5.96] [6.22] [6.44] [5.98] [6.43]
Year 2010*State Bank of India 0.84 0.97 0.76 -0.12 0.54 0.70 -0.09
[0.21] [0.23] [0.19] [0.03] [0.14] [0.17] [0.02]
Return on Assets, Lag 3.16** 2.75*
[2.14] [1.74]
Current+Sav Deposits/Liabilities,
Lag 0.64* 0.76**
[1.97] [2.39]
Capital/Assets, Lag 0.35 0.07
[0.58] [0.22]
Provisioning/Assets, Lag -2.91 -3.85
[1.38] [1.59]
Size, Log Assets, Lag -16.46*** -17.85***
[3.25] [3.04]
Capital Support/Assets, Lag -2.09 2.94
[0.28] [0.37]
Bank Fixed Effects Yes Yes Yes Yes Yes Yes Yes
Observations 308 308 308 308 308 308 308
R-squared 0.28 0.29 0.27 0.28 0.31 0.27 0.38
Number of Banks 44 44 44 44 44 44 44
Notes: The dependent variable is percent change in deposits (deflated by CPI). Regression specification is given in equations 1 and 2. Data are for the period 2004-2010. Regressions include bank fixed effects. Standard errors are robust and clustered by banks.
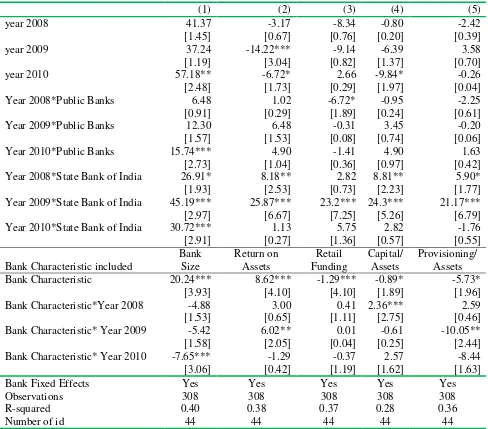
Table 4 interacts contemporaneous values of the bank-specific variables with the dummies
for 2008, 2009 and 2010 to see whether public ownership is simply acting as a proxy for these other
bank characteristics. The coefficients for 2008, 2009 and 2010, while still negative, become
16
still positive and mostly significant, however. Deposit growth during the crisis years is slower for
larger banks and for banks with more provisioning (i.e. poorer asset quality). Deposit growth during
the crisis is also faster for banks with higher profitability and more capital. These results suggest
that even if depositors did discriminate in favor of stronger private banks, they had even more trust
[image:17.612.72.560.242.671.2]in the resilience of the SBI.
Table 4: Change in Bank Deposits across Ownership Groups (Including other Controls) (Dependent variable: Percent change in Real Deposits
(1) (2) (3) (4) (5)
year 2008 41.37 -3.17 -8.34 -0.80 -2.42
[1.45] [0.67] [0.76] [0.20] [0.39]
year 2009 37.24 -14.22*** -9.14 -6.39 3.58
[1.19] [3.04] [0.82] [1.37] [0.70]
year 2010 57.18** -6.72* 2.66 -9.84* -0.26
[2.48] [1.73] [0.29] [1.97] [0.04]
Year 2008*Public Banks 6.48 1.02 -6.72* -0.95 -2.25
[0.91] [0.29] [1.89] [0.24] [0.61]
Year 2009*Public Banks 12.30 6.48 -0.31 3.45 -0.20
[1.57] [1.53] [0.08] [0.74] [0.06]
Year 2010*Public Banks 15.74*** 4.90 -1.41 4.90 1.63
[2.73] [1.04] [0.36] [0.97] [0.42]
Year 2008*State Bank of India 26.91* 8.18** 2.82 8.81** 5.90*
[1.93] [2.53] [0.73] [2.23] [1.77]
Year 2009*State Bank of India 45.19*** 25.87*** 23.2*** 24.3*** 21.17***
[2.97] [6.67] [7.25] [5.26] [6.79]
Year 2010*State Bank of India 30.72*** 1.13 5.75 2.82 -1.76
[2.91] [0.27] [1.36] [0.57] [0.55]
Bank Characteristic included
Bank Size Return on Assets Retail Funding Capital/ Assets Provisioning/ Assets
Bank Characteristic 20.24*** 8.62*** -1.29*** -0.89* -5.73*
[3.93] [4.10] [4.10] [1.89] [1.96]
Bank Characteristic*Year 2008 -4.88 3.00 0.41 2.36*** 2.59
[1.53] [0.65] [1.11] [2.75] [0.46]
Bank Characteristic* Year 2009 -5.42 6.02** 0.01 -0.61 -10.05**
[1.58] [2.05] [0.04] [0.25] [2.44]
Bank Characteristic* Year 2010 -7.65*** -1.29 -0.37 2.57 -8.44
[3.06] [0.42] [1.19] [1.62] [1.63]
Bank Fixed Effects Yes Yes Yes Yes Yes
Observations 308 308 308 308 308
R-squared 0.40 0.38 0.37 0.28 0.36
Number of id 44 44 44 44 44
17
Since the coefficients on contemporaneous bank characteristics may be subject to
endogeneity bias, we also take 2004 values of these variables and interact them with the dummies
for the crisis years. Alternatively, we take averages of these variables for the three years before the
crisis (2005-07) and interact them with the dummies for 2008, 2009 and 2010. 15 The results are
similar to those in Table 4 above in that after controlling for the banks’s size and health at their
historical value or the values prior to the crisis the coefficient of the SBI is positive, large and
significant.16 This suggests that trust in the safety of deposits at the SBI was not rooted in these
factors but instead stemmed from the broader implications of public ownership.
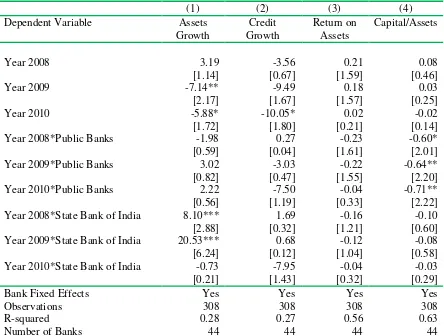
We can also analyze asset growth, credit growth, return on assets and capital held by the
banks using this framework. As shown in Table 5, credit growth does not differ as much across
banks; in particular the credit growth of the SBI is not unusually large during the crisis (column
2).17 The return on assets, in column 3, is not lower during the crisis across banks, and again
differences are not large across ownership groups. Interestingly the largest hit on capital during the
crisis appears to have been taken by public banks other than the SBI.
15
When we include credit growth before the crisis in our regression, we also find that banks increasing credit more aggressively in three years prior to the crisis experienced slower deposit growth during the crisis.
16
Results available on request.
17
18
Table 5: Credit Growth, Returns and Capital during Crisis across ownership Groups
(1) (2) (3) (4)
Dependent Variable Assets
Growth
Credit Growth
Return on Assets
Capital/Assets
Year 2008 3.19 -3.56 0.21 0.08
[1.14] [0.67] [1.59] [0.46]
Year 2009 -7.14** -9.49 0.18 0.03
[2.17] [1.67] [1.57] [0.25]
Year 2010 -5.88* -10.05* 0.02 -0.02
[1.72] [1.80] [0.21] [0.14]
Year 2008*Public Banks -1.98 0.27 -0.23 -0.60*
[0.59] [0.04] [1.61] [2.01]
Year 2009*Public Banks 3.02 -3.03 -0.22 -0.64**
[0.82] [0.47] [1.55] [2.20]
Year 2010*Public Banks 2.22 -7.50 -0.04 -0.71**
[0.56] [1.19] [0.33] [2.22]
Year 2008*State Bank of India 8.10*** 1.69 -0.16 -0.10
[2.88] [0.32] [1.21] [0.60]
Year 2009*State Bank of India 20.53*** 0.68 -0.12 -0.08
[6.24] [0.12] [1.04] [0.58]
Year 2010*State Bank of India -0.73 -7.95 -0.04 -0.03
[0.21] [1.43] [0.32] [0.29]
Bank Fixed Effects Yes Yes Yes Yes
Observations 308 308 308 308
R-squared 0.28 0.27 0.56 0.63
Number of Banks 44 44 44 44
Notes: The dependent variables are as indicated in each column; growth of assets and credit, columns 1 and 2 respectively is calculated after deflating by CPI. Data are from 2004-2010. Regressions include bank fixed effects. Standard errors are robust and clustered by banks.
4. After the Crisis
We have data for two post-crisis years, 2011 and 2012. We use it to analyse whether or not
the same banks that did relatively poorly when uncertainty spiked then did relatively well when it
receded. Or did banks which extended more credit during the crisis experience a deterioration
subsequently in asset quality? More generally, to the extent that recovery-period performance
differed across banks, we ask how it is related to various banks indicators, such as size,
19
We estimate regressions for deposit growth, credit allocation, return on assets and provisions using
the pooled data for 2011 and 2012, controlling for the values of these variables during the crisis and
pre crisis years and controlling for various bank characteristics, as per the specification in equation
3.18
(3)
Results show that public-sector banks and the SBI in particular experienced slower deposit
growth after controlling for the growth in preceding years (Table 6). In addition, banks that received
capital injections in 2009 and 2010 had slower deposit growth. Public-sector banks also had slower
credit growth, after controlling for credit growth during the crisis and prior to the crisis and for bank
size, profitability and provisioning. Finally, public-sector banks and the SBI also had lower returns
and higher provisioning (Table 7).
18
20
Table 6: Deposit Growth and Credit Growth in 2011, 2012
(1) (2) (3) (4) (5) (6)
Dependent Variable Deposits Growth Credit Growth
Dummy for all other PSB -4.15* -4.00* -4.43* -3.82 -4.27 -4.42
[1.79] [1.68] [1.79] [1.29] [1.29] [1.40]
Dummy for the SBI -7.25* -8.15 -8.89 -11.45*** -11.56*** -11.91***
[1.80] [1.50] [1.64] [3.87] [3.80] [3.99]
Avg. Change in Deposits in 2005-07 -0.03 0.01 -0.01
[0.22] [0.04] [0.12]
Avg. Change in Deposits in 2009-10 0.29 0.23 0.09
[0.83] [1.13] [0.36]
Capital Injection in 2009, 2010 -5.54** -5.73***
[2.54] [2.79]
Avg. Size in 2009, 2010 0.01 0.13
[0.01] [0.10]
Avg. Return in 2009, 2010 -0.88
[0.21]
Avg. Provision in 2009, 2010 -1.80
[0.61]
Credit Growth (2005-07) -0.12 -0.09 -0.09
[0.60] [0.49] [0.51]
Credit Growth (2009-10) 0.12 0.08
[0.52] [0.23]
Constant 8.24*** 6.61 7.30 17.61*** 15.82*** 15.83***
[2.72] [0.53] [0.54] [3.22] [3.98] [3.93]
Observations 82 82 82 82 82 82
R-squared 0.052 0.135 0.137 0.048 0.059 0.060
21
Table 7: Return on Assets and Provisioning in 2011, 2012
(1) (2) (3) (4) (5) (6) (7)
Return on Assets Provisions
Dummy for all other PSB -.22*** -.29*** -.21*** 0.23*** 0.12 0.13* 0.24***
[3.22] [5.31] [2.66] [3.93] [1.44] [1.75] [4.31]
Dummy for the SBI -.30*** -.56*** -.41*** 0.70*** 0.45** 0.46*** 0.72***
[3.10] [3.97] [2.89] [10.80] [2.62] [2.94] [11.51]
Avg. Return on Assets in 2005-07 0.12 0.12 0.02
[0.76] [0.78] [0.17]
Avg. Return on Assets, in 2009-10 0.42** 0.34* 0.56***
[2.44] [1.83] [4.00]
Capital Injection in 2009, 2010 -0.21** -0.14 -0.04 -0.03
[2.59] [1.47] [0.43] [0.36]
Avg. Size in 2009-10 0.07* 0.03 0.06 0.06
[1.79] [1.15] [1.48] [1.62]
Credit Growth in 2009-10 -0.01** 0.00 0.00
[1.99] [1.19] [1.12]
Avg. Provision in 2005-7 -0.13 -0.13 -0.23*
[1.18] [1.21] [1.92]
Avg. Provision in 2009, 2010 0.31** 0.38*** 0.45***
[2.15] [2.86] [3.96]
Observations 81 81 81 81 81 81 81
R-squared 0.455 0.498 0.586 0.330 0.357 0.380 0.351
Note: *, **, *** indicate that the coefficients are significant at 10, 5 and 1 percent levels respectively. Standard errors are robust.
Figures 5-7 confirm the results we obtain from the regressions. After the crisis the return on
assets declined for public-sector banks, and especially for the SBI, while increasing for private
banks. Similarly, asset quality deteriorated starting in FY 2010 for the public-sector banks, while
22
Figure 5: Return on Assets
Figure 6: Non Performing Loans/Assets
0.00 0.20 0.40 0.60 0.80 1.00 1.20 1.40 1.60 1.80 2005 -06 2006 -07 2007 -08 2008 -09 2009 -10 2010 -11 2011 -12
Public Sector Ba nks SBI & Associa tes Priva te Sector
0.00 0.50 1.00 1.50 2.00 2.50 3.00 2005 -06 2006 -07 2007 -08 2008 -09 2009 -10 2010 -11 2011 -12
[image:23.612.149.480.367.607.2]23
Figure 7: Credit Growth
Note: Source for data in Figures 5-7 is the Statistical Tables Relating to Banks in India, various issues, RBI; years refer to fiscal years.
So far we have focused only on domestic private and public banks. Excluding foreign banks
is justified insofar as their share in banking assets is small. But we can add foreign banks to see
whether the dynamics of deposits and other variables differed for them.We do this by including
three additional variables, the interactions of the dummies for years 2008, 2009, and 2010 with the
dummy for foreign banks in our specification in equations 1 and 2. We include these variables in
the regressions for deposit growth as well as for credit growth.
When we do so, the coefficients for these additional variables turn to be negative,
numerically large, but statistically insignificant. This implies that the deposit reallocation from the
foreign banks was statistically as sharp as from the domestic private banks; and the credit growth
slowdown from the foreign banks was also comparable to that of the Indian private banks.19 The
19
IMF in its most recent Global Stability Report says that the Indian banking system escaped the worst effects of the
global crisis because of the limited presence of foreign banks, which tended to react most violently by restricting credit.
0 5 10 15 20 25 30 35 40 45 2005 -06 2006 -07 2007 -08 2008 -09 2009 -10 2010 -11 2011 -12 (i n % ) Credit Growth
24
results also point to considerable variation across foreign banks in rates of deposit and credit
growth.20
5. Conclusion
In this paper we have considered the reallocation of flight of deposits from private- to
public-sector banks in India following the onset of the global financial crisis. This deposit
reallocation was a surprise to many commentators, who had regarded private-sector banks as sound
and cautiously managed. Our analysis suggests that the flight of deposits was predominantly in the
direction of the largest and best-known of the public banks, the State Bank of India, rather than
toward public-sector banks as a whole. The pattern cannot be explained by obvious balance-sheet
variables such as credit growth prior to the crisis, lower realized profitability, or explicit capital
support by the government. Similarly, there is no sign of superior stability or returns for public
banks in general and the State Bank of India in particular in the recovery period following the crisis.
Other factors therefore presumably motivated the shift of deposits toward the SBI. The most
plausible such factor is the expectation of an implicit guarantee for the oldest and best known
public-sector institution.
To the extent that investors fled toward the SBI in the belief that it enjoyed an implicit
government guarantee, other banks were destabilized. The effects on the efficiency of the financial
system would not have been positive insofar as other banks were forced to hold more capital and
maintain more liquidity to reassure depositors. The perception that public-sector banks, and larger
public-sector banks especially, enjoy an implicit guarantee is a moral hazard that limits the
incentive to enhance efficiency and may encourage excessive risk taking. This points to the
20
25
desirability of scaling back implicit guarantees to the SBI and public-sector banks in general,
whether by preventing them from becoming too large and connected to fail or by setting up more
26
References:
Acharya, Viral V., Anukaran Agarwal and Nirupama Kulkarni (2010), “State Ownership and Systemic Risk: Evidence from the Indian Financial Sector during 2007-09.”
Aziz J, I. Patnaik I, and A. Shah (2008), “The Current Liquidity Crunch in India: Diagnosis and Policy Response," Technical Report, NIPFP DEA Research Program.
Bertay, AC, A. Demirgüç-Kunt, and H. Huizinga (2012), “Bank Ownership and Credit over the Business Cycle: Is Lending by State Banks Less Procyclical?” World Bank, Policy Research Working Paper 6110.
Carvalho, Daniel R. (2010), “The Real Effects of Government-Owned Banks: Evidence from an Emerging Market,” SSRN.1717294.
Chava, Sudheer and Amiyatosh Purnanandam (2011), “The Effect of Banking Crisis on Bank‐Dependent Borrowers,” Journal of Financial Economics 99, pp.116-135
Cull, Robert and Maria Soledad Martinez Peria (2012), “Bank Ownership and Lending Patterns during the 2008-2009 Financial Crisis: Evidence from Eastern Europe and Latin America,” World Bank, Mimeo.
Detragiache, Enrica, and Poonam Gupta (2006), “How do Foreign Banks Fare in Crises? Evidence from Malaysia,”Journal of Financial Stability 2, pp., 217-242.
Feler, Leo (2012), “State Bank Privatization and Local Economic Activity,” Johns Hopkins University, Mimeo.
Feler, Leo and Nicholas S. Coleman (2012), “Bank Ownership, Lending, and Local Economic Performance during the 2008-2010 Financial Crisis,” Johns Hopkins University, Mimeo
Goetz, Martin and Juan Carlos Gozzi Valdez (2010), “Liquidity Shocks, Local Banks, and Economic Activity: Evidence from the 2007-2009 Crisis,” SSRN 1709677.
Gupta, Poonam, Kalpana Kochhar and Sanjaya Panth (2011), “Bank Ownership and the Effects of Financial Liberalization: Evidence from India,” IMF Working Paper.
27
Appendix
Table A1:Variable Definitions
Variable Details
Deposits Deposits include demand deposits savings deposits and term deposits. We
take percent change in real deposits (deflated by CPI)
Size Log, Assets
Return on Assets Income minus expenses and provisions as percent of assets
Credit (Other)/Assets Advances made to “others” (i.e. to non government, non priority, and non bank sectors) as percent of assets
Capital/Assets Bank Capital/Assets
Provision/Assets Loan Loss Provisions/Assets
Capital Injection/Assets Capital Injections from Government/Assets
[image:28.612.103.522.339.488.2]The source of data for banking sector related variables is the RBI’s database "Statistical Tables Relating to Banks in India" and "Basic Statistical Returns".
Table A2: Summary Statistics
Variable Number of
Observations
Mean Std. Dev. Min Max
Provision/Assets 308 1.08 0.47 0.04 3.41
Return on Assets 308 0.86 0.56 -3.50 2.27
Capital/Assets 308 0.90 1.40 0.00 11.68
Assets Change 308 11.37 9.78 -30.28 49.93
Credit Change 308 17.92 16.82 -35.93 76.56
Deposits Change 308 11.38 10.13 -31.95 56.32
Size (Log Assets) 308 10.26 1.33 6.75 13.46
Capital Injection/Assets 308 0.01 0.10 0.00 1.10
Banks Included in the Data:
From the list of private banks currently operating in India we include all banks except Kotak Mahindra Bank and Yes Bank. These are new banks and only have data from 2005 and 2006 respectively. The first few years of the data for these banks show values that are unusually large (or small) as would be expected to be the case in the initial few years of operations. We treat Bank of Rajasthan as a separate bank, even though the bank merged with ICICI in 2010.
28
Mergers
The following cases of mergers are accounted for in the data, besides the ones listed in Gupta et al (2011): merger of Ganesh Bank of Kurunwad Ltd with The Federal Bank Ltd; merger of Sangli Bank Ltd with ICICI Bank Ltd.; merger of Lord Krishna Bank Ltd with Centurion Bank of Punjab Ltd.; merger of Centurion Bank of Punjab Ltd with HDFC Bank Ltd.; merger of State Bank of Saurashtra with State Bank of India; merger of State Bank of Indore with State Bank of India.
Capital Injections in Public Sector Banks
In February 2009, the government announced a capital injection in UCO Bank (Rs. 450 crores), Central Bank of India (Rs. 700 crores) and Vijaya Bank (Rs. 500 crores). In