A Low Cost and Versatile STED Superresolution
Fluorescent Microscope
Daniel McBride1, Chin Su1, Jun Kameoka1, Stanislav Vitha2
1Electrical and Computer Engineering Department, Texas A&M University, College Station, USA 2Microscopy & Imaging Center, Texas A&M University, College Station, USA
Email: [email protected]
Received May 28,2013; revised July 1, 2013; accepted July 8, 2013
Copyright © 2013 Daniel McBride et al. This is an open access article distributed under the Creative Commons Attribution License, which permits unrestricted use, distribution, and reproduction in any medium, provided the original work is properly cited.
ABSTRACT
A versatile and inexpensive super-resolution fluorescent microscope that functions as easily as a conventional confocal microscope is described. Components of the microscope were designed on a platform which was placed atop a surplus microscope frame. All optical components and equipments used are given. The excitation and depletion beams are ex- tracted from a compact low-cost supercontinuum light source. The focal spot of the depletion beam at the focal plane is studied and imaged by a 100 nm aperture near-field fiber tip. The collinear excitation and depletion beam focused by a 0.9 numerical aperture microscope objective produce a 90 nm lateral super-resolution as verified by imaging 100 nm diameter fluorescent beads.
Keywords: Stimulated Emission-Depletion Microscopy; STED
1. Introduction
The resolving power of an optical microscope is limited by diffraction effects to about half the wavelength of light. The confocal optical microscope widely used by biologists to examine three-dimensional cellular features has a lateral resolution limit of about 250 nm and an axial resolution limit of 500 nm if a high numerical aperture objective (1.4 NA) is used. In STED microscopy, sup- pression of florescence emission from dye molecules by stimulated emission effect for breaking the resolution limit was first invented by Stephen Hell in 1994 at the Max Planck Institute [1]. His idea involved the depletion of excited state dye molecules population by a depletion beam via the stimulated emission effect—the same prin-ciple responsible for lasing action in lasers. He named the microscope the “STED Microscope”, which stands for Stimulated-Emission-Depletion Microscope [2,3]. Since then STED microscopy has advanced to using birefrin-gent elements to improve resolution and greatly simplify designs [4]. In 2008, Lecia introduced the first comercial STED microscope which had a lateral resolution of 90 nm and currently cost about $700 K. With a novel design, we built a versatile STED microscope that functions like a confocal microscope but is much cheaper.
The basic principle of STED is briefly described. Some formulas that are useful for generating spot images
and predicting performances are given in the Appendix. A vortex phase plate [5] placed in the path of a colli- mated depletion beam that is focused by a microscope objective produces a donut shaped focal spot with a dark region at the center (Figure 1(a)). The fluorescent spot from dye molecules excited by a focused shorter wave- length beam is shown in Figure 1(b). The fluorescent intensity is taken to be proportional to the fluorophore excited state population. If the two spots overlapped, then the excited molecules that reside outside the central dark region will be de-excited to the ground state by the longer wavelength depletion light via the stimulated emission effect, turning the fluorescence off. The resul- tant emission spot is decreased as shown in Figure 1(c). These spots are calculated using formulas given in the Appendix.
(a) (b) (c)
Figure 1. Basic principle of STED. (a) The calculated focal spot of a red depletion beam with a central intensity null, (b) Green fluorescence due to dye molecules excited by a focused shorter wavelength beam, and (c) Resultant emission spot. The image frame is 2 μm × 2 μm.
ration effects increases the k-space and simultaneously decreases the r-space resolution.
The basic principle of PALM and STORM relies on sequential registration of emitting molecules separated by more than the diffraction limit. Their central coordi-nates are calculated by a fitting algorithm with accuracy better than the diffraction limit. As this procedure repeats, molecules that were turned on in previous cycles will eventually be bleached lessening the likelihood of mis- taken molecular positions as the frame accumulation progresses. When sufficient frames have been accumu- lated, a stack is formed to obtain a superresolution image of the sample. In STORM the photo-switchable probe molecules are switched off between frames using a laser with longer wavelengths [12]. In contrast, STED scans through the sample employing the same method used in confocal microscopy.
2. Optical Setup
The STED design that is used for obtaining superresolu- tion data is given below. Absorption and emission spec- tra of the particular dye molecules used determines the transmission-reflection spectral characteristics of optical components implemented in the design. Here we image the Invitrogen F8800 100 nm diameter orange fluores- cent beads for verification of super-resolution. The ex- tinction (absorption) and emission spectra of F8800 beads is given in Figure 2, and is used for explaining our STED design given in Figure 3 using components ap- propriate for the fluorescent molecule used.
We describe the detail of the design and relate the de- sign to the particular fluorescent molecules used. The components used in the design are summarized in Table 1. In Figure 3, a low numerical aperture (NA = 0.16) apochromatic microscope objective collimates the light
Figure 2. The extinction (absorption) and emission spectra of F8800 beads.
that exits the fiber end of a supercontinuum white light source or any other light sources that have a fiber con- nector output (the objective is house in a fixture with a fiber connector input adaptor). The supercontinuum source is the Koheras SuperK Compact model. A higher power supercontinuum source had also been for STED microscopy [13]. The light output of the Koheras Com- pact model is pulsed with a pulse width of 2 ns and a repetition rate of 25 kHz. The light is first polarized by a polarization beam splitter (PBS). A polarized light is needed so that it can be used in conjunction with the vortex phase plate and the quarter-wave plate to produce a focal spot with a central dark region as will be de- scribed below.
The white light is then filtered by a 561/13 nm notch filter that passes all wavelengths except the selected wavelength range within the notch. Wavelengths re- moved by the notch filter cover the fluorescence wave-
[image:2.595.311.536.311.466.2]Figure 3. Design of the STED microscope. PBS: polarization beam splitter. M: mirror. BS: beam splitter. VPP: vortex phase plate. QWP: quarter wave plate. PMT: photomultiplier.
Table 1. Components used in the microscope.
Components Make Model
Supercontinuum light
source Koheras SuperK compact apochromatic
objective Olympus UPLSApo 4×/0.16 Apochromatic
objective Olympus
PlanApo 40×/0.9 WLSM
notch filters Semrock FF03-561/13
dichroic beamsplitter Semrock Di01-R532
bandpass filters Semrock FF01-628/32
bandpass filters Semrock FF01-563/9
vortex phase plate RPC Photonics VPP-1
achromatic quarter
waveplate Thorlabs AQWP05M broadband dielectric
mirrors Thorlabs BB1-E02 precision kinematic
mirror mount Thorlabs KS2D
nano-translators Melles Griot Max603D
The selected emission wavelength range for detection is 9 nm centered at 563 nm. These are the wavelengths between the vertical lines as shown in Figure 2 and should be away from the excitation and depletion wave- lengths. After the first notch filter, the beam is split by a dichroic beam splitter. A band of short wavelength light below 532 nm is reflected and the rest of the longer wavelength light is transmitted. The dichroic filter cho-
sen here can be used for many different types of dyes. The reflected short wavelength light is used for pumping F8800 beads to its excited states for emission. Although the power level of the Koheras Compact model drops off dramatically for wavelength below 500 nm, the short wavelength light which has a average power level of 0.3 mW still needs to be greatly attenuated (by a factor of 100 in this case) because average power levels beyond a few μW saturates the exited state dye molecules popula- tion with no gain in emission signals beyond a few μW. Excessive excitation power only decreases the depletion effect compromising the resolution of the microscope.
plate shaped the beam that upon focusing by the apo- chromatic microscope objective with high numerical aperture (0.9), the beam cross-section exhibits a dough- nut shape central dark region appropriate for achieving lateral superresolution. The central dark region is due to the cancellation of the z-component of the electric field at the focal plane as described in [14] using the formula in [15]. Since the spatial resolution increases with deple- tion power [16], ideally, one would like to make use of the maximum depletion power available. However, the performance of the vortex phase plate is wavelength de- pendent. With the supercontinuum light source, one needs to limit the wavelength range for depletion by em- ploying a bandpass filter as mentioned above. In this work the average depletion power is about 0.9 mW.
The excitation light and the depletion light recombine collinearly at the second dichroic beam splitter as shown. The combined beam is reflected downward by a mirror then focused onto the sample by a microscope objective mounted on the rotating turret of the Olympus model MX 50A-F microscope frame. Initially, the overlapping of the excitation and depletion focal spot is performed by ad- justment of mirror M1 and M2 (mounted on Thorlabs precision mirror mount). After the initial adjustment, slight adjustment of only M2 is sometime needed, but usually the spots stay overlapped for a long time (weeks) unless the system is deliberately perturbed. The require- ment that the excitation spot and the depletion spot over- lap in the image plane placed a tight constraint regarding the tolerable beam-angle shift whenever components need to be substituted when different dyes are to be used. A simple calculation shows that the angular tolerance is only about 3 arc-second for a 50 nm lateral shift at the image plane. Often components that need to be replaced are the notch filters and the bandpass filter when dye molecules are changed. These components can all be quickly replaced without disturbing the alignment of the system because they are all placed in the transmission path. Multiple elements of vortex plates for multiple wavelengths applications are all imprinted on the same wafer. So, they can be rotated into place without shifting the beam. If the dichroic filter is chosen to have a transi- tion wavelength of 530 nm, it does not need to be changed for many dyes.
Fluorescent signal collected by the high NA micro- scope objective propagates backward, and its path is shown by the dashed line. The fluorescence from the sample retraced the original transmission path to the notch filter at which point it is reflected into the lens tube and then focused into a multimode fiber and measured by the PMT. The 563/9 bandpass filter (not shown) is placed inside the lens tube unit. We use an Olympus WSLM apochromatic water immersion objective with NA = 0.9 for evaluating the super-resolution.
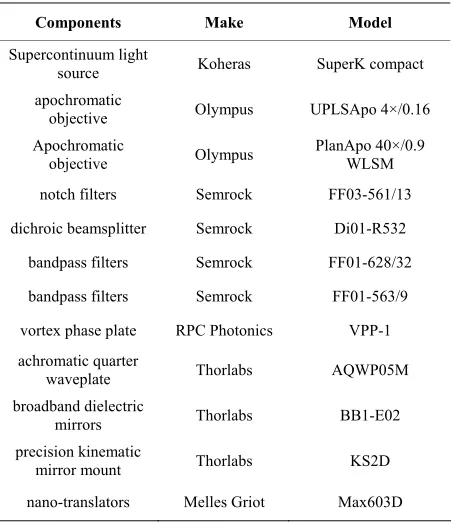
A beam splitter (BS) is placed before the high NA ob- jective and is used in conjunction with the lens tube and the CCD camera to view the sample and monitor the overlapping focal spots at different magnifications by choosing objectives mounted on the microscope turret. The lighting is provided by the original microscope. The beam splitter is slide away when image scan is to be taken so that a maximum depletion power can be applied to achieve the best resolution. Imaging is taken by trans- lating the sample. The original translation platform is removed and replaced by the Melles Griot nano-transla- tor model NanoMax 17Max600/L with 10 nm resolution. We control the nano-translator and the PMT by LabView programs. All components mentioned above except for the PMT and the supercontinuum light source are se- cured to a common platform. The whole platform re- places the original lens tube platform on top of the Olympus MX 50 microscope (Figure 4). Any other light sources with a fiber connector output can be connected to the 0.16 NA objective unit on the platform. Thus, the whole system functions like a confocal microscope and are very easy to use and is very stable. A picture of our microscope is shown in Figure 4.
3. Experiments
[image:4.595.332.514.571.708.2]In order to achieve super-resolution the donut shaped focal spot from the depletion beam must exhibit good quality and have a sufficiently dark central region. Since the central dark region is due to the cancellation of the z-component of the electric field as mentioned above, one cannot judge the quality of the central dark region by observing the focal spot from the CCD camera because the image spot at the camera is not tightly focus and the z-component of the electric field is small anyway. Thus, a good dark central region observed on the camera does not guarantee a sufficiently dark central region of a tightly focused spot created by a high numerical aperture apochromatic objective. We found that a 100 nm aperture NSOM fiber tip can be used for imaging the focal spot,
but a 50 nm aperture NSOM fiber tip cannot because the light coupled into the tip is insufficient for producing an image. The straight NSOM fiber tip from Nanonics was inserted inside a standard fiber optic ferrule for protec- tion. Standard fiber optic technologies can then be used for positioning the NSOM fiber and measuring the signal coupled into the fiber tip. Once the tip is protected by the fiber optic ferrule, this method offers better repeatability and is less time consuming to implement than the normal method which uses the light scattered off a nano-particle or a fluorescent bead for imaging the focal spot [14,16]. Figure 5(a) shows a 2 μm × 2 μm image of the focal spot by x-y scan of the NSOM fiber tip.
The central dark region of the depletion beam spot is verified. Also shown on the right is the horizontal line plot of the intensity profile across the central dark region. A convolution calculation taking into account the 100 nm aperture of the NSOM fiber tip, gives essentially an in- tensity of zero at the center of the dark region. Note that an Airy ring is also visible. Figure 5(b) shows the image of the focal spot if the vortex phase plate is removed. The spot is quite uniform with a central intensity maximum as it should be. A line plot of the intensity is also given. The optical components listed in Table 1 give excellent beam quality for achieving the required characteristics of the depletion spot.
For verifying the super-resolution with 100 nm dia- meter F8800 fluorescent beads, the beads are attached to a cover glass and embedded in agarose gel on micro- scope slides. The sample is placed on the nano-translator
(a)
(b)
Figure 5. (a) Image of a 2 μm × 2 μm scan of the focal spot of the depletion beam using an UPlanApo dry apochromatic objective with numerical aperture of 0.85. The intensity plot through the central dark region is also given. (b) Image of the focal spot if the VPP is removed.
for scanning. The objective with the highest numerical aperture available to us is the Olympus WLSM 40× wa- ter immersion apochromatic objective with NA = 0.9. Figure 6(a) shows a fluorescent image using this objec-tive for the case with the depletion beam blocked. Figure 6(b) is the image with the VPP in position revealing two clumps of beads.
Note that the peak intensity remains about the same with or without the depletion beam, only the width de- crease because the center of the depletion beam is dark. With the 0.9 NA objective, a convoluted lateral super- resolution of about 90 nm is achieved accounting for a bead size of at least 100 nm. Note that the focal spot size should decrease with objective’s NA. The decrease in focal spot size increases the optical intensity, giving a better depletion effect. Therefore, using a higher NA objective such as the oil immersion apochromatic objec- tive with NA = 1.4 ($9 K), the estimated resolution should be about 40 nm accounting for the two factors.
4. Conclusion
An inexpensive and versatile super-resolution fluorescent microscope was described. The microscope functions easily as a conventional confocal microscope. The com- ponents of the microscope were designed on a platform that was placed atop a surplus microscope frame. The excitation and depletion beams were extracted from a compact low-cost supercontinuum light source. Other light sources can be used by simply connecting its light output to the fiber receptacle of the objective’s housing unit. The focal spot of the depletion beam at the focal plane was studied and imaged by a 100 nm aperture near-field fiber tip. The collinear excitation and depletion
(a) (b)
[image:5.595.57.289.465.674.2] [image:5.595.308.537.505.685.2]beam focused by a 0.9 numerical aperture microscope objective produced a 90 nm later super-resolution after performing a convolution as verified by imaging 100 nm diameter fluorescent beads. The total cost of the project is about $38K with the bulk of the cost coming from the supercontinuum source ($20 K), the nano-translator ($11 K) and the apochromatic microscope objective ($7 K).
REFERENCES
[1] S. Hell and J. Wichmann, “Breaking the Diffraction Resolution Limit by Stimulated Emission: Stimulated- Emission-Depletion Fluorescence Microscopy,” Optics Letters, Vol. 19, No. 11, 1994, pp. 780-782.
doi:10.1364/OL.19.000780
[2] B. Hein, K. Willig and S. Hell, “Stimulated Emission Depletion (STED) Nanoscopy of a Fluorescent Pro- tein-Labeled Organelle Inside a Living Cell,” Proceed- ings of the National Academy of Sciences of the United States of America, Vol. 105, No. 38, 2008, pp. 14271- 14276. doi:10.1073/pnas.0807705105
[3] R. Schmidt, C. Wurm, S. Jakobs, J. Engelhardt, A. Egner and S. Hell, “Spherical Nanosized Focal Spot Unravels the Interior of Cells,” Nature Methods, Vol. 5, 2008, pp. 539-544. doi:10.1038/nmeth.1214
[4] M. Reuss, J. Engelhardt and S. Hell, “Birefringent Device Converts a Standard Scanning Microscope into a STED Microscope that Also Maps Molecular Orientation,” Op-tics Express, Vol. 18, No. 2, 2010, pp. 1049-1058. doi:10.1364/OE.18.001049
[5] N. Heckenberg, R. McDuff, C. Smith and A. White, “Generation of Optical Phase Singularities by Com-puter-Generated Holograms,” Optics Letters, Vol. 17, No. 3, 1992, pp. 221-223. doi:10.1364/OL.17.000221
[6] R. Heintzmann, T. Jovin and C. Cremer, “Saturated Pat-terned Excitation Microscopy—A Concept for Optical Resolution Improvement,” Journal of the Optical Society of America A, Vol. 19, No. 8, 2002, pp. 1599-1609. doi:10.1364/JOSAA.19.001599
[7] M. Gustafsson, “Nonlinear Structured-Illumination Mi-croscopy: Wide-Field Fluorescence Imaging with Theo-retically Unlimited Resolution,” Proceedings of the Na- tional Academy of Sciences of the United States of Amer-
ica, Vol. 102, No. 37, 2005, pp. 13081-13085. doi:10.1073/pnas.0406877102
[8] S. Hess, T. Girirajan and M. Mason, “Ultra-High Resolu- tion Imaging by Fluorescence Photoactivation Localiza- tion Microscopy,” Biophysical Journal, Vol. 91, No. 11, 2006, pp. 4258-4272. doi:10.1529/biophysj.106.091116 [9] E. Betzig, G. Patterson, R. Sougrat, O. Lindwasser, S.
Olenych, J. Bonifacino, M. Davidson, J. Lippincott- Schwartz and H. Hess, “Imaging Intracellular Fluorescent Proteins at Nanometer Resolution,” Science, Vol. 313, No. 5379, 2006, pp. 1642-1645. doi:10.1126/science.1127344 [10] M. Rust, M. Bates and X. Zhuang, “Sub-Diffraction-
Limit Imaging by Stochastic Optical Reconstruction Mi- croscopy (STORM),” Nature Methods, Vol. 3, 2006, pp. 793-796. doi:10.1038/nmeth929
[11] M. Bates, B. Huang, G. Dempsey and X. Zhuang, “Mul- ticolor Super-Resolution Imaging with Photo-Switchable Fluorescent Probes,” Science, Vol. 317, No. 5845, 2007, pp. 1749-1753. doi:10.1126/science.1146598
[12] B. Huang, W. Wang, M. Bates and X. Zhuang, “Three- Dimensional Super-Resolution Imaging by Stochastic Optical Reconstruction Microscopy,” Science, Vol. 319, No. 5864, 2008, pp. 810-813.
doi:10.1126/science.1153529
[13] D. Wildanger, E. Rittweger, L. Kastrup and S. Hell, “STED Microscopy with a Supercontinuum Laser Source,” Optics Express, Vol. 16, No. 13, 2008, pp. 9614- 9621. doi:10.1364/OE.16.009614
[14] Y. Iketaki, T. Watanabe, N. Bokor and M. Fujii, “Inves- tigation of the Center Intensity of First- and Second-Order Laguerre-Gaussian Beams with Linear and Circular Po- larization,” Optics Letters, Vol. 32, No. 16, 2007, pp. 2357-2359. doi:10.1364/OL.32.002357
[15] B. Richards and E. Wolf, “Electromagnetic Diffraction in Optical Systems I. An Integral Representation of the Im- age Field,” Proceedings of the Royal Society of London. Series A, Mathematical and Physical Sciences, Vol. 253, No. 1274, pp. 358-379. doi:10.1098/rspa.1959.0200 [16] V. Westphal and S. Hell, “Nanoscale Resolution in the
Focal Plane of an Optical Microscope,” Physical Review Letters, Vol. 94, 2005, Article ID: 143903.
Appendix
1. Formulas for Calculating the Electric Field near the Focus of a Microscope Objective The general formulas that can be used to write computer codes for calculating the focal image are given below. These basic formulas are given in [15]. Here we extend the result of [15] by including the effect of phase plates placed in the object plane of a microscope objective. We also substitute a plane wave in the object plane by a more realistic wave described by a Gaussian distribution.
The positive z-direction is the axial direction of the microscope objective lens through the lens’ center and away from the objective in the image plane. A point in the image plane is defined by spherical coordinates, (R,
Θ, Φ). A common function to be used is,
0 , , , ,exp cos cos
sin sin cos K R ik R (1)
where, k02πn , λ is the wavelength and n is the
refractive index of the immersion medium at the objec-tive. and are variables of integration.
For incident light polarization in the x-direction, the x,
y and z component of the electric field Ex, Ey, Ez at any point in the image plane is described by (asides from a proportion factor),
2 0 0
, , , , , d
x x
E G K R F F
d
d (2a)
2 0 0, , , , , d
y y
E G K R F F
d (2b)
2 0 0, , , , , d
z z
E G K R F F
(2c) where Gx, Gy, and Gz in (2a)-(2c) are given by,
2
cos sin cos 1 cos sin
x
G
(3a)
cos sin 1 cos sin cos
y
G
(3b)
2
cos sin cosz
G (3c) The θ integration limit α is given by,
1 sin NA n
(4)
where NA is the numerical aperture of the microscope
objective.
Generally, F
and F
are arbitrary functions describing the effect of the phase-plate placed in the ob-ject space. For a vortex phase plate,
exp
F i (5a) And for a Gaussian intensity distribution without a θ dependent phase plate,
exp 2 sin2
2 2D n F
NA
2
(5b)
D is the aperture diameter of the objective at its back focal plane, and 2= W 4 ln 2 ,2
where W is thehalf-intensity width of the collimated beam entering the objective.
For incident light polarization in the y direction, the expression for Ex, Ey, Ez are same as (2a)-(2c) except that
Gx, Gy, and Gz are given by (6a)-(6c),
cos sin 1 cos sin cos xG (6a)
2
2
cos sin cos sin cos
y
G (6b)
2
cos sin sinz
G (6c) If the incident polarization has equal magnitude in the
x and y direction, then the total intensity profile, I, near the focus is given by,
21 exp π 2
I E i E2 (7)
where E1 is the vector sum of the electric field at the
image plane (2a)-(2c) due to the x component of the inci- dent electric field in the object space and E2 is the vec-
tor sum due to the y-component. The phase factor,
exp iπ 2 , accounts for the phase shift between E1
and E2 due to the quarter wave-plate.
2. Rate Equations for Describing the Depletion Effects
equation description is unrealistic. Nevertheless, only for qualitative description purpose, we simply assume an absorption cross-section σ12 and a emission cross-section
σ21. We also assume that the excited states and the
ground states molecular density consist of the sum of all the states in its manifold. The calculated results pre- sented in Figure 1(c) use these assumptions.
The rate equation describing the excited state popula-tion N2 is given by,
2
12 1
21 2
d , ,
, d
, 1
,
e e
e
D D
D
N r t P r t
N r t
t h
P r t
N r t h
(8)
N1 is the ground state population, and N is the total
molecular density. λe and λD are the excitation wave- length and depletion wavelength, respectively. Their corresponding frequencies are υe and υD. σ12(λe) and σ21(λD) are the absorption and emission cross-sections at the excitation and depletion wavelengths, respectively. τ is the spontaneous lifetime. Pe(r,t) is the excitation power, and PD(r,t) is the depletion power. Their spatial depend- ence is calculated from the formulas given above. The time dependence occurs because the laser is pulsed. Since the cross-section of molecules is approximately 1 × 10⁻¹⁶ cm2, we assume this number for σ
12 and σ21. The
image of Figure 1(c) is obtained by solving (8) and (9), with the spatial intensity given by 2
, .t
N r t
1 ,