Munich Personal RePEc Archive
The two sides of envy
Gershman, Boris
Brown University
17 October 2011
The Two Sides of Envy
∗
Boris Gershman
†Brown University
First Draft: September 2010
This Draft: October 2011
Abstract
The two sides of envy, destructive and competitive, give rise to qualitatively different equilib-ria, depending on the economic, institutional, and cultural environment. If inequality is high, property rights are poorly protected, and social comparisons are strong, society is likely to be in the “fear equilibrium,” in which better endowed agents restrain their efforts to prevent destructive envy of the relatively poor. In the opposite case, the standard “keeping up with the Joneses” competition arises, and individuals satisfy their positional concerns through sub-optimally high efforts. The different nature of these equilibria leads to strikingly contrasting effects of envy on economic performance. From a welfare perspective, the adoption of better institutions that move the economy away from the low-output fear equilibrium may not be Pareto improving since it aggravates the negative consumption externality. In a dynamic setting, envy-avoidance behavior, dictated by the destructive side of envy, reduces inequal-ity and paves the way to emulation, driven by its competitive side. The paper provides a foundation for understanding the evolving role of envy in the process of development.
Keywords: Envy, Fear of envy, Inequality, Property rights, Relative standing
JEL Classification Numbers: D31, D62, D74, O10, O43, Z13
∗I am grateful to Oded Galor, Peter Howitt, and David Weil for their guidance and advice. Quamrul Ashraf, Pedro Dal B´o, Geoffroy de Clippel, Mana Komai, Mark Koyama, Nippe Lagerl¨of, Ross Levine, Glenn Loury, Michael Ostrovsky, Louis Putterman, Eytan Sheshinski, Ilya Strebulaev, Holger Strulik, and Anand Swamy provided valuable comments. I also would like to thank seminar participants at Brown University, New Economic School, SEA 80th annual conference in Atlanta, Moscow State University, and Williams College.
1
Introduction
In recent years it has become increasingly apparent that variations in cultural character-istics contribute to differential development paths across the globe. Trust, religion, family ties, and risk attitudes are among the attributes shown to have profound effects on eco-nomic outcomes.1 This paper takes a new look at the role of envy, another prominent
cultural force guiding human behavior.
Although concern for relative standing is widely recognized as a salient feature of in-dividuals interacting in a society, there is no agreement on how it affects the economy, either directly, through its impact on incentives to work and invest, or indirectly, through its connections to institutions and culture.2 In some parts of the world people engage
in conspicuous consumption and overworking, driven by competition for status, while in others they hide their wealth and underinvest, constrained by the fear of malicious envy.
This paper develops a unified framework capturing the qualitatively different equilibria that can emerge in the presence of concern for relative standing, depending on the economic, institutional, and cultural environment. It sheds new light on the implications of positional concerns for economic performance and social welfare, and adds a new perspective to the analysis of redistributive mechanisms and the dynamics of wealth inequality.
Throughout the paper envy is taken to be a characteristic of preferences that makes people care about how their own consumption level compares to that of their reference group. This operational definition implies that envy can be satisfied in two major ways: by increasing own outcome (competitive envy) and by decreasing the outcome of the reference group (destructive envy).3 Given the two sides of envy, individuals face a fundamental
trade-off. On the one hand, they strive for higher relative standing. On the other hand, they want to avoid the destructive envy of those falling behind. The way this trade-off is resolved shapes the role of envy in society.
1For a state-of-the-art overview see Fern´andez (2011) and other chapters in Benhabib et al. (2011).
2A number of evolutionary theoretic explanations have been proposed for why people care about relative
standing, see Hopkins (2008, section 3) and Robson and Samuelson (2011, section 4.2) for an overview. Evidence in support for positional concerns is abundant and comes from empirical happiness research (Luttmer, 2005), experimental economics (Zizzo, 2003; Rustichini, 2008), neuroscience (Fliessbach et al., 2007), and surveys (Solnick and Hemenway, 2005; Clark and Senik, 2010); see Clark et al. (2008, section 3) and Frank and Heffetz (2011, section 3) for an overview.
3An alternative option is to drop out of competition for status (Banerjee, 1990; Barnett et al., 2010).
The basic model is set up as a simple two-stage dynamic game between two individuals who are each other’s reference points. In the first stage of the game each individual exerts effort that, combined with endowment, yields an investment outcome, or potential output. In the second stage, the available time may be spent on the realization of own potential output and disruption of the other individual’s production process. The optimal allocation of time between productive and destructive activities depends on the disparity of invest-ment outcomes and the tolerance for inequality, the latter being determined endogenously by the level of property rights protection (effectiveness of destruction technology) and the strength of social comparisons. The unique equilibrium of the model can be of three dif-ferent types that are broadly consistent with the conflicting evidence on the role of envy from around the world.
If the initial inequality is low and/or the tolerance for inequality is high, the familiar “keeping up with the Joneses” (KUJ) equilibrium arises. In this case individuals com-pete peacefully for their relative standing, and the consumption externality leads to high effort and output. These are typical characteristics of a consumer society prominently documented for the U.S. by Schor (1991) and Matt (2003).
Higher inequality and/or lower tolerance for inequality may lead to the “fear equilib-rium,” in which the better endowed individual anticipates destructive envy and prevents it by restricting effort at the investment stage. Such envy-avoidance behavior is standard for traditional agricultural communities in developing economies, where the fear of inciting envy discourages production (Foster, 1979; Dow, 1981). It is also typical for the emerging markets like China and Russia, where potential entrepreneurs are reluctant to start new business that can provoke envious retaliation of others (Mui, 1995).
Finally, if the tolerance for inequality is very low and/or the distribution of endowments is highly unequal, a “destructive equilibrium” arises, in which actual conflict takes place and time is wasted unproductively to satisfy envy. Allowing for transfers replaces destructive activities of the poor with “voluntary” sharing of the rich, reflecting the evidence on the fear-of-envy motivated redistribution in peasant societies of Latin America (Cancian, 1965), Southeast Asia (Scott, 1976), and Africa (Platteau, 2000).
The qualitatively different nature of these equilibria leads to opposite effects of posi-tional concerns on aggregate economic performance. In the KUJ equilibrium envy increases effort and output by intensifying status competition, while in the fear equilibrium it ag-gravates the already binding “fear of envy constraint” further discouraging investment.
low-output fear equilibrium to the high-low-output KUJ equilibrium, such change need not be welfare enhancing if it triggers the “rat race” competition. That is, individuals may be happier in the fear equilibrium, since the threat of destructive envy constrains the subop-timally high efforts induced in the KUJ equilibrium.
A dynamic version of the model explores the transitions between equilibria. It shows how the implications of envy change endogenously as the society evolves from destructive equilibrium to the long-run KUJ steady state, following the dynamics of inequality. In this setting, institutional and cultural parameters not only affect economic outcomes at a given point in time but also determine the division of the transition process into three “envy regimes” qualitatively corresponding to the equilibria of the static model. Initially, destructive envy and the fear of it reduce inequality by discouraging productive effort of the better endowed individual or destroying part of his output. This leads to more equal investment opportunities for next generations, up to the point when it becomes optimal to compete productively. Thus, envy-avoidance behavior, dictated by the destructive side of envy, eventually paves the way to emulation, driven by its competitive side. This transition can be delayed or accelerated by factors, such as religion, political ideology, and legal institutions, that affect the strength of social comparisons and the relative attractiveness of productive and destructive effort.
The model is designed to be “scale-free,” that is, inequality, but not the scale of pro-duction, is the key variable of the analysis. Nevertheless, it provides a foundation for understanding the evolving role of envy in the process of development. Specifically, Ger-shman (2011b) incorporates the basic model of this paper in a simple endogenous growth framework, in which resources are limited and productivity is driven by learning-by-doing and knowledge spillovers. Rising productivity expands the production possibilities fron-tier, and the economy experiences an endogenous transition from the fear equilibrium to the KUJ equilibrium. At the same time, the type of equilibrium at each point feeds back into the growth rate of productivity by constraining or spurring investment. Such analysis explicitly connects the alternative types of equilibria to different stages of economic devel-opment, consistent with the evidence of the following section, and qualifies some results of the static model by accounting for the long-run dynamics.
2
Evidence on the Two Sides of Envy
As wealth increases, the continued stimulus of em-ulation would make each man strive to surpass, or at least not fall below, his neighbours, in this.
Richard Whately (1831)
Introductory Lectures on Political Economy
The affluence of the rich excites the indignation of the poor, who are often both driven by want, and prompted by envy, to invade his possessions.
Adam Smith (1776)
The Wealth of Nations
As exemplified by the quotations above, the distinction between competitive and de-structive sides of envy in economics goes back to the classicists. Since then, this dichotomy has been discussed extensively by anthropologists (Foster, 1972), philosophers (D’Arms and Kerr, 2008), political scientists (Fern´andez de la Mora, 1987), psychologists4 (Smith
and Kim, 2007), sociologists (Schoeck, 1969; Clanton, 2006), and recently got a renewed interest from economists (Elster, 1991; Zizzo, 2008; Mitsopoulos, 2009).
Evidence on the destructive potential of envy comes primarily from the developing world. For instance, recent data from the Afrobarometer surveys5 indicate that envy is
perceived as an important source of conflict. Respondents were asked the following ques-tion: “Over what sort of problems do violent conflicts most often arise between different groups in this country?” They were offered to choose the three most important problems from a list of several dozens of possible answers (such as religion, ethnic differences, eco-nomic issues). Remarkably, in nine countries, where the list featured “envy/gossip” as a potential source of violent conflict, an average of over 9% of respondents have picked it as one of the three most important reasons.
The threat of destructive envy naturally leads to a rational fear of it that motivates envy-avoidance behavior. Numerous examples of such behavior come from anthropological research on small-scale agricultural communities around the world. According to Foster (1972), in peasant societies “a man fears being envied for what he has, and wishes to protect himself from the consequences of the envy of others” (p. 166). People are reluctant to exert effort or innovate since they expect sanctions in the form of plain destruction, forced redistribution, or envy-driven supernatural punishment.6
4Certain psychological approaches treat benign and malicious envy as two separate emotions (van de
Ven et al., 2009). The present theory is crucially different in that the motive, envy, is the same, but its manifestation is an equilibrium outcome.
5Second round, 2002–2003; raw data available athttp://www.afrobarometer.org.
6The rational fear of envy becomes curiously embedded in culture. The term “institutionalized envy”
In Tzintzuntzan, a Mexican village, people do not go beyond minimum conveniences even if they can afford it (Foster, 1979). A relatively wealthy peasant refuses to lay a cement or tile floor, or cut windows in his rooms since he is “frankly afraid people will envy him” (p. 154). Similarly, the “envious hostility of neighbors” discourages the villagers of Northern Sierra de Puebla, also in Mexico, to produce food beyond subsistence (Dow, 1981). In peasant communities of Southeast Asia people work “in large measure through the abrasive force of gossip and envy and the knowledge that the abandoned poor are likely to be a real and present danger to better-off villagers” (Scott, 1976, p. 5).
The fear of destructive envy is not an exclusive feature of simple agricultural societies. Mui (1995) focuses on the large industrial economies, Russia and China, in the process of transition to the free market. He brings up evidence on emerging cooperative restaurants and shops in the Soviet Union being regularly attacked by people resenting the success of their owners. Mui then tells a similar story of a Chinese peasant whose successful entrepreneurship provoked the envious neighbors to steal timber for his new house and kill his farm animals. “I dare not work too hard to get rich again” was his comment. The fear of envy may be a particularly serious issue in societies with socialist experience characterized by the ideology of material egalitarianism and neglect of private property rights, both reducing the tolerance for inequality.
A very different strand of evidence comes from the modern consumer societies, in which the competitive side of envy is predominant and the fear of destructive envy vanishes. As observed with dismay by the Christian Advocate newspaper (1926), consumer society offers a new version of the tenth commandment: “Thou shalt not be outdone by thy neighbor’s house, thou shalt not be outdone by thy neighbor’s wife, nor his manservant, nor his car, nor anything – irrespective of its price or thine own ability – anything that is thy neighbor’s” (cited in Matt, 2003, p. 4). Benign consumer envy becomes the target of producers and salesmen (Belk, 2008).
Under “keeping up with the Joneses” envy acts a stimulus to work harder to be able to match the spending patterns of the reference group.7 According to Schor (1991), the steady
increase in work hours in the U.S. since the early 1970s is primarily due to the competitive effects of social comparisons. The positive impact of relative standing concerns on labor supply in developed economies is supported by rigorous empirical research. Neumark and Postlewaite (1998) study the employment decisions of women using data from the U.S.
7As argued by Frank (2007), hard work is not the only way to keep up with the Joneses in the
National Longitudinal Survey of Youth and find evidence that those are partly driven by relative income. Bowles and Park (2005) use the aggregate data from ten OECD countries over the period 1963–1998 to show that greater earnings inequality is associated with longer work hours. They attribute this finding to the Veblen effect of the consumption of the rich on the less wealthy, that is, emulation.
Overworking caused by competitive envy and the welfare consequences of the KUJ-type competition have become the subject of recent research in the field of happiness economics (Graham, 2010). In particular, accounting for the relative standing concern is one of the keys to understanding why happiness and material well-being might not always go together. In the words of Schor (1991, p. 124), those caught in a race for relative standing “would be better off with more free time; but without cooperation, they will stick to the long hours, high consumption choice.”
The controversial evidence on the role of envy in society poses a number of questions. How does the same feature, concern for relative standing, give rise to these qualitatively different cases? Under what conditions do the fear of envy or the KUJ competition emerge? What are the implications of social comparisons for economic performance and welfare? The first step towards thinking about these issues is to construct a unified framework reconciling the above evidence.
3
The Basic Model
3.1
Environment
Consider two agents that may be thought of as representatives of equal-sized homogeneous groups of people. They differ only in the amount of broadly defined initial endowments,
Ki, i= 1,2. In particular,
K1 =λK, K2 = (1−λ)K, (1)
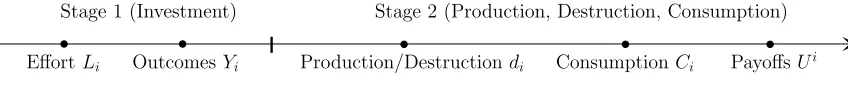
where K is the total endowment in the economy and parameter 0< λ < 1/2 captures the degree of initial inequality: Agent 1 is “poor” and Agent 2 is “rich.” They interact in the following two-stage game (see Figure 1).
In the first stage of the game both agents invest, for instance, in education or innova-tion. Specifically, each agent exerts effort, Li >0, to produce an investment outcome, Yi, according to
EffortLi OutcomesYi
Stage 1 (Investment) Stage 2 (Production, Destruction, Consumption)
[image:9.612.88.512.89.133.2]Production/Destructiondi ConsumptionCi PayoffsUi
Figure 1: Timing of events in the envy game.
This outcome may be thought of as a factor of production like human or physical capital, intermediate product, or potential output in general, to be realized in the second stage.
In the second stage, each agent has a unit of time that has to be allocated between realization of own potential output (production) and disruption of the other agent’s pro-duction process (destruction). Clearly, in this setup the only reason for spending time on destruction is envy.8 If Agent i allocates a fraction d
i ∈ [0,1] of his time to disrupt the productive activity of Agent j, the latter retains only a fraction pj of his final output, where
pj =p(di) = 1 1 +τ di
, i, j = 1,2, i6=j. (3) As will become clear, the formulation with time allocation makes the model scale-free: optimal destruction intensity will be a function of the inequality (but not the scale) of first-stage outcomes, which captures the essence of destructive envy.9 The function p(di)
has standard properties: it is bounded, with p(0) = 1, decreasing, and convex (Grossman and Kim, 1995). Parameterτ >0 measures the effectiveness of destruction technology and may capture the overall level of private property rights protection. In particular, property rights are secure ifτ is low.
Time 1−di is spent on the realization of potential output Yi yielding the final output (1−di)Yi. Since only a fraction p(dj) of this output is retained, the consumption level of Agent iis given by
Ci = (1−di)p(dj)Yi, i, j = 1,2, i6=j. (4) Finally, payoffs are generated. The utility function is of the following form:
Ui =U(Ci, Cj, Li) =v(Ci−θCj)−e(Li) =
(Ci−θCj)1−σ
1−σ −Li, (5)
8The model can be generalized to incorporate protection and theft, instead of pure destruction, without
affecting the qualitative results. The implications of defense in a model of appropriation were examined by Grossman and Kim (1995; 1996).
9If, apart from time, material resources or extra effort are needed to destroy, the scale effect may arise,
where i, j = 1,2, i 6= j, σ > 1, and 0 < θ < 1.10 It is increasing in own consumption
while decreasing in the other agent’s consumption and own effort. Agents are each other’s reference points, which is natural in the setup with two individuals, and parameter θ
captures the strength of concern for relative standing. This utility function features additive comparison which is one of the two most popular ways to model envy, the other being ratio comparison.11 Overall, the form of the utility function is identical to that in Ljungqvist
and Uhlig (2000), but in their model the reference point for each agent is the average consumption in the population.
A crucial property of this utility function is that the cross-partial derivative U12 is
positive, leading to the “keeping up with the Joneses” kind of behavior, or emulation, due to complementarity between own and reference consumption. Clark and Oswald (1998) call this a “comparison-concave” utility (sincev is concave). Intuitively, individuals are willing to match an increase in consumption of their reference group. The reason is that an increase inCj reduces the consumption rank of individuali and, under concave comparisons, raises the marginal utility of his own consumption.
Finally, the payoff function implies that consumption is a positional good, while leisure (disutility of effort) is not. This hypothesis has been consistently advocated by Frank (1985; 2007) and finds support in the data (Solnick and Hemenway, 2005).
3.2
Equilibria
The dynamic structure of the model makes subgame perfect equilibrium a natural solution concept. The model is solved backwards, starting at stage 2, when effort is sunk. Given the outcomes of the investment stage,Y1 and Y2, Agent i chooses the intensity of destruction,
di, to maximize his payoff:
v((1−di)p(dj)Yi−θ(1−dj)p(di)Yj)−→max di
s.t. 06di 61, (6)
where i, j = 1,2, i6=j.
10Assume for simplicity that Ui =−∞wheneverC
i 6θCj. Since effort is unbounded, this will never
be the case in equilibrium. The assumption on the elasticity of marginal utility with respect to relative consumption, σ, is a convenient regularity condition that is not crucial for the main results; see also the discussion in section 3.3. Linearity in effort is assumed for analytical tractability.
11Additive comparison was used, among others, by Knell (1999), Ljungqvist and Uhlig (2000) and
This yields the optimal second-stage response12:
d∗
i =
0, if Yi/Yj >τ θ(1−dj)(1 +τ dj);
1
τ ·
q
τ θYj
Yi(1−dj)(1 +τ dj)−1
, if Yi/Yj < τ θ(1−dj)(1 +τ dj).
(7)
Several features are to be noticed about this expression. First, without envy (θ = 0) there is no destruction. If envy is present, the decision about engaging in destruction depends on the inequality of investment outcomes, Yi/Yj. If Yi is high enough compared to Yj, Agent i finds it optimal to refrain from destruction. Otherwise, it is optimal to engage in destruction and its intensity is increasing in inequality, effectiveness of destructive technology, and the strength of positional concerns.
The product τ θ is an endogenous measure of tolerance for inequality. Given the ratio of investment outcomes, destructive envy is more likely to occur if positional concerns are strong (large θ) and property rights are poorly protected (large τ). Hence, large τ θ means low tolerance for inequality. If dj = 0, the product τ θ provides a critical inequality level, beyond which Agentichooses to engage in destruction. Assume from now on thatτ θ <1, that is, in the case whendj = 0, there is some tolerance for inequality andd∗i = 0 ifYi >Yj. Given this assumption, the agent with higher investment outcome will never attack in the second-stage equilibrium, as established in the following lemma.13
Lemma 1. (Second-stage equilibrium). Let Y2 > Y1. Then, in the second-stage
equilib-rium d∗
2 = 0 and d∗1 is given by
d∗
1 =
0, if Y1/Y2 >τ θ; 1
τ ·
q
τ θY2
Y1 −1
, if Y1/Y2 < τ θ.
(8)
Hence, Agent 2 retains a fractionp∗
2 of his final output, where
p∗
2 =p(d∗1) = min
(r
Y1
Y2 ·
1
τ θ,1
)
(9)
and is strictly decreasing in τ, θ, and Y2/Y1, if destruction takes place.
12Clearly,d∗
i = 1 is never optimal, see footnote 10. Since the first-stage efforts guarantee thatCi−θCj>
0 in equilibrium,d∗
i <1 is the only relevant case.
13This assumption rules out the case in which individuals with higher relative standing engage in
It can be shown that in the subgame perfect equilibrium of the game the initially better endowed Agent 2 will always have a higher investment outcome, that is, Y2 > Y1, and so,
given the result above, he will never spend time on destructive activities. For expositional simplicity we proceed as if there is a “predator and prey” type relationship (Grossman and Kim, 1996) between Agent 1 and Agent 2 from the outset, so that only the initially poor Agent 1 is allowed to engage in destruction at stage 2. Such assumption is made without loss of generality and underlines the asymmetric equilibrium roles played by the agents in the general formulation of the model.14
Agents are forward-looking and anticipate the optimal second-stage actions when mak-ing their first-stage decisions. Although Agent 2 is passive at stage 2, he is perfectly aware of how his investment outcome affects d∗
1 and takes this into account at stage 1:
U2 =v(p(d∗
1)Y2−θ(1−d∗1)Y1)−Y2/K2 −→max
Y2
(10)
For technical reasons, it is easier to analyze the best responses of both agents in terms of their consumption levels, Ci, rather than the first-stage outcomes Yi. Note that these are different only if destruction actually takes place. In that case there is a one-to-one mapping between Yi and Ci.
Lemma 2. (BR of Agent 2). The best-response function of Agent 2, BR2 ≡C2∗(C1), has
the following form:
C∗
2(C1) =
K21/σ+θC1, if C1 >Ce1;
C1· τ θ1 , if Cb1 6C1 <Ce1;
Cd
2(C1), if C1 <Cb1,
(11)
where
e
C1 ≡
τ θ
1−τ θ2K 1/σ
2 , Cb1 ≡
τ θ
1−τ θ2
1 +θ2
2 K2
1/σ
,
and Cd
2(C1) is implicitly given by
C2−θC1 =φ·
C1+θC2
C2
1/σ
, φ ≡
1 +θ2
2θ(1 +τ)K2
1/σ
. (12)
The function Cd
2(C1) is strictly increasing and concave.
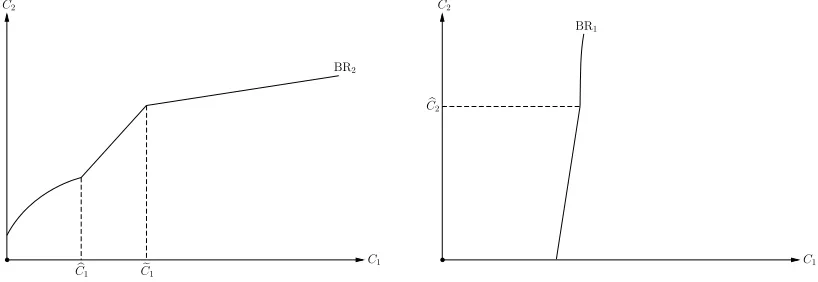
The best response function of Agent 2, depicted in the left panel of Figure 2, consists of three segments that correspond to the following cases. If the output of Agent 1 is high
enough, Agent 2 is not constrained by destructive envy and displays the standard KUJ behavior. If the output of Agent 1 is in the intermediate range, the best response of Agent 2 is to avoid destructive envy by constraining his own effort at stage 1. This is the “fear segment,” in which Agent 2 exerts the maximum possible effort that prevents destruction at stage 2. Finally, if the output of Agent 1 is low, it becomes too costly for Agent 2 to avoid destruction by self-restraint and the optimal action is to allow some of it.
BR2
C1 C2
b
C1 C1e
BR1
C1 C2
b
[image:13.612.103.512.202.343.2]C2
Figure 2: Best responses of Agent 2 (left) and Agent 1 (right).
Agent 1 is also forward-looking and knows his own optimal second-stage behavior when optimizing at the investment stage:
U1 =v((1−d∗
1)Y1−θp(d∗1)Y2)−Y1/K1 −→max
Y1
(13)
Lemma 3. (BR of Agent 1).15 The best-response function of Agent 1, BR
1 ≡C1∗(C2), has
the following form:
C∗
1(C2) =
(
K11/σ+θC2, if C2 6Cb2;
Cd
1(C2), if C2 >Cb2,
(14)
where
b
C2 ≡
K11/σ
θ(τ −1) and Cd
1(C2) is implicitly given by
C1−θC2 =ψ·
C1
C1+θC2
1/σ
, ψ ≡
1 +τ τ K1
1/σ
. (15)
The function Cd
1(C2) is strictly increasing and convex.
15As follows from the proof of Lemma 3, ifτ <1, it is never optimal for Agent 1 to engage in
The best response function of Agent 1, depicted in the right panel of Figure 2, consists of two segments. If the output of Agent 2 is low enough, Agent 1 prefers to catch up peacefully without causing destruction. This is the KUJ case. If, however, Y2 is too high,
second-stage destruction substitutes for some of the first-stage investment.
Depending on parameter values, the envy game may end up in three different types of equilibria which we consider in turn.
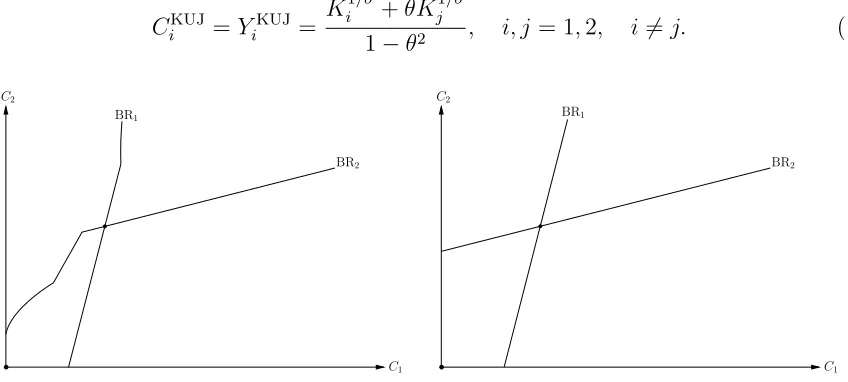
1. Keeping up with the Joneses equilibrium (KUJE). This equilibrium would always emerge if destruction were not possible (right panel of Figure 3). Its features are well-known in economics literature and have been formally analyzed by Frank (1985) and Hopkins and Kornienko (2004), among others. In the present model it arises when the “competitive segments” of the best response functions intersect (left panel of Figure 3) and is given by
CiKUJ=YiKUJ = K
1/σ
i +θK
1/σ j
1−θ2 , i, j = 1,2, i6=j. (16)
BR2
C1 C2
BR1
BR2
C1 C2
[image:14.612.92.516.289.480.2]BR1
Figure 3: KUJE in the envy game with (left) and without (right) the second stage.
2. Fear equilibrium (FE). In this case the richer agent constrains his first-stage invest-ment to avoid destructive envy in the second stage of the game. He consumes right at the point that makes it not optimal for the poorer agent to engage in destruction. This equi-librium resembles the fear of envy documented in many developing societies, as discussed in section 2.16 It arises when the “fear segment” of BR
2 intersects BR1 at the kink point
(left panel of Figure 4) and is given by
C1F =Y1F = τ K
1/σ
1
τ −1, C
F
2 =Y2F =
K11/σ
θ(τ −1). (17)
16Mui (1995) constructs a theoretical framework in which technological innovation may not be adopted
3. Destructive equilibrium (DE). In this equilibrium it is not optimal for Agent 2 to reduce effort to completely avoid destructive envy and he accommodates some of it. Equilibrium consumption levels are implicitly given by the system of equations
(
CD
2 =C2d(C1D),
CD
1 =C1d(C2D).
(18)
BR2
C1 C2
BR1
BR2
C1 C2
[image:15.612.90.521.141.350.2]BR1
Figure 4: Fear (left) and destructive (right) equilibria.
The right panel of Figure 4 shows a generic destructive equilibrium, which occurs at the intersection of “destructive segments.” It follows from the properties of Cd
2(C1) and
Cd
1(C2) that they can only intersect once (see the proof of Proposition 1).
The following proposition provides a full taxonomy of equilibria in terms of the three main parameters of the model: λ, the initial level of inequality (economic environment),
τ, the degree of property rights protection (institutional environment), andθ, the strength of social comparisons (cultural environment).
Proposition 1. (Equilibrium of the envy game). There exists a unique subgame perfect
equilibrium of the envy game. Denote k ≡ K1/K2. Then, if k > ˜k, it is the KUJ
equilibrium (16). If ˆk 6 k < k˜, it is the fear equilibrium (17). Finally, if k < ˆk, it is the destructive equilibrium (18). The threshold values for k are given by
˜
k ≡
θ(τ−1) 1−τ θ2
σ
, kˆ≡ (1 +θ
2)
2 ·
θ(τ−1) 1−τ θ2
σ
<k <˜ 1. (19)
This result can be expressed in terms of regions forλ,τ, andθ, with the relevant thresholds uniquely determined by (19).
and/or the tolerance for inequality is high, that is, property rights are well-protected and social comparisons are not strong. In the opposite case, destructive envy is in action and either fear or destructive equilibrium arises. It is important to emphasize that the three parameters of interest jointly determine the type of equilibrium. For instance, just having low inequality is not enough to obtain the KUJE. If, at the same time, institutions are very weak (destructive technology is efficient) and/or relative standing concerns are very strong, the economy may still end up in the fear or destructive equilibrium.
3.3
Comparative statics
The next issue to address is how the parameters of interest affect economic performance (measured by final outputs) across different equilibria.
As follows from (16), in the KUJ equilibrium outputs do not depend on τ since de-structive envy is not binding. The effect of θ is straightforward: increasing the strength of relative concerns in the KUJ equilibrium acts as additional incentive to work, which leads to higher levels of effort and output.
The effect of raising λ (increasing equality) on aggregate output depends crucially on
σ. Equations (1) and (16) imply that the total output is
YKUJ=Y1KUJ+Y2KUJ =
λ1/σ+ (1−λ)1/σ 1−θ K
1
σ. (20)
Under baseline assumption σ > 1, it is a strictly concave and increasing function of λ. Concavity of output in endowments seems more natural than a kind of nondecreasing returns to scale that would emerge under σ61.
The total effect of redistribution on private outputs consists of two parts: wealth effects and comparison effects. Wealth effects are just the direct effects of making one agent poorer and the other richer. In case of increasing λ the wealth effect is positive for Agent 1 and negative for Agent 2. The total wealth effect on output is positive since under concave outputs the poor agent is more productive on the margin. Comparison effects reflect the fact that the reference group becomes poorer for Agent 1 and richer for Agent 2. Consequently, comparison effect is negative for Agent 1 and positive for Agent 2. The total comparison effect has the same sign as the total wealth effect. In particular, under
σ > 1, the negative comparison effect on the output of the poor is outweighed by the positive comparison effect on the output of the rich.
decreases the tolerance of Agent 1 for inequality and aggravates the “fear constraint” of Agent 2. This means that with higher τ Agent 2 has to produce less to avoid destructive envy which leads to lower total output given by
YF =Y1F+Y2F = 1 +τ θ
θ(τ−1)(λK)
1
σ. (21)
The effect of raising θ is similar since it, too, decreases the tolerance for inequality. This is in stark contrast with the role of positional concerns in the KUJ equilibrium. In the latter case it acts as additional incentive to work, while in the fear equilibrium it constrains productive effort by increasing the hazard of destructive envy. On the other hand, the effect of raising equality in the fear equilibrium is unambiguously positive, as it is in the KUJE. Increasing λ means a positive wealth effect for Agent 1 which translates into higher output of Agent 2. That is, redistribution from the rich to the poor increases investment and final output by alleviating the fear of envy constraint.
Destructive equilibrium is harder to analyze analytically. Multiple effects are at work which makes the aggregate comparative statics with respect toθambiguous. If inequality is high or tolerance for inequality is low, stronger envy leads to substantial destruction which may lower the consumption of Agent 2, as well as total final output,C (left panel of Figure 6). In contrast, if the destructive environment is not severe (orσ, the catching-up propen-sity, is high), the stimulating effect of envy dominates (right panel of Figure 6). Thus, comparative statics in the DE combines the features of the FE and the KUJE. Moreover, it can be shown that higherτ and lowerλunambiguously decrease total consumption. The following proposition summarizes the comparative statics results.
Proposition 2. (Comparative statics of the envy game).
1. KUJE:
(a) ∂Y /∂λ >0; ∂Y1/∂λ >0; ∂Y2/∂λ >0 iff θ >[(1−λ)/λ]
1−σ
σ .
(b) ∂Y /∂θ >0;∂Yi/∂θ >0. (c) ∂Y /∂τ =∂Yi/∂τ = 0. 2. FE:
(a) ∂Y /∂λ >0; ∂Yi/∂λ >0;
(b) ∂Y /∂θ <0;∂Y1/∂θ = 0; ∂Y2/∂θ < 0;
(c) ∂Y /∂τ <0;∂Yi/∂τ <0.
3. DE:
(a) ∂C/∂λ > 0;∂C1/∂λ >0; ∂C2/∂λ≶0;
(b) ∂C/∂θ ≶0;∂C1/∂θ >0; ∂C2/∂θ≶0;
λ C
˜
λ λˆ
0 0.5 τ
C
ˆ
τ τ˜
[image:18.612.88.512.85.246.2]1 1/θ
Figure 5: Inequality (left), property rights (right), and economic performance.
θ C
ˆ
θ ˜θ
0 1/τ θ
C
ˆ
θ θ˜
0 1/τ
Figure 6: Concern for relative standing and economic performance.
Proposition 2 makes clear that the mechanics of the qualitatively different equilibria of the envy game may imply contrasting comparative statics. Stronger envy is detrimental for economic performance in the fear equilibrium, increases total output under the KUJ-type competition, and has an ambiguous effect in the DE. Higher inequality has a negative effect across all equilibria types. Well-protected private property rights are conducive to economic performance in both the FE and the DE and play no role beyond the KUJE threshold. Overall, Proposition 2 establishes the relationship between aggregate economic performance and the parameters of the model, reflecting the economic, institutional, and cultural environment (see Figures 5 and 6).
[image:18.612.94.514.289.444.2]4
Welfare, property rights, and inequality
In this section we focus on the KUJE and the FE to conduct a comparative welfare analysis. We start by analyzing how an institutional change affects the welfare of individuals. Then we show how it is affected by ex-ante redistribution of endowments.
The connection between the emergence of property rights and externalities was famously considered by Demsetz (1967). He argued that an important function of property rights is to internalize externalities, and institutional change in this domain is intended to cope with new externality problems. In the context of the present theory it is the consumption externality that makes institutions matter. As shown below, it is not the emergence of property rights protection but its demise that may internalize this externality.
Consider the following thought experiment. Assume that the agents start in the fear equilibrium. Would they want to accept a lower value of τ that would move them to the KUJ equilibrium? The following proposition provides conditions under which the agents will (not) want to adopt such institutional change.
Proposition 3. Let ˆk 6 k < k˜, that is, agents are in the FE. Then, ∃! ¯θ ∈ (0,1) such that: 1) Ifθ >θ¯, adopting a (lower)τ that would bring up the KUJ equilibrium is a Pareto worsening; 2) If θ 6 θ¯, ∃! ¯k(τ) ∈ [ˆk,˜k), such that adopting such τ is a Pareto worsening if and only if k > ¯k. Furthermore, private outputs in the initial FE are always lower than those that would have been achieved by improving the property rights protection.
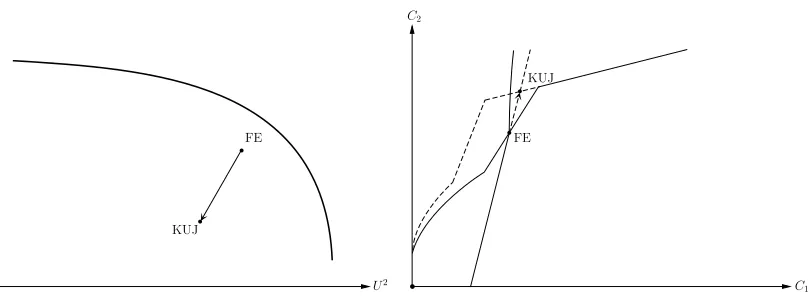
The intuition for this result is simple and revolves around the negative effect of posi-tional externality on social welfare. As shown in the proof of the above proposition, Agent 1 always prefers the FE. In particular, he maintains the same level of relative consumption in the two equilibria, but the amount of effort he has to exert to do that is always lower in the FE. The rich agent prefers to stay in the FE if only if in the alternative KUJE he would have to work too hard to support his relative standing. That would be the case if either social comparisons are strong (θ is high) or inequality is low (k is large). Under these conditions the FE is Pareto dominant since the fear of destructive envy restrains effort and curbs the consumption externality that otherwise leads to overworking in the KUJ equilibrium. Thus, worse property rights protection corrects the distortion caused by positional concerns.17
17Curiously, this is akin to the effects of Pareto improving redistributive taxation schemes suggested in
U2 U1
FE
KUJ
C1 C2
[image:20.612.103.508.84.234.2]FE KUJ
Figure 7: From FE to KUJE: Improving the property rights protection.
Figure 7 illustrates the case, in which moving from FE to KUJE is a Pareto worsening (left panel) in spite of increased private outputs (right panel).18 The result that both
agents can be better off in an equilibrium with lower consumption is reminiscent of what Graham (2010) calls the “paradox of happy peasants and miserable millionaires” and the related research in happiness economics.19 It is instructive to read Proposition 3 in the
“reverse” order, assuming that initially agents are in the KUJ equilibrium.
Proposition 3′. Let k >k˜, that is, agents are in the KUJE. Then, ∃! ¯θ ∈ (0,1) such
that: 1) Ifθ >θ¯, adopting a (higher)τ that would bring up the FE is a Pareto improvement; 2) If θ6θ¯,∃! ¯k(τ)∈[ˆk,˜k), such that adopting suchτ is a Pareto improvement if and only if k > k¯. Furthermore, private outputs in the initial KUJE are always higher than those that would have been achieved by distorting the property rights protection.
Taken literally, Proposition 3′ may be seen as a formalization of a more than a
century-old argument raised by Veblen (1891) in an attempt to explain the support for socialist movement, specifically, for the abolition of private property rights. Veblen argued that such support was driven by the competitive envy of a consumer society (p. 65–66): “The ground of the unrest with which we are concerned is, very largely, jealousy, – envy, if you choose: and the ground of this particular form of jealousy that makes for socialism, is to be found in the institution of private property.”
18It can be shown that a result similar to Proposition 3 holds in the region corresponding to the fear
equilibrium. In particular, if the strength of positional externality, θ, is high enough, both agents would be better off with higherτ. Yet this does not hold in the destructive equilibrium.
19 While intuitive in a static model, this result need not hold in a dynamic framework. Gershman
Veblen goes on to describe what in the model can be called a transition from the KUJE (“keep up appearances”) to the FE (“socialism”): “The ultimate ground of this struggle to keep up appearances by otherwise unnecessary expenditure, is the institution of private property. . . With the abolition of private property, the characteristic of human nature which now finds its exercise in this form of emulation, should logically find exercise in other, perhaps nobler and socially more serviceable, activities.” He then emphasizes that the abolition of the KUJ competition would lessen the amount of labor and output required to support the economy. This is exactly what happens after transition to the fear equilibrium: output and labor supply fall, individuals enjoy more leisure and are, at least initially, happier with less output (see, however, footnote 19). As discussed above, the rich may prefer well-protected property rights if inequality is high enough, since moving to the FE would mean losing too much in terms of relative standing. Thus, in a KUJE with relatively high inequality there is a conflict of interests, or, in Veblen’s terms, opposite sentiments towards the socialist movement.
If a Pareto improvement can be achieved by increasingτ, can it be accomplished through ex-ante redistribution of endowments from the tich to the poor (increasing k)?
Proposition 4. Let ˆk 6 k < k˜, that is, agents are in the FE. Then: 1) U1
F is strictly
increasing ink; 2) U2
F is either strictly decreasing in k or has a global maximum at
k∗ =
√
1 + 4σδ−1
2σ , δ ≡θ(τ −1)
1−τ θ2
θ(τ −1)
1−σ
,
where ˆk < k∗ < ˜k. Furthermore, if k > ˜k, U2
KUJ is strictly decreasing in k, while UKUJ1 is
strictly increasing in k.
Proposition 4 implies that, while redistribution is always desirable for the poor agent, from the point of view of the rich agent it can only be beneficial under certain conditions and only to a certain extent. In particular, switching to the KUJE via a decrease in initial inequality cannot result in a Pareto worsening or a Pareto improvement, since the poor always win while the rich always lose. The big difference between an institutional change analyzed above and an ex-ante redistribution is that in the latter case the rich are actually giving away part of their endowment, lowering their own productivity and increasing the productivity of the poor.
5
Envy and Redistribution
It is not surprising that a common way to deal with destructive envy is through redistribu-tion of various forms. Cancian (1965) and Foster (1979) examine redistributive practices in Latin American peasant societies, such as ceremonial expenditures and sponsorship of religious fiestas by the rich (cargo system). In particular, Cancian (1965, p. 140) suggests that “service in the cargo system legitimizes the wealth differences that do exist and thus prevents disruptive envy.” Platteau (2000, chapter 5) examines similar arrangements in Sub-Saharan Africa and Asian village communities, where “in seeking neighbourer’s good-will or in fearing their envy, incentives operate for the rich to redistribute income and wealth to the poor” (p. 235).
Mui (1995, section 4) discusses sharing in the emerging market economies of the Soviet Union and China manifested in contributions of the nascent entrepreneurial class to charity or local public goods, which he sees as an attempt to alleviate destructive envy. Mui then goes on to formally show how sharing can support the adoption of innovation in equilibrium. Some authors (Schoeck, 1969; Fern´andez de la Mora, 1987) even see the modern progressive taxation system as a remnant of “egalitarian envy.” Incidentally, using recent survey data from 18 European countries, Clark and Senik (2010) showed that the strength of income comparisons is associated with higher demand for redistribution.
Within the framework of section 3, a natural question is whether the rich would be willing to share the fruits of their effort to avoid destructive envy and how this affects the possible equilibrium outcomes of this modified envy game. Specifically, assume that Agent 2 can make a transfer to Agent 1 before stage 2 begins, as shown in Figure 8.
Consider the node of the game where the rich agent decides on transfer having seen the outcomes of the investment stage. Obviously, non-zero transfer may only be optimal if Y1 < τ θY2, that is, destructive envy is binding. In this case Agent 2 may want to make
a positive transfer T to lower the intensity of destruction, d∗
1.
Given that effort is sunk at this stage, Agent 2 maximizes
v(p∗
2(T)(Y2−T)−θ(1−d∗1(T))(Y1+T))−→max
T s.t. 06T 6
¯
T , (22)
where ¯T ≡ (τ θY2 −Y1)/(1 +τ θ) is the minimum transfer sufficient to completely avoid
destruction.20 Lemma 4 characterizes the optimal transfer of Agent 2.
20Formally, (1−d∗
1)Y1−θp∗2Y2 is positive if and only if Y2/Y1 <(1 +τ)2/4τ θ. Otherwise,U1 =−∞
and Agent 1 is indifferent between any feasible destruction intensities. For concreteness, focus on d∗
1 as
EffortLi OutcomesYi
Stage 1 (Investment, Transfer)
Production/Destructiondi ConsumptionCi PayoffsUi
Stage 2 (Production, Destruction, Consumption)
[image:23.612.80.505.429.529.2]Transfer T
Figure 8: Timing of events in the envy game with transfers.
Lemma 4. (Optimal transfer). ForY1/Y2 6τ θ, the optimal transfer isT = ¯T if and only
if τ θ6(1−θ)/(1 +θ). Otherwise,
T =
(
T∗, if Y
1/Y2 < µ;
0, if Y1/Y2 >µ,
whereT∗ is given by the first-order condition of (22) for the interior solution andµ∈(0, τ θ]
is a constant depending on τ and θ (see the Appendix).
In what follows consider the simple case τ θ 6(1−θ)/(1 +θ). Then, as established in Lemma 4, it is always optimal for Agent 2 to make the full transfer ¯T. Intuitively, the rich individual will be willing to do so if ¯T is low. The next lemma establishes what the best response of Agent 2 looks like under full transfer.
Lemma 5. (BR of Agent 2 with full transfer). The best response function of Agent 2,
BRT2 ≡Y∗
2(Y1), has the following form:
Y∗
2(Y1) =
K21/σ+θY1, if Y1 >Ye1;
Y1·τ θ1, if Y˘1 < Y1 <Ye1;
(γ2K2)1/σ−Y1, if Y1 6Y˘1,
(23)
where
e
Y1 ≡
τ θ
1−τ θ2K 1/σ
2 , Y˘1 ≡
τ θ
1 +τ θ(γ2K2)
1/σ, γ
2 ≡
1−τ θ2
1 +τ θ
1−σ
.
Now, instead of “destructive region” the best response of Agent 2 has a “transfer region” (left panel of Figure 9). For low levels of Y1 it is optimal to prevent destruction through
transfers rather than by producing less in the first stage.
BRT
2
Y1 Y2
˘
Y1 Y1e
BRT
1
Y1 Y2
e
Y2
˘
[image:24.612.110.510.81.231.2]Y2
Figure 9: Best responses in the envy game with transfers.
Lemma 6. (BR of Agent 1 with full transfer). Under parametric conditions (A12) and (A13) provided in the Appendix the best response function of Agent 1, BRT1 ≡Y∗
1(Y2), is
given by
Y∗
1(Y2) =
K11/σ+θY2, if Y2 6Ye2;
(γ1K1)1/σ−Y2, if Ye2 < Y2 <Y˘2;
0, if Y2 >Y˘2,
(24)
where
e
Y2 ≡
σ(γ11/σ−1) (σ−1)(1 +θ)K
1/σ
1 , Y˘2 ≡(γ1K1)1/σ, γ1 ≡
θ(τ−1) 1 +τ θ
1−σ
.
The right panel of Figure 9 depicts this function. Note, in particular, that there is a discontinuity at point Ye2, as it becomes optimal for Agent 1 to switch to the KUJ-type
best response whenY2 is low enough.21
Given the best responses of the agents, two qualitatively different types of equilibria may arise: fear equilibrium with transfers (FT) and KUJ equilibrium. Moreover, as shown in the bottom panels of Figure 10, multiplicity of equilibria cannot be ruled out. Proposition 5 characterizes the equilibria under conditions of Lemma 6 and an additional restriction that guarantees existence of at least one equilibrium for all possible values of k.
Proposition 5. (Equilibria of the envy game with transfers). Assume that ω < γ2/γ1,
where ω≡[σ(1−θ)(γ11/σ−1)/(σ−1)−θ]−σ. Then the envy game with transfers has: 1)
a unique KUJ equilibrium (16) if k > γ2/γ1; 2) a unique fear equilibrium with full transfer
21Under alternative parametric restrictions the best response of Agent 1 consists of only two regions,
of the form
{Y1FT, Y2FT}={0,(γ2K2)1/σ};
{C1FT, C2FT}={ε(γ2K2)1/σ,(1−ε)(γ2K2)1/σ},
(25)
if k < ω, where ε ≡ [τ θ/(1 +τ θ)]; 3) two equilibria (16) and (25) if ω 6 k < γ2/γ1; 4)
multiple equilibria with full transfer of the form
{Y1FT, Y2FT}={Y1FT,(γ2K2)1/σ−Y1FT}, 06Y1FT 6Ye2;
{C1FT, C2FT}={Y1FT+ ¯T , Y2FT−T¯}, (26)
if k =γ2/γ1, along with a KUJ equilibrium.
BRT
2
Y1 Y2
BRT
1
KUJ
Y1 Y2
BRT
1
FT BR
T
2
BRT
2
Y1 Y2
BRT
1
FT
KUJ
Y1 Y2
BRT
2
Y1 Y2
BRT
1
FT
[image:25.612.97.515.233.560.2]KUJ
Figure 10: Equilibria in the envy game with transfers.
create a credible threat to destroy. This type of equilibrium arises when initial inequality is high. In contrast, if it is low, the only possible outcome of the game is the standard KUJ equilibrium. It is easy to see that bothγ2/γ1 and ω are increasing inτ and θ, that is,
reducing tolerance for inequality increases the likelihood of the redistributive equilibrium. This is intuitive and parallels the taxonomy of equilibria in Proposition 1.
Interestingly, the possibility of transfers gives rise to (stable) multiple equilibria for intermediate levels of inequality (bottom panels of Figure 10). This implies that societies with similar characteristics and moderate wealth differences may end up in one of the two alternative equilibria: one with redistribution and fear of destructive envy and the other with KUJ-type competition. The following proposition highlights the contrast between the two equilibria.
Proposition 6. Assume that ω < k < γ2/γ1, that is, the envy game with transfers
has an FT equilibrium (25) and a KUJ equilibrium (16). Then, the FT equilibrium is characterized by: 1) higher ex-post inequality, that is, CFT
1 /C2FT < C1KUJ/C2KUJ; 2) lower
total output, that is, YFT
2 < YKUJ. Moreover, 3) UKUJ2 > UFT2 , while UKUJ1 > UFT1 if and
only if (1−θ2)γ
1γ2(1−σ)/σk >(σ−θ2)k1/σ+θ(σ−1).
Curiously, the FT equilibrium is more unequal ex post than the KUJE. That is, com-petitive envy turns out to be more effective in narrowing the gap between the rich and the poor than redistribution under the threat of destructive envy. The second part of Proposition 6 is intuitive. In the KUJE, positional externality makes both agents work hard and leads to high total output. In FT equilibrium, the poor agent does not work at all to create a threat of destructive envy, while the rich provides consumption for both.
6
Envy and the Dynamics of Inequality
So far, the analysis has focused on the equilibria of the static model in which inequality of endowments was taken as fixed. In this section intergenerational links are introduced in the basic model of section 3 to explore the dynamics of inequality driving the endogenous evolution of the economy through different envy regimes.
Environment. The economy is populated by a sequence of non-overlapping genera-tions, indexed by t > 0. Time is discrete, and each generation lives for one period. The initial population consists of 2 homogeneous groups of people (representative agents), the poor and the rich, with initial endowmentsK10andK20> K10. Each person has 1 child, so
that in each time period two groups of people are descendants of the two original groups. Parents care about their children and leave bequests,bit, i= 1,2, at the end of each period
t.22 In particular, they derive utility not just from relative consumption but the relative
Cobb-Douglas aggregator of consumption, now denoted cit, and bequest, bit:
Uti = π(c
1−α
it bαit−θcjt1−αbαjt)1−σ
1−σ −Lit, (27)
where i, j = 1,2, i 6= j, 0 < α < 1 parameterizes the fraction of final output allocated to bequest, andπ≡[(1−α)1−ααα]σ−1 is a normalization constant. Consumption and bequest
are made out of the final output, Cit, so that bit+cit = Cit. This formulation leaves the workings of the basic model from section 3 intact while introducing dynamic linkages.
Dynamical system. The initial endowment of generation t+ 1, Kit+1, is assumed to
depend on the endowment of their parents and parental investment in children:
Kit+1 =Kitβbit =KitβαCit, (28) where i = 1,2, and 0 < 1 −β < 1 is the rate of geometric depreciation of parental endowment.23 Note that Proposition 1 holds each periodt, and the level of initial inequality
in period t+ 1 is determined endogenously:
kt+1 ≡
K1t+1
K2t+1
=kβt · C1t C2t
, (29)
given the initial condition 0< k0 <1. The joint dynamics of K1t and K2t depends on the type of equilibrium, in which the economy resides, and the equilibrium next period is, in
22These bequests may represent any kind of investment in children that increases the productivity of
their effort, for example, expenditure on human capital.
turn, determined by the economic outcomes of the current period. Lemma 7 characterizes this dynamical system and follows directly from Proposition 1 and the law of motion (28).
Lemma 7. (Dynamics of endowments). The two-dimensional dynamical system for K1t and K2t is given by
"
K1t+1
K2t+1
# = α
1−θ2[K
β
1t(K
1/σ
1t +θK
1/σ
2t ), K β
2t(K
1/σ
2t +θK
1/σ
1t )], if kt>˜k; α
θ(τ−1)[τ θK 1/σ+β
1t , K β
2tK
1/σ
1t ], if kˆ6kt<k˜;
α[K1βt·CD
1 (K1t, K2t), K2βt·C2D(K1t, K2t)], if kt<k,ˆ
(30)
where CD
1 (K1t, K2t) and C2D(K1t, K2t) are the final outputs in the DE given by (18). The thresholds ˜k and ˆk divide the (K1t, K2t) phase plane into three regions according
to the types of equilibria (see Figures 11 and 12): KUJ, F (fear), and D (destruction). In each of these regions the motion is governed by the corresponding part of the dynamical system (30). To rule out explosive dynamics it is assumed throughout this section that
σ(1−β)>1 which also implies that the results of all previous sections hold, since σ >1. It is convenient to analyze a companion one-dimensional difference equation driving the dynamics of inequality. Some of its properties are established in the following lemma.
Lemma 8. (Dynamics of inequality). The dynamics of kt is given by
kt+1 =
g1(kt)≡[k1t/σ+β+θk β
t]/[1 +θk
1/σ
t ], if kt>˜k;
g2(kt)≡τ θktβ, if ˆk6kt <k˜;
g3(kt), if kt<ˆk,
(31)
where g3(kt) is implicitly given by
kt =
τ(1 +θ2)
2θ(1 +τ)2 ·
(zt+1+θ)2
zt+1 ·
zt+1−θ
1−θzt+1
σ
, zt+1 ≡kt+1/kβt. (32) Moreover, kt+1 > kt for all 0< kt <1.
Further analysis focuses on the dynamics of the system in the fear region and the KUJ region. The two lemmas below provide a characterization.
Lemma 9. (KUJ region dynamics). The system converges to a unique stable “equal” long-run steady state ¯KKUJ
1 = ¯K2KUJ = ¯K = [α/(1−θ)]
σ
σ(1−β)−1. The steady-state levels of
output are equal to ¯YKUJ
1 = ¯Y2KUJ = ¯Y = ¯K1/σ/(1−θ). The evolution of endowments is
determined by the loci
∆Ki ≡Kit+1−Kit = 0 : Kit1/σ+θK
1/σ jt =K
1−β
K2t K1t
˜ k
ˆ k
∆K2= 0
∆K1= 0
KUJ
F
D S
K2t K1t
˜ k
ˆ k ∆K2= 0
∆K1= 0
KUJ
F
D ¯
K1 S
[image:29.612.95.508.89.262.2]′
Figure 11: Dynamics and steady states in the KUJ (left) and fear (right) regions.
Figure 11 (left panel) depicts schematically the dynamics in the KUJ region. The descendants of the initially poor eventually catch up with the rich dynasty, and in the steady state both have the same endowments.
Lemma 10. (Fear region dynamics). In the fear region the system moves towards a unique stable “unequal” long-run steady state ¯K1 = [ατ /(τ −1)]
σ
σ(1−β)−1, ¯K2 = ¯K1 ·(τ θ) 1
β−1. The
corresponding levels of output are ¯Y1 = [τ /(τ −1)] ¯K11/σ and ¯Y2 = ¯K11/σ/[θ(τ −1)]. This
steady state is, however, unattainable, since it is located in the KUJ region, that is, the system moves to the KUJ region before reaching the fear steady state. The evolution of endowments is determined by the loci
∆K1 = 0 : K1t = ¯K1 = [ατ /(τ −1)]
σ σ(1−β)−1;
∆K2 = 0 : K1t =K2σt(1−β)·[θ(τ −1)/α]σ.
Figure 11 (right panel) depicts schematically the dynamics in the fear region. It is instructive to look at the comparative statics of the long-run levels of output with respect toτ andθ. They resemble the results of the static model: in the KUJ steady state, outputs are increasing inθand independent ofτ; in the (unattainable) fear steady state, the output of group 1 is independent ofθand decreasing inτ while the output of group 2 is decreasing inθ and τ. Note also that, despite their qualitatively different nature, as τ θ→1, the two long-run equilibria get closer and coincide in the limit.
Proposition 7. (Long-run convergence). Starting with any initial conditions{K10, K20},
such that 0< k0 <1, the endowments converge to a unique stable long-run “equal” steady
state of the KUJ region, ¯K. Inequality decreases monotonically along the transition path.
K2t
K1t
˜ k
ˆ k KUJ
F
D S′
[image:30.612.171.433.162.387.2]S
Figure 12: Evolution through envy regimes.
Thus, if the economy starts off, say, in the destructive region, it experiences a transition to the KUJ steady state, possibly passing through the fear region and staying there for a while. Initially, destructive envy and the fear of it reduce original inequality of endowments by discouraging productive effort of the rich or destroying part of their output. This leads to more equal investment opportunities for future generations who eventually find it optimal to compete productively. Envy-avoidance behavior, dictated by the destructive side of envy, paves the way to emulation, driven by its competitive side.
The transitions from one envy region to another can be delayed or accelerated by factors that affect the intensity of social comparisons, such as religion and ideology in general.24 In
the context of the model, religious and moral teachings condemning envy may be thought of as causing downward pressure onθ. Assume that the economy is in the fear region and
θ falls. Then, as follows from Proposition 2, outputs will rise because the fear constraint of
24All major world religions denounce envy. In Judeo-Christian tradition envy is one of the deadly sins
kt
kt+1
1 1
k0
D F KUJ
ˆ
k ˜k kt
kt+1
1 1
F′
˜ k
[image:31.612.98.510.85.288.2]k0 ˆk
Figure 13: Dynamics of inequality under low (left) and high (right) τ.
the rich is alleviated permitting higher effort without fear of destructive envy. Moreover, as follows directly from (19), a fall inθ lowers the inequality threshold ˜k contributing to a faster transition from FE to KUJE. As the economy enters the KUJ region, destructive envy turns into emulation, and changes in θ have an opposite impact on economic performance. In the KUJ region the same factors that drive the society out of the fear equilibrium by reducing the strength of envy have a negative effect on output.
An example of an ideology affecting θ is that of material egalitarianism. The concept of everyone being equal and the neglect of private property rights are effective in fostering social comparisons and lowering tolerance for inequality. Hence, this ideology operates in favor of the destructive side of envy and delays the transition to the KUJE.
7
Concluding remarks
This paper develops a unified framework for the economic analysis of envy by capturing its two main forces, destructive and competitive. The role of envy in society is determined in equilibrium by the level of fundamental inequality and the endogenous tolerance threshold shaped by the quality of institutions and the strength of positional concerns.
The qualitatively different equilibria that arise in this framework are broadly consistent with the available evidence on the implications of envy for economic incentives. The “keeping up with the Joneses” equilibrium roughly corresponds to modern economies, in which emulation is the main driver of consumer demand. The “fear equilibrium” resembles the role of envy in developing countries, where the fear of envious retaliation prevents productive investment and retards progress. The different nature of these equilibria yields contrasting comparative statics with respect to the strength of positional concerns. In the KUJ equilibrium, envy enhances production by intensifying emulation, while in the fear equilibrium it reduces output by aggravating the fear constraint.
The model sheds new light on the interplay between institutions, welfare, and economic performance. First, while better institutions can move the society from the low-output fear equilibrium to the high-output KUJ equilibrium, such change need not be welfare enhancing if it triggers the “rat race” competition. Second, transfers can be used to avoid envy-motivated destruction in equilibrium, which is in line with the evidence on the role of redistributive mechanisms in developing societies.
A dynamic extension of the model explores the evolution of the economy through differ-ent envy regimes. Starting at any initial conditions, the economy converges to the long-run KUJ steady state, driven by the decline of inequality along the transition path. This tran-sition can be delayed or accelerated by factors that affect the strength of social comparisons and the relative attractiveness of productive and destructive effort.
Appendix
Proof of Lemma 1. As follows from (7),d∗
2 = 0 iffY2/Y1>τ θ(1−d1)(1 +τ d1). This clearly holds, if
d1= 0, sinceτ θ <1 andY2> Y1. Ifd1= ( p
τ θY2/Y1−1)/τ >0, the above inequality is equivalent to r
Y2
Y1 >
θ(1 +τ)√τ θ
1 +τ θ2 .
SinceY2> Y1, this holds, if the right-hand side is less or equal than unity, that is,θ √
τ θ6(1+τ θ2)/(1+τ).
Since τ <1/θ, sup{θ√τ θ} = inf{(1 +τ θ2)/(1 +τ)} =θ. Hence, θ√τ θ 6(1 +τ θ2)/(1 +τ), given that
τ θ <1 andY2> Y1, and Lemma 1 gives the unique second-stage equilibrium.
Proof of Lemma 2. Agent 2 is solving (10) subject to (8) and (9). Consider first the caseτ θY26Y1, in
whichd∗
1= 0 and
U2=(Y2−θY1)
1−σ
1−σ − Y2
K2
.
It is strictly concave inY2, and the first-order conditions yield the following optimum:
Y2= (
K21/σ+θY1, if Y1>Ce1;
Y1·τ θ1, if Y1<Ce1,
(A1)
whereCe1is defined in Lemma 2. That is, the left derivative ofU2at pointY2=Y1/τ θis positive (negative)
iffY1<Ce1(Y1>Ce1). Next, consider the destructive case,τ θY2> Y1, in which, as follows from (8)-(10),
U2= 1 1−σ ·
r
Y1Y2
τ θ ·(1 +θ
2)
−θ(ττ+ 1)Y1 !1−σ
−KY2 2
.
Again,U2is strictly concave inY
2, and the interior optimum is uniquely defined by the first-order condition r
Y1Y2
τ θ ·(1 +θ
2)−θ(τ+ 1)
τ Y1
!−σ
· 1 +θ 2
2√τ θ ·
r Y1 Y2 ! − 1 K2
= 0. (A2)
It follows that the right derivative ofU2at pointY
2=Y1/τ θis positive (negative) iffY1<Cb1(Y1>Cb1),
where Cb1 is defined in Lemma 2 andCb1 <Ce1, since 0< θ <1. Hence, allowing destruction is the best
response iffY1<Cb1.
To rewrite (A2) in terms of consumption note that if destruction takes place
C1= (1−d∗1)Y1=
1 +τ τ Y1−
r
θ τY1Y2;
C2=p∗2Y2= r
Y1Y2
τ θ .
=⇒
Y1=
1 +τ
τ (C1+θC2);
Y2=θ(1 +τ)· C 2 2
C1+θC2.
(A3)
Substituting this into (A2) yields (12). Next, applying the implicit function theorem to (12) gives
dC2
dC1 =
θ+ 1 σ·
C2−θC1 C1+θC2
1 + 1 σ ·
C2−θC1 C1+θC2 ·
C1 C2
>0, (A4)
since the optimal response requiresC2> θC1. The latter also implies thatdC2/dC1< C2/C1. Finally,
d2C 2
dC2 1
=
σ+C2−θC1
C1+θC2 ·
C1
C2 −1
· C2−C1· dC2 dC1
C2(C1+θC2)· (1 +θ
2)C
1dCdC21 −C2
C1+θC2 − dC2
dC1(C2−θC1)
C2