Quantification by Signal to Noise Ratio of Active Infrared
Thermography Data Processing Techniques
R. Hidalgo-Gato, J. R. Andrés, J. M. López-Higuera, F. J. Madruga Photonic Engineering Group, University of Cantabria, Cantabria, Spain
Email: hidalgor@unican.es
Received April 27, 2013; revised May 31, 2013; accepted July 4, 2013
Copyright © 2013 R. Hidalgo-Gato et al. This is an open access article distributed under the Creative Commons Attribution License, which permits unrestricted use, distribution, and reproduction in any medium, provided the original work is properly cited.
ABSTRACT
In this paper, the use of a signal to noise ratio (SNR) is proposed for the quantification of the goodness of some selected processing techniques of thermographic images, such as differentiated absolute contrast, skewness and kurtosis based algorithms, pulsed phase transform, principal component analysis and thermographic signal reconstruction. A new hy- brid technique is also applied (PhAC—Phase absolute contrast), it combines three different processing techniques: phase absolute contrast, pulsed phase thermography and thermographic signal reconstruction. The quality of the results is established on the basis of the values of the parameter SNR, assessed for the present defects in the analyzed specimen, which enabled to quantify and compare their identification and the quality of the results of the employed technique.
Keywords: Image Processing; Infrared Thermography; Nondestructive Testing; Active Thermography; SNR
1. Introduction
Non-destructive testing (NDT) of materials using infra- red thermography enable to quickly and reliably analyze them, regardless of size or shape, without permanently altering their physical, chemical or mechanical properties. Non-destructive testing using active infrared thermogra- phy provides information on material, structure, physical and mechanical properties and discontinuities and defects present on the analyzed specimen [1]. This information is obtained from analyzing the resulting thermograms; this analysis has three phases: pre-processing, processing and analysis of results [2,3]. The selection of the processing techniques that will be used depends on the objectives and needs of the study. This paper is focused on the auto- mation of the comparative study of the techniques proc- essing thermographic sequences obtained in non-destruc- tive testing using active infrared thermography. This au- tomation process is based on the quantification of good- ness through the signal to noise ratio (SNR) of some of the main processing techniques (DAC, PPT, PCT, TSR, PhAC, Skewness and Kurtosis) employed in thermal se- quence analysis [4-6].
2. Processing Techniques
There is a large number of image processing techniques in NDT using active infrared thermography; their appli-
cation depends on the characteristics and objectives of the study. Most of the algorithms of the different proc- essing techniques have been created for pulsed active thermography testing since it is the most employed tech- nique. However, adapting and modifying the algorithms, they can be applied to the other existing techniques. These techniques can be mainly classified in three groups: techniques using thermal contrast [6], techniques based on transforms [3] and techniques using statistical meth- ods [7,8]. Some of the main techniques of these groups will be explained below.
2.1. Thermal Contrast
Differential Absolute Contrast (DAC)
Processing technique using differential absolute contrast (DAC) was developed as a solution for the limitation of the absolute thermal contrast technique, which is defined by the difference between the temperatures of a defective area Td and a soundarea Tsa [9], where the obtained re-
and reducing the effects of the non-uniform heating on the surface. The limitation in the selection process of t’ is removed with the automation method designed for this technique (IDAC) [3].
2.2. Transforms
2.2.1. Pulsed Phase Thermography (PPT)
Pulsed phase thermography is a processing technique for image sequences captured by active infrared thermogra- phy that enables to change from time domain to fre- quency domain [10] the signal of the thermal response of the sequence, that is one-dimensionally defined, on the base of discrete Fourier transform (DFT), Analyzing the time evolution of the image sequence using PPT, one-di- mensional Fourier transform is applied to each pixel of the image sequence, obtaining two new image sequences: amplitude and phase. Image sequences of amplitude and phase are symmetrical about the frequency f = 0 Hz, making redundant the half of the resulting data, which enables to reduce the calculation time necessary for pro- cessing. Among the sequences resulting from applying PPT, the phase sequence or phasegram should be high- lighted since this component is the less affected one by the effects of signal degradation [11] and enables to es- timate the depth of the defects existing in the specimen. The calculation of the defect depth is given by the blind frequency, where, on the base of the phase contrast defi- nition, the defect phase and the soundarea curves cross.
2.2.2. Principal Component Thermography
Processing technique for thermal image sequences using principal component thermography (PCT) is based on re- ducing the information from the singular value decom- position to compactly extract spatial and temporal infor- mation of the image sequence using orthogonal empirical functions or EOF [12]. Before applying decomposition, the 3D-matrix of the image sequence is transformed in a 2D matrix. Each sequence image is transformed from 3D to 2D. The columns contain the temporal dimension and the rows contain the spatial dimension, so the complete sequence will be a 3D-matrix (Nx × Ny × Nt with Nt =
total number of images). In the matrix A decomposition, U columns represent the empirical orthogonal functions (EOF) describing the spatial variations, and VT columns
represent the main components of the temporal varia- tions.
2.3. Statistical Techniques
2.3.1. Signal Reconstruction
Processing techniques based on statistical methods in- clude signal reconstruction from polynomials or TSR, used especially in noise filtering and data reduction [2]. This technique has its origin in the Fourier’s one-dimen-
sional heat-transfer equation on a semi-infinite surface that has been previously subject to thermal excitation (Dirac delta) [3]. This equation models the evolution of the surface temperature of a non-defective pixel in its logarithmic scale in line with slope 1 2. The thermal evolution of a pixel can be modeled using a polynomial of degree N, as follows:
2
N
0 1 2 N
Ln t a a Ln t a Ln t a Ln t (1) So, image sequence information is reduced to the num- ber of the coefficient of regression of the polynomial used in the reconstruction.
2.3.2. Skewness
The processing technique using skewness enables to summarize the whole sequence in one image (skewgram), containing the third central moment values or skewness of the thermal evolution of each pixel [7]. So the good- ness of the data adjustment is determined in reference to a specific type of distribution, highlighting the presence of possible defects and inhomogeneities of the specimen.
2.3.3. Kurtosis
As the previous technique, the Kurtosis-based processing technique enables to gather in one image (kurtogram) the image sequence information containing the values of the forth statistical moment (kurtosis) of the thermal evolu- tion of all the pixels of each image of the original se- quence [8].
The fourth statistical moment is defined as the meas- urement that reflects the degree in which distribution reaches a peak, providing information on the height of the distribution related to the value of its standard devia- tion. According to the derivative of a standard distribu- tion, kurtosis (K) value is classified in: mesokurtic (stan- dard distribution with K = 0), leptokurtic (high degree of peakedness, K > 0) and platykurtic (low degree of peak- edness, K < 0) [5]. Applying this processing technique, it is possible to estimate kurtosis values for each pixel, cre- ating a kurtogram with the information of the location of eventual surface defects and their thermal diffusivity.
2.4. Hybrid Technique
Phase Absolute Contrast (PhAC)
data are subtracted, which simplifies the further process- ing, where the differential absolute contrast is applied to the resulting sequence using as reference the thermogram previous to the appearance of the first defect. Figure 1
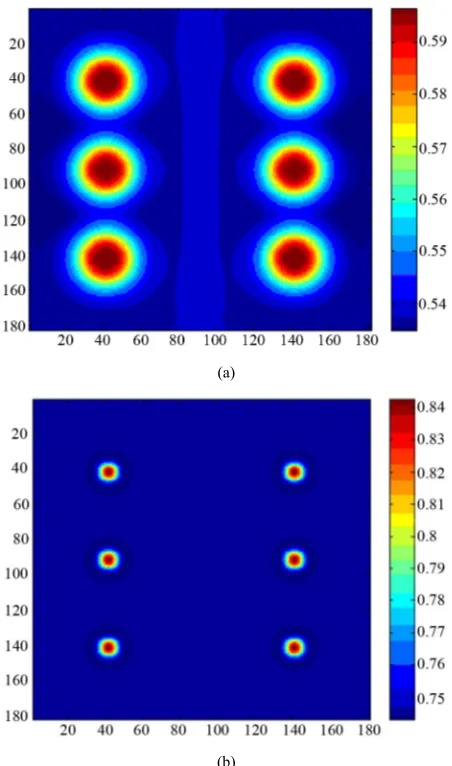
shows the differences in the evolution of the thermal re- sponse when applying these techniques to a synthetic se- quence modeled with the software ThermoCalc® with 6
[image:3.595.310.536.82.465.2]defects (air) at the same depth (see Figure 2). As seen in Figure 1, the results obtained with PhAC enable to in-
crease the level of contrast between a defective area and a soundarea, which allows a better identification and ana- lysis of the existing defects of the specimen (see Figure 2).
3. Analysis and Results
3.1. Signal to Noise Ratio
Signal to noise ratio analysis applied to each processing technique mentioned above enables to determine which algorithm is more appropriate, depending on the applica-
(a)
(b)
Figure 1. Evolution of the thermal response for phase (a) and phase absolute contrast (b) calculation.
(a)
(b)
Figure 2. Thermograms resulting from phase (a) and PhAC (b) calculation.
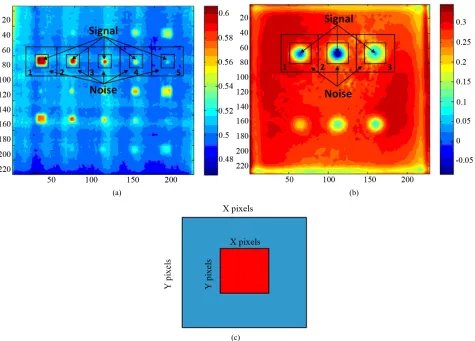
tion. SNR describes the contrast between a defective area and its neighbourhood, establishing a dynamic range measured in decibels (dB). For this purpose, two areas for each defect are selected: an area in the defect that will be considered as “signal” (sarea) and an area around the defect defined as “noise” (narea) (see Figure 3). The
calculation of the SNR value comes from:
mean mean
10abs Sarea Narea S
SNR 20 log dB
N
(2) where σ is the standard deviation of the noise and Sareamean and Nareamean are the average values of each
area, respectively [13].
[image:3.595.60.284.341.703.2] [image:3.595.314.539.596.634.2]neighbourhood, but it does not affect to the result due to the absolute value calculation.
3.2. Results
The quantification analysis using signal to noise ratio was applied to the results obtained when using the se- lected image processing techniques (DAC, PPT, PCT, TSR, PhAC, Skewness and Kurtosis) in four specimens (see Figures 4 and 5). The three CFRP (carbon fiber) and
the PLEXI014 (plexiglas) specimens were tested in re- flection through pulsed thermography using two high power flashes (6.4 kJ) during 5 ms. The process of heat transfer on material was captured by an IR camera (3 - 5 µm) at frequency of 157 Hz. Figure 4 shows the geome-
try of flat specimens and Figure 5 shows the geometry of
curve (a) and trapezoidal (b) specimens and the distribu- tion of the defects in each of them.
[image:4.595.314.537.83.436.2]For the image sequences with more than a thermogram, the thermogram with the higher number of identified defects and providing as much information as possible regarding the composition of the plate was selected. The thermograms selected for the specimen CFRP006 are: the thermogram obtained at 1s when applying DAC, the ones obtained by Kurtosis and Skewness, the EOF3 through PCT, the thermogram obtained at the frequency of f = 53 Hz when applying the PhAC, at 0.1 Hz to the amplitude sequence and at 0.3 Hz to the phase sequence, and the thermogram formed by the coefficients of the fifth order derivative obtained from TSR with a polynomial of de- gree 5. The thermograms selected for the specimen CFRP007: DAC (thermogram at 1.4 s), PCT (EOF3), PhAC (at f = 63 Hz), PPT in amplitude (at f = 0.1 Hz) and phase (at f = 0.1 Hz) and TSR (fifth order derivative). The thermograms selected for the specimen CFRP008 are: DAC (thermogram at 0.7 s), PCT (EOF3), PhAC (at f = 42 Hz), PPT in amplitude (at f = 0.1 Hz) and phase (at f = 0.1 Hz) and TSR (fifth order derivative). The thermograms selected for the specimen PLEXI014 are:
Figure 3. Selection of areas for SNR calculation.
(a)
(b)
Figure 4. Squematic representation and defects location for flat specimens CFRP006 (a) and PLEXI014 (b).
DAC (thermogram at 1.3 s), PCT (EOF3), PhAC (at f = 43 Hz), PPT in amplitude (at f = 0.1 Hz) and phase (at f = 0.1 Hz) and TSR (forth order derivative). Figure 6
shows the areas selected for the quantification calculation using signal to noise ratio. In both types of specimens (CFRP and PLEXI014), xy configurations were em- ployed for the defects and XY configurations (Figure 6(c)).were used for the noise; the dimensions of the areas
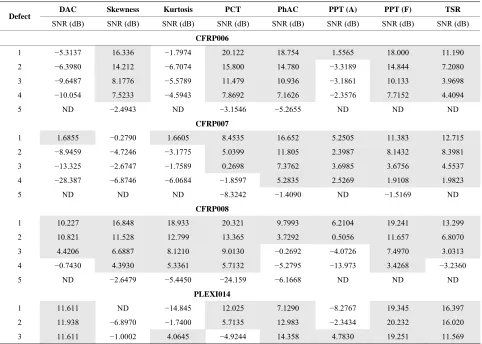
depended on the dimensions of the defects in each case. The defects are listed from left to right. Table 1 shows
[image:4.595.67.274.561.713.2](a) (b)
Figure 5. Squematic representation and defects location for specimens CFRP007 (a) and CFRP008 (b).
(a) (b)
(c)
Figure 6. Representation of the areas selected for the quantification analysis of the specimens CFRP (a) and PLEXI014 (b) and their configuration (c).
defects) and SNR < 0 (in the case of smaller defects) to SNR > 0 (for bigger and better identified defects). In the case of the specimen PLEXI014, the values of the SNR parameter depend on the defects depth, where the deeper
ones have a worse signal to noise ratio (SNR < 0) and in some cases, depending on the applied processing tech- nique, they will not be detected (ND) and the less deep
nes will provide better results (SNR > 0).
Table 1. SNR values obtained. Identified defects are shaded (SNR > 0).
DAC Skewness Kurtosis PCT PhAC PPT (A) PPT (F) TSR Defect
SNR (dB) SNR (dB) SNR (dB) SNR (dB) SNR (dB) SNR (dB) SNR (dB) SNR (dB)
CFRP006
1 −5.3137 16.336 −1.7974 20.122 18.754 1.5565 18.000 11.190
2 −6.3980 14.212 −6.7074 15.800 14.780 −3.3189 14.844 7.2080
3 −9.6487 8.1776 −5.5789 11.479 10.936 −3.1861 10.133 3.9698
4 −10.054 7.5233 −4.5943 7.8692 7.1626 −2.3576 7.7152 4.4094
5 ND −2.4943 ND −3.1546 −5.2655 ND ND ND
CFRP007
1 1.6855 −0.2790 1.6605 8.4535 16.652 5.2505 11.383 12.715
2 −8.9459 −4.7246 −3.1775 5.0399 11.805 2.3987 8.1432 8.3981
3 −13.325 −2.6747 −1.7589 0.2698 7.3762 3.6985 3.6756 4.5537
4 −28.387 −6.8746 −6.0684 −1.8597 5.2835 2.5269 1.9108 1.9823
5 ND ND ND −8.3242 −1.4090 ND −1.5169 ND
CFRP008
1 10.227 16.848 18.933 20.321 9.7993 6.2104 19.241 13.299
2 10.821 11.528 12.799 13.365 3.7292 0.5056 11.657 6.8070
3 4.4206 6.6887 8.1210 9.0130 −0.2692 −4.0726 7.4970 3.0313
4 −0.7430 4.3930 5.3361 5.7132 −5.2795 −13.973 3.4268 −3.2360
5 ND −2.6479 −5.4450 −24.159 −6.1668 ND ND ND
PLEXI014
1 11.611 ND −14.845 12.025 7.1290 −8.2767 19.345 16.397
2 11.938 −6.8970 −1.7400 5.7135 12.983 −2.3434 20.232 16.020
3 11.611 −1.0002 4.0645 −4.9244 14.358 4.7830 19.251 11.569
4. Conclusion
On the basis of the results obtained using the analysis of quantification of the selected processing techniques ap- plied to several specimens of different configurations, we conclude that the automatic identification of defects or discontinuities depends on the defects and discontinui- ties characteristics, so these results vary depending the processing methods that are employed. After assessing the number of detected defects (SNR > 0) and their con- figuration in each case, the processing method that pro- vides better results to automate, is the Principal Compo- nents Thermography (PCT) using EOF3.
REFERENCES
[1] P. Shull, “Nondestructive Evaluation: Theory, Techni- ques and Applications,” Marcel Dekker, New York, 2002.
doi:10.1201/9780203911068
[2] D. Benítez Hernán, C. Ibarra-Castanedo, H. B. Abdel, X. Maldague, H. Loaiza and E. Caicedo, “Procesamiento de Imágenes Infrarrojas Para la Detección de Defectos en Materiales,” Tecnura, Universidad Distrital Francisco José de Caldas, Bogotá, Colombia, Vol. 10, No. 20, 2007,
pp. 40-51.
[3] G. Fernández and A. Daniel, “Contribuciones a las Téc- nicas no Destructivas Para Evaluación y Prueba de Pro- cesos y Materiales Basadas en Radiaciones Infrarrojas,” Tesis Doctoral, Universidad de Cantabria, Departamento de Tecnología Electrónica e Ingeniería de Sistemas y Au- tomática, 2006.
[4] F. Madruga, P. Albendea, C. Ibarra-Castanedo and J. Lo- pez-Higuera, “Signal to Noise Ratio (SNR) Comparison for Lockin Thermographic Data Processing Methods in CFRP Specimen,” Qirt10, Quantitative Infrared Thermo- graphy, Québec, 2010, pp. 1-6.
[5] P. Albendea, F. Madruga, A. Cobo and J. Lopez-Higuera, “Signal to Noise Ratio (SNR) Comparison for Pulsed Thermographic Data Processing Methods Applied to Weld- ing Defect Detection,” Qirt10, Quantitative Infrared Ther- mography, Québec, 2010.
[6] J. N. Zalameda, N. Rajic and W. P. Winfree, “A Com- parison of Image Processing Algorithms for Thermal Non-Destructive Evaluation,” SPIE Proceedings of Ther- mosense XXV, Vol. 5073, 2003, pp. 374-385.
[8] F. J. Madruga, C. Ibarra-Castanedo, O. M. Conde, et al., “Enhanced Contrast Detection of Subsurface Defects by Pulsed Infrared Thermography Based on the Fourth Order Statistic Moment, Kurtosis,” Proceedings of the SPIE—
The International Society for Optical Engineering, 14 April 2009, Article ID: 72990U.
[9] X. P. V. Maldague, “Theory and Practice of Infrared Technology for Nondestructive Testing,” John Wiley & Sons, New York, 2001.
[10] C. Ibarra-Castanedo and X. Maldague, “Pulsed Phase Thermography Reviewed,” Quantitative InfraRed Ther- mography Journal, Vol. 1, No. 1, 2004.
[11] C. Ibarra-Castanedo, “Quantitative Subsurface Defect Eva- luation by Pulsed Phase Thermography: Depth Retrieval with the Phase,” Ph.D. Thesis, Université Laval, 2005. [12] N. Rajic, “Principal Component Thermography for Flaw
Contrast Enhancement and Flaw Depth Characterisation in Composite Structures,” Composite Structures, Vol. 58, No. 4, 2002, pp. 521-528.