Munich Personal RePEc Archive
Investigating the cultural patterns of
corruption: A nonparametric analysis
Halkos, George and Tzeremes, Nickolaos
University of Thessaly, Department of Economics
2011
Online at
https://mpra.ub.uni-muenchen.de/32546/
Investigating the cultural patterns of
corruption:
A nonparametric analysis
By
George Emm. Halkos
and Nickolaos G. Tzeremes
University of Thessaly, Department of Economics,
Korai 43, 38333, Volos, Greece
Abstract
By using a sample of 77 countries our analysis applies several nonparametric techniques in order to reveal the link between national culture and corruption. Based on Hofstede’s cultural dimensions and the corruption perception index, the results reveal that countries with higher levels of corruption tend to have higher power distance and collectivism values in their society.
Keywords: Nonparametric methods; Corruption perception index; National culture
JEL classification:C14; C19; Z10
Corresponding author. Present address: Department of Economics, University of Thessaly, Korai 43,
38333, Volos, Greece. Tel.: 0030 24210 74920. Fax: 0030 24210 74772.
1. Introduction
The aim of this paper is to analyze and reveal the interrelation and the distinct
characteristics between culture and corruption. Cultural values guide and shape the
way the social institution functions (Licht et al, 2007). Barr and Serra (2010) suggest
that social norms cannot be affected only by values and beliefs but by “the proportion
of people who adhere to the norm, which in turn affects individuals’ beliefs in the
values underlying the norm, and, as a consequence, the likelihood that the norm will
be internalized by others including future generations”. This social mechanism
explains the existence of “culture of corruption” indicating that individuals who grow
up in societies in which corruption is prevalent will be more likely to accept
corruption and act corruptly, in contrast with those who grow up in a more transparent
society (Hauk and Saez-Marti, 2002). Our research argues the existence of distinct
cultural characteristics which explain countries’ corruption levels and can be revealed
through nonparametric techniques.
2. Methodology and data
Let the sample realizations ( , )Y Xi i be i.i.d. defined on. Then the
nonparametric regression model has the form of:
( ) , 1,..., .
i i i
Y g X u i n (1).
Following Li and Racine (2007) g x( )E Y x( )is a function ofx. Then by
denoting the joint probability density function (PDF) as fy x, ( , )x y the marginal PDF of
X asf x( )and the conditional PDF of Y X as fy x, (y x)then:
,
( , ) y x( , ) / ( )
y x
f x y f x y f x (2).
, ( , ) ( ) ( ) ( ) def y x y xyf x y dy
E Y X x yf y x dy g x
f x
(3),then the
yfy x, ( , )x y dy can be estimated by replacing the unknown PDF fy x, ( , )x ywith its kernel estimated as y fy x, ( , )x y dy
where, 1 1 1 ( , ) ... n i i y x i q X x
y f x y dy K Y
nh h h
(4).Finally, the E Y x( )g x( ) can be estimated by:
1 , 1 ( , ) ( ) ( ) n i i i y x n i i X x Y K
y f x y dy h
g x
X x
f x K
h
(5).Equation (5) is the “local constant” kernel estimator or the
“Nadaraya-Watson” kernel estimator introduced by Nadaraya (1965) and Watson (1964) andK is
a second order Gaussian kernel and his the appropriate bandwidth which will be
analyzed next.
For the calculation of bandwidth a data driven approach introduced by
Hurvich et al. (1998) has been applied. The AICc criterion can be defined as1:
2 1 tr(H)/
ln( )
1 tr( ) 2 /
c n
AIC
H n
(6),
where
22 ' '
1
1 n ( ) ( ) ( ) /
i i
i
Y g X Y I H I H Y n n
(7)withg X( )i
being a nonparametric estimator and Hbeing n n weighting function
with its ( , )thi j element given by
1 Li and Racine (2004) have proved that AIC
c tends to perform better than the least square
1
, / 1 , , , 1 /
q n
ij h ij l h il h ij s s is js s
H K K K h k X X h
(8).According to Li and Racine (2007) there is a within sample measure goodness
of fit analogue to the one of 2
R parametric regression models. Let Yi denote the
outcome and Yi
the fitted values for observation i, then the R2for the nonparametric
regression can be defined as:
2 _ _ 1 2 2 2 _ _ 1 1 n i i i n n i i i i
Y y Y y R
Y y Y y
(9).Then a consistent significance test for continuous regressors defined by Racine (1997)
is applied in order to verify the significance of the explanatory variables on the
depended. Letzdenote the explanatory variable(s) that might be redundant, let
X denote the remaining explanatory variable(s) in the regression model, and let
Y denote the dependent variable. Then the null hypothesis can be written as (Racine
2008, p. 67):
0: ,
H E y x z E Y z almost everywhere, which is equivalent to
0
,
: E y x z ( ) 0
H x
x
almost everywhere. In this way the test statistic is an
estimator of I E
( )x 2
.Our paper uses a sample of 77 countries2 with the variable of interest being the
average value (of 1996-2006) of corruption perception index (CPI)3 provided by the
2 Argentina, Australia, Austria, Bangladesh, Belgium, Brazil, Bulgaria, Canada, Chile, China,
Transparency International. The explanatory variables used in order to measure
countries’ national culture are derived from the four cultural dimensions as introduced
by Hofstede (1980)4: power distance (PDI); individualism versus collectivism (IDV,);
masculinity versus femininity (MAS); and uncertainty avoidance (UAI)5.
3. Empirical analysis
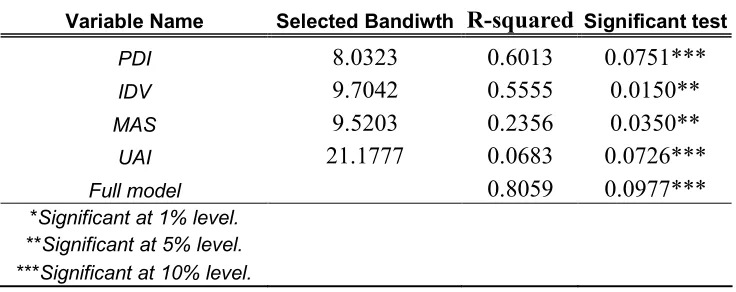
Table 1 presents the results from the local constant no-parametric regression
with average CPI value as dependent variable and the four cultural values as
independent (the full model). The results indicate a goodness of fit of 80.6%
(R2=0.8059) and the nonparametric significant test (Racine, 1997) reveals that the
four explanatory variables are statistically significant at 10% level (p-value=
0.097744). However, the individual influence of every explanatory variable needs to
[image:6.595.89.457.432.578.2]be assed; therefore four additional nonparametric regressions have been applied.
Table 1: The results of the nonparametric regressions
Variable Name Selected Bandiwth R-squared Significant test
PDI 8.0323 0.6013 0.0751***
IDV 9.7042 0.5555 0.0150**
MAS 9.5203 0.2356 0.0350**
UAI 21.1777 0.0683 0.0726***
Full model 0.8059 0.0977***
*Significant at 1% level. **Significant at 5% level.
***Significant at 10% level.
Tanzania, Thailand, Turkey, United Arab Emirates, United Kingdom, United States of America, Uruguay, Venezuela, Viet Nam and Zimbabwe.
3 Many studies (Gokcekus and Knörich, 2006; Gokcekus, 2008; Gundlach and Paldam, 2009) have
used CPI as a proxy of corruption with a scale from 0 (perceived to be highly corrupt) to 10 (perceived to have low levels of corruption). For details see: http://www.transparency.org/policy_research/surveys_indices/gcb
4 For an extensive analysis of Hofstede’s cultural indexes see Halkos and Tzeremes (2010). For details
see: http://www.geert-hofstede.com/.
5 Power distance: ‘‘the extent to which the less powerful members of institutions and organizations
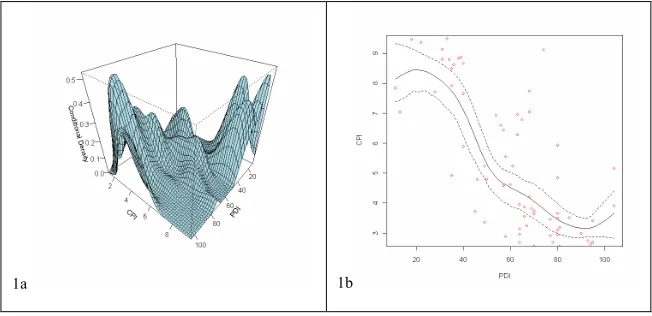
Sub-figures 1a, 1c, 1e and 1g illustrate graphically the conditional densities
(stochastic kernels) for the four cultural values. In addition the sub-figures 1b, 1d, 1f
and 1h represent the local linear nonparametric regression plots with their
bootstrapped point wise error bounds. For the case of PDI (sub figures 1a and 1b) the
stochastic kernel reveals that the probability mass lies on high PDI values and lower
CPI values. In addition we observe that the probability mass lies also at lower PDI
and higher CPI values. Moreover the nonparametric regression line indicates a
negative relation between the PDI and CPI with a goodness of fit of 60% with the PDI
being statistically significant at 10% level (Table 1).
According to Getz and Volkema (2001) in higher power distance cultures the
acceptance of separations between socioeconomic classes leads to the likelihood that
officials demand or accept bribes and leads to the phenomenon where businesses will
offer or pay bribes. For the case of IDV (1c and 1d) the nonparametric regression
reveals a positive relationship with a goodness of fit of 55% and the IDV variable
being statistically significant at 5% level. The stochastic kernel reveals that
probability mass lies at higher IDV and CPI values, but also at lower IDV and CPI
values.
Collectivism in a society is associated with lower standards (in contrast with
the individualistic cultures) which in turn affect whether a public official would
demand or accept bribe Getz and Volkema (2001). Collectivism cultures may contain
networks of friends and family creating relationships which can facilitate abnormal or
illegal transactions. Furthermore, in the case of MAS (1e and 1f) the results indicate a
“U” shape relationship with a goodness of fit of 23% and the MAS variable being
mass lies in two distinct points; first at higher MAS and lower CPI values and
secondly at lower MAS and high CPI values.
According to Getz and Volkema (2001) in masculine cultures people may be
comfortable pursuing their goals through bribes provided they view the probability of
success to be high. Furthermore, the nonparametric analysis between UAI and CPI
(1g and 1h) reveals a negative relationship with a goodness of fit of only 7% and the
UAI variable being statistically significant at 10% level. The stochastic kernel reveals
that the probability mass lies again in two distinct points; first at lower UAI and
higher CPI values and then at higher UAI and lower CPI values. In societies with high
uncertainty avoidance individuals perceive that is necessary to work through informal
channels in order to achieve their personal objectives and thus to minimize
uncertainty. Similarly the officials accept and demand those bribes and illegal
channels. Since the corruption patterns are established breaking out of them would
create further uncertainty (Getz and Volkema 2001).
Finally, looking at the R2 values of the four variables (Table 1) it appears that
only PDI and IDV values in a society have a dominant role determining countries’
corruption levels.
Figure 1: Nonparametric conditional PDF figures and local constant estimators using the AICc bandwidth selection and a second order Gaussian kernel throughout.
[image:8.595.84.410.582.740.2]1c 1d
1e 1f
1g 1h
4. Conclusions
The nonparametric analysis reveals the fact that culture and corruption are
interrelated. The highly corrupted countries have strong and distinct cultural
characteristics. These are high power distance and lower individualistic values. Since
cultural values are not inborn and can be taught (Hofstede 1980), the biggest task of
governments and policy makers lies ahead and that is to shape countries’ national
References
Barr, A., Serra, D., 2010. Corruption and culture: An Experimental Analysis. Journal
of Public Economics. doi: 10.1016/j.jpubeco.2010.07.006.
Getz, K.A., Volkema, R.J., 2001. Culture, perceived corruption, and economics: a
model of predictors and outcomes. Business and Society 40, 7-30.
Gokcekus, O., 2008. Is it protestant tradition or current protestant population that
affects corruption? Economics Letters 99, 59–62.
Gokcekus, O., Knörich, J., 2006. Does quality of openness affect corruption?
Economics Letters 91, 190–196.
Gundlach, E., Paldam, M., 2009. The transition of corruption: From poverty to
honesty. Economics Letters 103, 146–148.
Halkos, G.R., Tzeremes, N.G., 2010. Modelling the effect of national culture on
multinational banks' performance: A conditional robust nonparametric frontier
analysis. Economic Modelling. doi:10.1016/j.econmod.2010.07.002.
Hauk, E., Saez-Marti, M., 2002. On the Cultural Transmission of Corruption. Journal
of Economic Theory 107, 311-35.
Hofstede, G., 1980. Culture's Consequences, International Differences in Work-
Related Values. Sage Publications, Beverly Hills, CA.
Hurvich, C.M., Simonoff, J.S., Tsai, C.L., 1998. Smoothing parameter selection in
nonparametric regression using an improved Akaike information criterion. Journal of
the Royal Statistical Society Series B 60, 271–293.
Li, Q., Racine, J.S., 2004. Cross-validated local linear nonparametric regression.
Statistica Sinica 14(2), 485–512.
Li, Q., Racine, J.S., 2007. Nonparametric Econometrics: Theory and Practice.
Licht, A..N., Goldschmidt, C., Schwartz, S.H., 2007. Culture Rules: The Foundations
of the Rule of Law and Other Norms of Governance. Journal of Comparative
Economics 35, 659-688.
Nadaraya, E.A., 1965. On nonparametric estimates of density functions and
regression curves. Theory of Applied Probability 10, 186–190.
Racine, J.S., 2008. Nonparametric Econometrics: A Primer. Foundations and Trends
in Econometrics 3 (1), 1–88.
Racine, J.S., 1997. Consistent significance testing for nonparametric regression.
Journal of Business and Economic Statistics 15(3), 369–379.