Nutrition Theses Department of Nutrition
Summer 6-22-2015
The Effect of Nutrition Training on the Nutrition
Knowledge of School Nutrition Managers and
Food Choices Made By Students in Public School
Cafeterias
Martha Toner
Georgia State University
Follow this and additional works at:https://scholarworks.gsu.edu/nutrition_theses
This Thesis is brought to you for free and open access by the Department of Nutrition at ScholarWorks @ Georgia State University. It has been accepted for inclusion in Nutrition Theses by an authorized administrator of ScholarWorks @ Georgia State University. For more information, please contact scholarworks@gsu.edu.
Recommended Citation
Toner, Martha, "The Effect of Nutrition Training on the Nutrition Knowledge of School Nutrition Managers and Food Choices Made By Students in Public School Cafeterias." Thesis, Georgia State University, 2015.
AUTHOR’S STATEMENT
In presenting this thesis as a partial fulfillment of the requirements for the advanced degree from Georgia State University, I agree that the library of Georgia State University shall make it available for inspection and circulation in accordance with its regulations governing materials of this type. I agree that permission to quote, to copy from, or to publish this thesis may be granted by the professor under whose direction it was written, by the Byrdine F. Lewis School of Nursing and Health Professions director of graduate studies and research, or by me. Such quoting, copying, or publishing must be solely for scholarly purposes and will not involve potential financial gain. It is understood that any copying from or publication of this thesis which involves potential financial gain will not be allowed without my written permission.
____________________________
NOTICE TO BORROWERS
All theses deposited in the Georgia State University library must be used in accordance with the stipulations prescribed by the author in the preceding statement. The author of this thesis is:
Marti Toner
1147 Oglethorpe Avenue, NE Atlanta, GA 30319
The director of this thesis is:
Anita M. Nucci, PhD, RD, LD Associate Professor Department of Nutrition
Byrdine F. Lewis School of Nursing and Health Professions Georgia State University
VITA
Marti Toner
ADDRESS: 1147 Oglethorpe Avenue, NE Atlanta, GA 30319
EDUCATION: M.S. 2015 Georgia State University Health Sciences
B.S. 2006 Georgia Institute of Technology Management (concentration: Finance)
PROFESSIONAL EXPERIENCE:
Graduate Research Assistant, Department of Nutrition 2014-2015 Georgia State University, Atlanta, GA
Client Partner, Corporate Operations 2011-2014 KesselRun Consulting, Washington, DC
Director of Program Management, Client & Strategy Development 2009-2014 KesselRun Consulting, Atlanta, GA/Washington, DC
Associate 2006-2014
KesselRun Consulting, Atlanta, GA
PROFESSIONAL SOCIETIES AND ORGANIZATIONS:
Academy of Nutrition and Dietetics 2013-present
Georgia Academy of Nutrition and Dietetics 2013-present
Greater Atlanta Dietetic Association 2013-present
AWARDS AND PUBLICATIONS:
ABSTRACT
THE EFFECT OF NUTRITION TRAINING ON THE NUTRITION
KNOWLEDGE OF SCHOOL NUTRITION MANAGERS AND FOOD
CHOICES MADE BY STUDENTS IN PUBLIC SCHOOL CAFETERIAS
by
Marti Toner
Background: In 2012, more than one in three American youth were classified as overweight or obese. The cause of obesity is multifactorial. However, environmental
influences and behavioral characteristics appear to have more impact on the development
of obesity than genetics and/or cultural background. In response to an Institute of
Medicine briefing detailing recommendations for changes to school meals, the Healthy,
Hunger-Free Kids Act of 2010 was passed to update nutrition guidelines for schools
participating in the National School Lunch and School Breakfast Programs. This Act
seeks to help reduce childhood obesity through the provision of nutritionally balanced
school meals.
Methods: We conducted a secondary analysis of data collected by Children’s Healthcare of Atlanta as part of its Strong4Life School Nutrition Program. School nutrition
managers in a South Georgia school district participated in a dietitian-led training,
of servings of foods prepared and sold in elementary schools in the same school district
were also collected during the weeks preceding the manager training and post training.
Observations of the cafeteria organization were also recorded pre and post training.
Frequency statistics were used to describe the pre- and post-survey and food production
data. A Wilcoxon signed-rank test was used to compare pre- and post-survey scores.
Cafeteria organizational changes were compared for improvement pre- and post-training.
Results: Of the 30 school nutrition managers who completed the pre- and post-surveys, 23 (77%) provided identifying information and were included in this analysis. The
average pre- and post-survey scores were 4.9 and 5.8, respectively (18.4% increase).
Twelve participants received a higher score after the training session, 10 had no change
in score, and one participant’s score decreased following the training. The vast majority
of managers (>90%) indicated that they would like to encourage changes in the cafeteria
to promote healthy choices and that they felt confident in their abilities to provide
guidance to cafeteria staff to make such changes. Manager perception of overweight and
obesity in the state of Georgia being “very serious” or “somewhat serious” increased
from 93% before the training to 100% following the training. Six of the 12 schools in
which food production data was obtained showed improvement in the percentage of
students who chose skim or 1% plain milk vs. flavored milk. Seven schools showed an
improvement in the percentage of fruit sold between March and October, four showed an
improvement in vegetables sold.
Conclusions: School nutrition managers showed increased nutrition knowledge and belief in their individual ability to act as a role model in the school cafeteria after
nutrition knowledge of managers and changes in student food purchasing habits. Future
iterations of this training program should include collection of the name of the school(s)
in which the manager presides to determine association between increased nutrition
knowledge and/or changed perception of role in promoting healthy habits and changes in
THE EFFECT OF NUTRITION TRAINING ON THE NUTRITION
KNOWLEDGE OF SCHOOL NUTRITION MANAGERS AND FOOD
CHOICES MADE BY STUDENTS IN PUBLIC SCHOOL CAFETERIAS
by
Marti Toner
A Thesis
Presented in Partial Fulfillment of Requirements for the Degree of
Master of Science in Health Sciences
The Byrdine F. Lewis School of Nursing and Health Professions
Department of Nutrition
Georgia State University
ii
ACKNOWLEDGMENTS
iii
TABLE OF CONTENTS
List of Figures ... iv
List of Tables ...v
Abbreviations ... vi
Chapter I. INTRODUCTION ...1
II. LITERATURE REVIEW ...4
History of School Meal Programs ...4
Nutrition Standards for School Meals ...9
School Meal Acceptance ...13
Smarter Lunchroom Movement ...16
Children’s Healthcare of Atlanta’s Strong4Life ...17
III. METHODS ………. 19
Statistical Analysis ...21
IV. RESULTS ……… ...23
V. DISCUSSION AND CONCLUSION ……….. ..29
Discussion ...29
Conclusion ...34
REFERENCES ...
iv
LIST OF FIGURES
Figure Page
1. Percent Correct Responses on Pre- and Post-training Surveys ...23
2. Student Purchasing Habits of Milk Pre- and Post-manager Training ...24
v
LIST OF TABLES
Table Page
1. Responses to Pre- and Post-survey re: School Nutrition (pre: n=30; post: n=33) ...23
2. Responses to Pre- and Post-survey re: Obesity (pre: n=30; post: n=33) ...24
3. Cafeteria Observations Pre- and Post-training (n=13) ...26
vi
ABBREVIATIONS
AI Adequate Intake
BEN Behavioral Economics in Child Nutrition Programs
BMI Body Mass Index
CDC Centers for Disease Control and Prevention
CHOA Children’s Healthcare of Atlanta
DRI Dietary Reference Intakes
EAR Estimated Average Requirement
HHFKA Healthy, Hunger-Free Kids Act
IOM Institute of Medicine
IOTF International Obesity Task Force
NIH National Institutes of Health
NSLP National School Lunch Program
RDA Recommended Dietary Allowance
SBP School Breakfast Program
vii
USDA United States Department of Agriculture
1
CHAPTER I
THE EFFECT OF NUTRITION TRAINING ON THE NUTRITION KNOWLEDGE OF SCHOOL NUTRITION MANAGERS AND FOOD CHOICES MADE BY STUDENTS
IN PUBLIC SCHOOL CAFETERIAS
Introduction
Obesity among American children is a national crisis. In 2012, one in three
American youth, aged 2 to 19 years, was classified as overweight or obese; nearly 17% of
these children were obese.1 While numerous policies and public health recommendations
focused on nutrition and weight management have been implemented throughout the last
several decades, the rate of overweight and obese has continued to increase. Obesity in
childhood increases the risk for chronic conditions such as cardiovascular disease, type 2
diabetes, asthma, sleep apnea, joint problems, fatty liver disease, gallstones, in addition to
both psychological and social problems later in life.2–6 In addition, individuals who are
obese as children experience increased risk for obesity and its associated health risks
(diabetes, heart disease, certain cancers) in adulthood.7,8
The cause of the obesity epidemic is multifactorial; biological, behavioral,
cultural, genetic, and/or environmental aspects all play a role in its development and
progression.9,10 It is largely maintained that environmental influences and individual
behaviors have the most significant influence as instances of overweight and obesity most
commonly result from reduced physical activity, poor dietary habits, or a combination of
these factors.9–11 Previous studies have shown that children who consume a diet higher in
children consume the recommended daily servings of fruit and only 7% intake the daily
recommended amount of vegetables.13
Over 30 million youth and adolescents in American elementary, middle, and
high schools take part in the National School Lunch Program each day. In an effort to
ensure the healthfulness of these meals, in 2009 the Institute of Medicine (IOM)
recommended that the amount and variety of fruits and vegetables provided in school
meals be increased and that milk be limited to no and low-fat varieties.14,15 In 2010,
Congress passed the Healthy, Hunger-Free Kids Act (HHFKA) to formally implement
these recommendations in a concerted effort to contest the pervasiveness of childhood
obesity in the United States. This Act necessitates that all American schools participating
in the National School Lunch Program meet specified food and nutrient requirements in
all of its meals.16 However, these guidelines do not address the actuality of student
choice to select, and subsequently consume, the nutritious offerings provided in school
cafeterias. Desirable appearance, convenience, and familiarity with foods each influence
selection.17 Simple encouragement or prompting has also been shown to generate
increased selection of those foods that may be less familiar or typically enticing to a
school-aged child.17,18 But, little is known about the role that school nutrition managers
maintain in the decision making and purchasing habits of students in school cafeterias19
School nutrition managers, the individuals largely responsible for implementing
the practices of the HHFKA, possess the ability to facilitate acceptance of these school
meals designed to promote increased nutritious eating habits. The purpose of this
descriptive study is to examine the relationship between school nutrition managers’
food purchasing habits of their students. We hypothesize that after attending a
nutrition-expert led training session, school nutrition managers will demonstrate an increase in
nutrition knowledge, and subsequent belief in the importance of their role as nutrition
providers as compared to before the training. We also hypothesize that the number of
nutritious food and beverage selections by students will increase after the manager
training program and that we will observe changes to the food displays within the
cafeteria, highlighting the most nutrient-dense items. Our null hypotheses are as follows:
1) the nutrition knowledge score or belief in the significance of the role of the manager as
nutrition providers will be the same before and after the training session, 2) neither the
number of nutritious food and beverage items selected by students nor the food displays
4
CHAPTER II
Literature Review
History of School Meal Programs
When the Children’s Aid Society of New York implemented a program serving
meals to its students in 1853, it was the first of its kind in the United States (US).20
While school meal service was provided in many European countries, it took several
decades for cities in the US, outside of New York City, to implement food services for
their students.20 However, during and after World War II, the need for adequate
childhood nutrition garnered great attention as many young men were unable to
participate in military services due to inadequate health status.21 Robert Hunter’s 1904
book Poverty instigated a stir among the American people of its obligation to feed the
growing population of hungry children in its school systems.22,23 Hunter wrote “guidance
and supervision of the parents are impossible because there are too many hungry mouths
to feed; learning is difficult because hungry stomachs and languid bodies and thin blood
are not able to feed the brain… If it is a matter of principle in democratic America that
every child shall be given a certain amount of instruction, let us render it possible for
them to receive it, as monarchial countries have done, by marking full and adequate
provision for the physical needs of the children who come from the homes of poverty.”23
At the time of Poverty’s publication, school lunch programs were in development
in Philadelphia, Boston, and Milwaukee. The Starr Center Association in Philadelphia
was offering lunches for a single penny in 9 schools across the city. In 1909 the operation
orchestrator of this resettlement, Dr. Cheesman A. Herrick, required that the program be
based upon appropriate nutrition principles. Within 3 years the program was successfully
expanded to each high school within Philadelphia under the establishment of a newly
created authority, the Department of High School Lunches. Shortly thereafter, the
Department of High School Lunches authorized the extension of its offerings to the city’s
elementary schools.24 In Boston, the first school feeding programs were implemented
under the guidance of the Women’s Educational and Industrial Union, who utilized a
centralized kitchen operation to transport hot lunches to participating high schools. By
1910, the program was also providing meals to local elementary schools through a
collaboration with Home Economics students within the individual schools. Similarly, in
1904 in Milwaukee, the Women’s Alliance of Wisconsin, in tandem with donations from
churches, societies, and individual citizens, began preparing lunches within the homes of
women who lived nearest the city’s schools. The meals were then transported to and
served at the schools. Within just a few years, improvement in student attendance was
observed, and the food preparation was moved within the schools under the direction of
an appointed matron. The meals were sold for one cent; however, those students who
could not afford to pay received their lunches free of charge.25
Throughout the first three decades of the 20th century, school feeding programs
expanded across the US. By 1937, 15 states had passed laws authorizing its local school
boards to conduct lunchroom service within its schools. Common practice at that time
was to offer the meals to the students at a minimum cost that covered the food expenses,
but no associated labor-related fees. Several states (Indiana, Missouri, Vermont, and
charge.26 With the growth of these programs and ever increasing participation rates, the
need for federal aid support commenced.
During the latter half of the 1930’s federal assistance under both the Civil Works
Administration and the Federal Emergency Relief Administration was offered to 39 states
across the country.27 As a result of the Great Depression, many families struggled to
provide adequate rations for their family and did not have adequate finances to allow
their children to purchase school lunch. In 1936, Public Law 320 set aside 30% of duties
collected from annual customs laws for allocation by the Secretary of Agriculture to
encourage consumption of surplus domestic agricultural products by restricting them
from usual trade and commerce networks. The law’s intention was to remove the excess
food products associated with reducing rates while utilizing the goods as part of specified
government programs. This commodity allocation became the first purchase and
distribution system between the United States federal government, via the United States
Department of Agriculture (USDA), and local school systems. By the end of 1939, over
14,000 schools were procuring foods through the program, resulting in the feeding of
almost 900,000 students.27
The commodity donation program required great collaboration between federal,
state, and local governments. Before a school board, mother’s club, or other civic/social
organization coordinating a school lunch program could enroll to receive these surplus
goods, the organization was mandated to sign an agreement with the state guaranteeing
the following: 1) the commodities would only be used for school lunches prepared
on-site; 2) commodities would not be sold; 3) the meal program would not be profit-seeking;
segregated nor identified to their peers. Initially, each school was allotted its proportion
of the goods based upon the number of underprivileged children participating in the
program. This stipulation was quickly adjusted to represent the total number of
participating students, notwithstanding financial status.27
While school lunch participation continued to expand, due largely to the
commodity donation program, many programs struggled to reconcile funds associated
with growing labor costs. The Reconstruction Finance Corporation, the Civil Works
Administration, and the Federal Emergency Relief Administration all offered financial
assistance for such labor costs until the mid-1930s. At that time, the Works Progress
Administration (WPA), created to produce public projects based jobs for needy citizens,
allocated a substantial portion of its operations to school lunch work. Supervisors,
commonly with food service backgrounds, were identified at the State level. Each
supervisor oversaw a team of district and local supervisors to in turn managed workers
within the individual schools with the general day-to-day operations of producing school
lunch. The state and district workers participated in development of menus and recipes,
as well as training documents for general food safety mechanisms and standards. This
allocation of labor to the WPA absolved the local school districts from much of the
labor-associated costs with providing meal service to its students. Consequently, participation
accelerated. By 1941, school lunch programs were in existence in all States, plus the
District of Columbia and Puerto Rico.27
The school lunch program was temporarily discontinued during World War II.
As the war continued, federal budgets were largely re-aligned to support the combat
entirely and the commodities donation program saw its surplus goods reallocated to the
troops stationed abroad. In 1944, the operations associated with the national school lunch
program had downgraded severely, from almost 93,000 schools providing meals to 6
million children each day, to just 34,000 schools serving 5 million participants. To
prevent further decline, Congress passed Public Law 129, designating funds up to $60
million to sustain national school lunch programs during 1943 and 1944. The following
year, this provision was expanded further, apportioning $50 million for school lunch
programs. When Congress extended another $50 million for the 1945-46 school year, the
nation saw participation rise to over 6.7 million children.27 It was during this time that
the school lunch act, formally designated as the Richard B. Russell National School
Lunch Act, was officially declared as national policy by Congress, stating “as a measure
of national security, to safeguard the health and well-being of the Nation’s children and
to encourage the domestic consumption of nutritious agricultural commodities and other
food, by assisting the States, through grants-in-aid and other means, in providing an
adequate supply of foods and other facilities for the establishment, maintenance,
operation, and expansion of nonprofit school lunch programs.” 28
During the 1960’s, as persisting anxiety associated with annual appropriations for
school lunch programs continued, Congress proposed legislation to formalize and dictate
permanence to what is now known as the National School Lunch Program (NSLP). The
House Committee on Agriculture reported that “the expansion of the program has been
hampered by basic legislation…. The national school lunch bill provides basic,
comprehensive legislation for aid, in general, to the States in the operation of school
educational features of a properly chosen diet served at school should not be
under-emphasized. Not only is the child taught what a good diet consists of, but his parents and
family likewise are otherwise instructed.” 9,10 The act clearly dictated the manner in
which the allocation of funds should be utilized. Included were food and equipment
provisions, mandated meal nutritional requirements, and the stipulation that reduced or
free of charge meals would be provided to those children who could not afford the
affixed cost.29
Over the years, the stipulations of the National School Lunch Act have been
recurrently amended, and the governing body of the school lunch program has shifted.
Throughout much of the 1960’s and 1970’s, the focus of these changes was concentrated
on malnutrition prevalence amongst needy children attending American schools. During
this time, many schools across the country also began offering breakfast to their students.
The 91st Congress employed an amendment declaring consistent guidelines related to
eligibility requirements for free and reduced-price school meals. This amendment also
set a maximum charge for reduced-price breakfasts and lunches offered in elementary,
middle, and high schools participating in the NSLP.30
Nutrition Standards for School Meals
In the 1960s, national surveys began to collect anthropometric indices of
American children. These surveys reported a steady body mass index (BMI) distribution
until the 1980’s, after which time a consistent, pervasive increase began.31 One study
supported by the National Institutes of Health (NIH) showed that from the 1970’s to the
International Obesity Task Force (IOTF)), increased from 0% to 14% in boys, and from
2% to 12% in girls.31–33 The Centers for Disease Control and Prevention has reported
that rates of obesity among 2 to 19 year old children and adolescents, defined as > the
95th percentile when plotted on the CDC BMI-for-age growth chart, increased from 5% in
the early 1970’s to 10% in the late 1980’s. By 2008, 17% of American children were
clinically categorized as obese.34 As a result, the primary focus of the school lunch
program began to shift from providing sustenance to the nation’s undernourished children
to combatting the public health epidemic of childhood obesity.
Following the Healthy Meals for Americans Act of 1994, the School Meals
Initiative was created by the USDA to align school meals with the existing Dietary
Guidelines for Americans (Appendix A). The Initiative implemented a menu-planning
system to assist schools country-wide with the creation of healthful meals that
incorporate the dietary guidelines, specifically limiting fat to 30% or less of total calories,
and also appeal to children. By 2001, data collected via the School Nutrition and Dietary
Assessment Survey found that schools were struggling to comply with these standards, as
the average fat content in a school lunch still hovered at 35% of the daily
recommendation of total caloric intake.35
At the request of the USDA, in 2009 the Institute of Medicine (IOM) published
the report School Meals: Building Blocks for Healthy Children detailing its
recommendations to update the existing school meal standards for the National School
Lunch Program (NSLP) and the School Breakfast Program (SBP). This guidance
included the creation of both a minimum and maximum caloric level, an increase in the
overall reduction in sodium and saturated fat. Furthermore, the IOM report enforced the
importance of designating nutrient targets and meal requirements that vary by age/grade
(kindergarten through grade 5; grades 6 through 8; grades 9 through 12) and remain
consistent with both the Dietary Guidelines for Americans and Dietary Reference Intakes
(DRI).15
Dietary Reference Intakes were initially created in 1995 as a solution to an
established need for a comprehensive solution to provide nutrition-related guidance for
the nation, as the existing Recommended Dietary Allowances (RDA) lacked
differentiation between individuals and groups. The DRIs cover a set of four reference
values: 1) RDAs detail the average daily dietary intake of nutrients that meet dietary
requirements of 98% of healthy individuals; Adequate Intake (AI) is used when the RDA
cannot be determined; Tolerable Upper Intake levels represent the highest amount of a
nutrient that may be consumed with no risk of toxicity; and Estimated Average
Requirements (EAR) are the amount projected to meet the daily requirement of half of all
healthy individuals. Each of these values is customized by gender and for varying stages
of life.36
The Dietary Guidelines for Americans are a broader set of recommendations
released every 5 years by the USDA and the Department of Health and Human Services.
The most current version of the guidelines, termed the Dietary Guidelines for Americans
of 2010, places emphasis on the consumption of more fruits, vegetables, whole grains,
fat-free and/or low-fat dairy products and seafood and the reduction in sodium, saturated
and trans-fats, cholesterol, refined grain products, and added sugars. While these general
were outlined for children. For example, the Guidelines encourage that total daily
sodium intake for children should be reduced to just 1,200 mg for 4 to 8 year olds and
1,500 mg daily for older children. Additionally, the recommended macronutrient
breakdown for school age children is 45-65% carbohydrate, 10-30% protein, and 25-35%
fat.37
In December of 2010, with bipartisan Congressional support, the Healthy,
Hunger-Free Kids Act (HHFKA) was passed, comprising many of the recommendations
contained in the IOM’s School Meals: Building Blocks for Healthy Children’s report. In
addition to its reauthorization of funding for federal school meal programs, the bill set
specific guidelines focused on improved nutrition of the nation’s school children and
reducing childhood overweight and obesity. Specifically, the bill provided the USDA
with the authority to set nutrition-related standards for any food sold in schools
participating in the National School Lunch Program.38 These new standards required that
schools participating in the NSLP comply with the following parameters: offer fruits and
vegetables as separate meal components; offer fruit every day at both breakfast and
lunch; offer vegetables every day at lunch (and provide vegetable options that meet
specific sub-group requirements each week – dark green, orange, legumes, and “other” –
with a restricted number of servings of starchy vegetables); offer whole grains; offer a
daily meat or meat alternate during breakfast; offer fat-free and low-fat milk; offer meals
that meet described calorie ranges by age/grade group; reduce overall meal sodium
content; eliminate trans-fat; require that students choose a fruit or vegetable; and adopt a
single food-based menu planning style in accordance with determined age/grade
Diets that consist of high quality foods including fruit, vegetables, whole grains,
and plant-based/lean proteins have been linked to reduced all-cause mortality.39
Additionally, associations have been found between adequate fruit and vegetable intake
and successful weight management.12 Between the ages of 5 and 18 years, American
children spend nearly half of their days in school. Therefore, it is justifiable to more
closely examine school meal offerings and student food selection. In 2007, researchers
who conducted a study of interventions related to food exposures to children reported that
food preference and intake of children is affected by the child’s personal experiences
with specific foods and that the earlier in life and broader range of foods to which a child
is exposed, the healthier the child’s diet.40 Additionally, repeated exposures to less
familiar foods contributed to both increased consumption and liking of those items.
School Meal Acceptance
Following the passage of the Healthy, Hunger-Free Kids Act, claims of increased
food waste and its resulting additional financial burden, and a general resounding disdain
for the revised meals became commonplace in the media and from food industry
representatives.41 However, a recent study published by the Robert Wood Johnson
Foundation showed that by the spring of the 2012-2013 school year, administrators in US
public elementary, middle, and high schools indicated that the majority of students
actually expressed some level of enjoyment for the new school meals.42 Cohen et al.
(2014) pointed out that significant plate waste has long been a problem in public school
cafeterias; but interestingly, a reduction in waste was found post-implementation of the
despite the requirements to serve larger portions of and more variety of fruits and
vegetables and provide at least 50% of grain products as whole grains, plate waste
decreased overall. The review also found that the implementation of the HHFKA led to a
23% increase in fruit selection.43 Noting that as of June 2014, 90% of schools
participating in the NSLP have implemented the guidelines of the Healthy, Hunger-Free
Kids Act, a significant potential for overall increased fruit intake exists. 44 Further, initial
studies suggest that the implementation of the HHFKA may be contributing positive
effects to the childhood obesity epidemic. In early 2015, Terry-McElrath, O’Malley, and
Johnston published their findings from a cross-sectional analysis of 22,716 eighth graders
and 30,596 tenth and 12th graders attending schools that participate in the NSLP. The
researchers identified a subset of USDA meal standards and subsequently found a
significant reduction in the odds of overweight/obesity was among high school students
when 3 or more of these components were available in each school meal.45
While regulations are now in place to require that schools offer healthy,
nutrient-dense foods to American students, students are not required to eat them. School
foodservice personnel may retain the ability to directly affect what the children actually
consume. Therein resides great opportunity for schools to utilize their resources, both
human and material, to further influence healthy meal behaviors. Studies show that
producing school meals that are more visually attractive and convenient to the students
generates an increase in both purchasing and consumption.17,18 In 2011, a team from
Cornell University implemented minor procedural and organizational changes to several
New York junior-senior high school cafeterias in the hopes of increasing fruit and
fruit by the cash register and labeling vegetables with appealing descriptions were
employed to incite their selection. Verbal prompting by cafeteria employees was used to
encourage or remind students to choose a produce item as a component of their meal.
Following these cafeteria modifications, fruit and vegetable consumption showed
significant increases of 18% and 25%, respectively.18 Another small study conducted in
a different New York high school offered a convenience, expedited line of only
“healthier” food choices, resulting in an increased proportion of these foods being
consumed.17
Few studies have been conducted to determine the nutrition knowledge of the
school nutrition manager or how this understanding affects the meal selection choices
made by students in the cafeteria, but several support this supposition.19,46,47 A 2013
review published in the American Journal of Public Health explicitly encourages food
service worker nutrition training. The report’s authors found that the nutritional profile
of institutional meals, including those served in school cafeterias, is affected by multiple
factors; among them, the skills and empowerment of food service workers, regulations,
monitoring, and funding. Each of these elements contribute by supplementing worker
skillsets and knowledge. Through proper training, food service employees obtain the
opportunity to improve the nutrition of the foods served and reduce instances of
diet-related diseases diet-related of their customer base.19 Supporting this notion, data from the
2006 School Health Policies and Practices Study Food Service School Questionnaire
indicates that those schools requiring nutrition managers to complete a foodservice
training program present with more healthy overall food preparation and fewer unhealthy
reported that school personnel partaking in an intervention to promote healthy school
environments through school self-assessment and action planning believe that both
students and food service staff should receive nutrition education.47
Smarter Lunchroom Movement
Out of concern for the current eating habits of American children and a desire to
change them, a grassroots movement began in 2009 to create research-based cafeterias
that would yield evidence-based outcomes to drive the evolution of school lunchrooms
into mechanisms of healthful eating promotion. In 2010, Dr. Brian Wansink, of the
Cornell University Food and Brand Lab, and Dr. David Just collaborated to create the
Cornell Center for Behavioral Economics in Child Nutrition Programs (The BEN
Center). The BEN Center’s chief purpose is to generate innovative proposals in the areas
of child health as it relates to the school environment and areas of behavioral science.
Since its inception, the BEN Center has used research from the Food and Brand Lab to
provide schools across the US with evidence-based strategies to drive healthier eating
habits in their students through the Smarter Lunchroom Movement.48
A key focus of the BEN Center and the Smarter Lunchroom Movement is the
application of behavioral economics to school meals. This principle suggests that if
individuals are forced into doing something, they may rebel. Accordingly, that if people
feel they have made a decision on their own, they adopt ownership of and pride in it.
Therefore, the Smarter Lunchroom Movement implies that the key to successful
implementation of federal nutrition mandates, such as the Healthy, Hunger-Free Kids
appear dictatorial. Such changes are characteristically inexpensive: rearranging food
displays so that the more nutrient-dense items are most visible and convenient, placing a
basket of fresh fruit by the cash register, or providing a choice in vegetables, to name a
few.49 A 2012 study published by a group of Smarter Lunchroom researchers found that
when vegetables were given creative names (e.g., “X-ray Vision Carrots”, “Power Punch
Broccoli”, “Silly Dilly Green Beans”), more elementary school opted to add the items to
their tray and subsequently consumed more of the vegetable than those students provided
with the same product with a generic name (e.g., “Food of the Day”).50 This
methodology has been so widely accepted that in 2014 the USDA offered its support with
an award of $5.5 million in grant funding to assist NSLP participating schools in the
implementation of Smarter Lunchroom Movement strategies to increase student selection
of fruits, vegetables, whole grains, legumes and low/no-fat dairy.51
Children’s Healthcare of Atlanta’s Strong4Life
In 2011, the Child and Adolescent Health Measurement Initiative stated that 35%
of children in the state of Georgia are overweight or obese.52 This brands Georgia the 10th
most obese state in the US for children. In an effort to reverse childhood obesity and its
associated diseases in children residing in Georgia, Children’s Healthcare of Atlanta
(CHOA) launched the wellness-focused, community-based Strong4Life arm that same
year, The Strong4Life program uses policy change motions, public awareness
campaigns, partnerships with healthcare providers and community organizations, and
school programs to reach and generate change in families across Georgia.53 Using
its School Nutrition Program to educate cafeteria managers on the importance of proper
nutrition and further empower them of the opportunity they maintain to convey this
significance to students. This training program focuses on the “4 P’s” (“Presentation”,
“Prompting”, “Promotion”, and “Partnerships”): “Presentation” encourages the managers
to place emphasis on attractive, enticing displays and arrangement of foods to promote
nutritious food selection; “Prompting” stresses the effects of a gentle verbal nudge from
the lunch server to the student to select a fruit, vegetable, or other nutrient-dense product;
“Promotion” encourages the use of creative branding, fun menu descriptors, and special
events; and “Partnerships” reinforces the idea that teachers, school administrators,
parents, and the community at large are all in partnership with school nutrition staff in the
19
CHAPTER III
Methods
The proposed study is a secondary analysis of data obtained as part of the
Strong4Life School Nutrition Program. The program began as a pilot study in 2012 in
Fulton County, Georgia and was further rolled out to a group of elementary schools
within the Chatham County school district in 2013. The proposed study will utilize the
Chatham County data. The demographic breakdown of students attending these schools
was 7% Hispanic, 0.3% American Indian, 1.8% Asian, 54.6% black, 0.2% Pacific
Islander, 29.6% white, and 6.5% mixed race in the 2012-13 school year. During the
2013-14 school year, the distribution was 6% Hispanic, 0.3% American Indian, 1.9%
Asian, 54.6% black, 0.1% Pacific Islander, 30.99% white, and 6.2% mixed race.
The Strong4Life School Nutrition Program involves an initial dietitian-led 90 to
120 minute training assembly for school nutrition managers (n=33) in 52 schools during
the annual back-to-school session. Itis accompanied by a pre- and post-survey (Appendix
B) and is facilitated by a PowerPoint presentation (Appendix C) with the following
objectives: to convey the impact the school setting has on student nutrition; to convey the
role of school nutrition providers in improving student nutrition; to identify nutrition
principles that promote healthy behaviors; and to pinpoint low/no cost methods to
encourage healthy choices in the school cafeterias. The surveys focus on general
nutrition knowledge (i.e., “Which of these is an example of a sugary drink?”),
the USDA’s MyPlate recommend to consist of fruits and vegetables?”), and individual
school/job-specific information (i.e., “Which of the following are the top 3 barriers to
serving healthier meals in your schools”). Increase in nutrition knowledge was
determined by an increase in the number of cumulative correct answers in the basic
nutrition session.
To determine if a relationship exists between the knowledge and empowerment
obtained from the training session by nutrition managers and purchasing habits of
students, school production records (Appendix D) were reviewed to describe the
purchases of plain, skim milk compared to higher fat and/or flavored milks and total fruit
and vegetable purchases before and after the Strong4Life training session. Food
production data from 12 elementary schools within the Chatham County school district
was obtained for two separate one week periods. The first collection period, March 11
through 15, 2013, occurred prior to the Strong4Life training. The second collection
period took place from October 14 through 18 of the same year. The data detailed items
prepared and items sold and detailed the specific entrée, side dish, and beverage
component. For purposes of this analysis, total fruits, vegetables, milk types, and juices
were reviewed. Prepared/offered fruits included: sliced peaches, fruit cups, apple
wedges, orange wedges, pears, applesauce, strawberries, pineapple cups, grapefruit,
honeydew, cantaloupe, kiwi, and apples with cranberries. Prepared/offered vegetables
included: broccoli, green beans, corn, carrots, baby carrots with ranch dressing, okra and
tomatoes, Romaine salad, spinach salad, sweet potatoes, collard greens, mixed
skim/no-fat, 1%/low-fat, chocolate, strawberry and vanilla. While not available on a
daily basis and not offered at all included schools, fruit juices were offered during the
study period; flavors included blueberry, orange, apple, grape, apple cherry, and fruit
punch.
The effect of the training session on cafeteria organizational changes to improve
student selection of food items was evaluated using a Cafeteria Observation form
(Appendix E). The evaluation form consists of 21 questions related to the physical
environment of the cafeteria (e.g., fresh fruits and vegetables are displayed at the front of
the line, tasteful wall art is displayed highlighting fun, food-oriented or physical activity
health messages, etc.). An exemption from IRB approval was requested for this study
from the Georgia State University IRB and was received.
Statistical Analysis
The results of the manager pre- and post-training surveys and food production
data were described using frequency statistics. A Wilcoxon signed-rank test was used to
compare pre- and post-survey scores. The percent of food items (e.g., skim milk, apples,
carrots, etc.) purchased before and after the training session were compared.
Organizational changes were categorized as Improved vs. Not Improved. Improved is
defined as a total score of 1 or more points higher on the post-Cafeteria Observation form
than on the pre-Cafeteria Observation form. The numbers awarded for each of the 21
questions represent the practices in line with Smarter Lunchroom Movement practices
and were summed to determine if the cafeteria environment has improved. For example,
received a “1” out of a possible “1”; a “no” received a “0”. Questions 1, 2, 3, 4, 6, 7, 10,
12, 14, 16, 17, 18, 19, 20, and 21 were scored using the following scale: Yes = 1 point,
No = 0 points (as a positive response indicates a practice consistent with the Smarter
Lunchroom Movement). Conversely, questions 5, 8, 9, 11, 13, and 15 were scored using
the following scale: Yes = 0 points, No = 1 point because a positive response is not
consistent with the guidelines. If N/A was selected for any question no points will be
assigned and that school will not be factored into the total allocation for that particular
question. The best practice percentage for each question was compared between the pre-
and post- Cafeteria Observation forms. The purchasing habits of students were
categorized as improved (increase in plain, skim or 1% milk and fruits and vegetables)
vs. declined (flavored and high fat milks, reduction in fruits and vegetables). Statistical
23
CHAPTER IV
Results
A total of 33 school nutrition managers participated in the dietitian-led training
program. Thirty pre-surveys and 33 post-surveys were completed. Identifying
information of the participating managers was limited to the last 4 digits of their phone
number, birth month and birth date. Of the 30 managers who completed both pre- and
post-survey forms, 23 (77%) provided identifying information and were included in this
analysis. The pre- and post-survey forms contained the same four general nutrition
questions, one of which allowed for multiple selections, followed by a series of opinion
questions (Appendix B). Each completed survey was scored using an answer key. The
maximum possible score was 7 points (4 points were allocated for question 1 because it
allowed for multi-answer selection; the remaining three questions received 1 point each).
The average score of the pre-survey was 4.9; the average score of the post-survey was
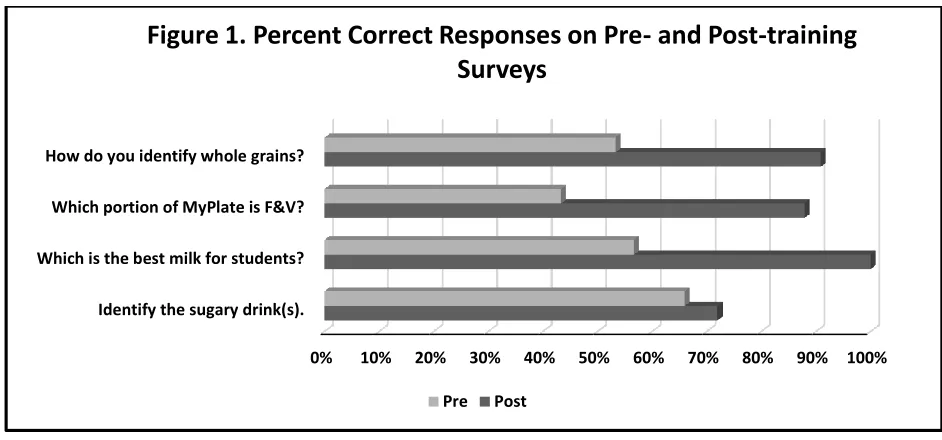
5.8, representing an increase of 18.4%. The percent of correct responses to the first four
questions on the pre- and post-training surveys are shown in Figure 1. Twelve
participants received a higher score after the training session, 10 had no change in score,
and one participant’s score decreased following the training. Improvements were shown
in each of the basic nutrition questions, particularly in the proper identification of the
MyPlate recommended portion of fruits and vegetables. Managers also showed improved
knowledge in utilizing the ingredients list vs. the front of the package labeling or brown
*F&V: Fruits and Vegetables
During the pre-survey, the managers were asked to select three choices from a list
of nine potential barriers to serving healthier meals in their respective schools. The
majority of managers (77%) indicated that students were not interested in healthy meals.
The second and third most common barriers were “too much waste” (40%) and “too
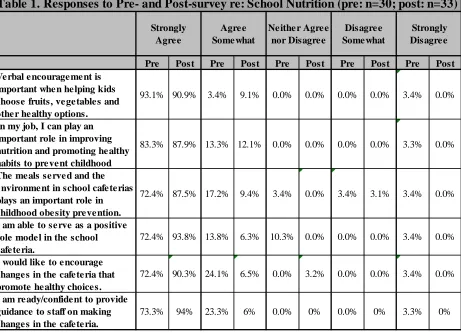
expensive” (33%). Most managers (72%) indicated that they “strongly agree” they
would like to encourage changes in the cafeteria to promote healthy choices and that they
felt confident in their abilities to provide guidance to cafeteria staff to make such changes
(73%) (Table 1). Following the training, 90% of managers strongly agreed that they
would like to encourage healthy changes in the cafeteria and the vast majority (94%)
expressed confidence in their individual ability to guide staff members to make these
changes. In the pre-survey, 86% selected “strongly agree” or “agree somewhat” when
asked if they felt able to serve as positive role models in the school cafeteria. When
asked the same question in the post-survey, all of the managers indicated assurance in
0% 10% 20% 30% 40% 50% 60% 70% 80% 90% 100%
[image:38.612.105.576.69.289.2]Identify the sugary drink(s). Which is the best milk for students? Which portion of MyPlate is F&V? How do you identify whole grains?
Figure 1. Percent Correct Responses on Pre- and Post-training
Surveys
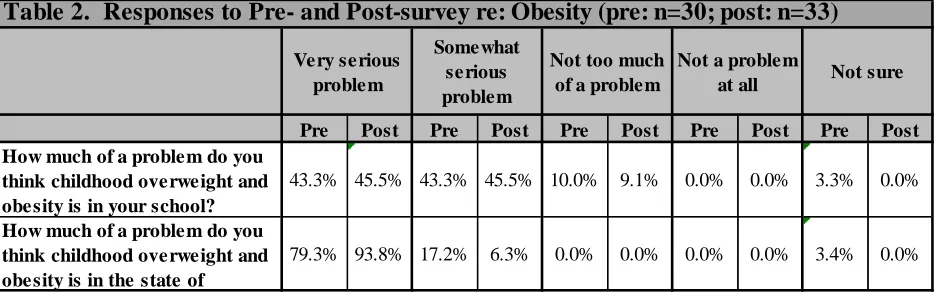
their abilities to act as a positive role model. The pre- and post-surveys also inquired
about the managers’ perception of the severity of overweight and obesity in children in
the state of Georgia and within their particular school(s) in Chatham County. Both
before and after the training, ~90% of managers indicated that obesity and overweight is
a “very serious” or “somewhat serious” problem within Chatham County schools (Table
2). Perception of overweight and obesity being “very serious” or “somewhat serious” in
the state of Georgia increased from 96.5% to 100% following the training.
Pre Post Pre Post Pre Post Pre Post Pre Post Verbal encouragement is
important when helping kids choose fruits, vegetables and other healthy options.
93.1% 90.9% 3.4% 9.1% 0.0% 0.0% 0.0% 0.0% 3.4% 0.0%
In my job, I can play an important role in improving nutrition and promoting healthy habits to prevent childhood
83.3% 87.9% 13.3% 12.1% 0.0% 0.0% 0.0% 0.0% 3.3% 0.0%
The meals served and the environment in school cafeterias plays an important role in childhood obesity prevention.
72.4% 87.5% 17.2% 9.4% 3.4% 0.0% 3.4% 3.1% 3.4% 0.0%
I am able to serve as a positive role model in the school cafeteria.
72.4% 93.8% 13.8% 6.3% 10.3% 0.0% 0.0% 0.0% 3.4% 0.0%
I would like to encourage changes in the cafeteria that promote healthy choices.
72.4% 90.3% 24.1% 6.5% 0.0% 3.2% 0.0% 0.0% 3.4% 0.0%
I am ready/confident to provide guidance to staff on making changes in the cafeteria.
[image:39.612.114.575.295.628.2]73.3% 94% 23.3% 6% 0.0% 0% 0.0% 0% 3.3% 0%
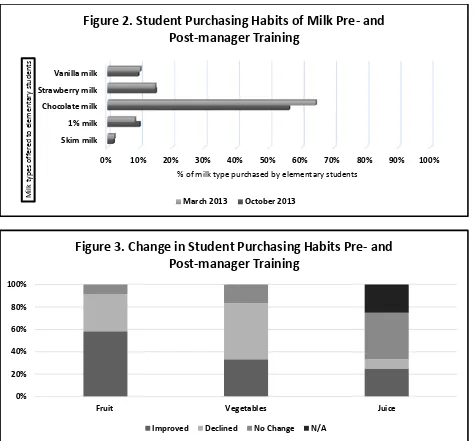
Although the majority of students, both before and after the nutrition manager
training, chose flavored milk over plain, half of the schools (n=6) showed improvement
in the percentage of students who selected skim or 1% non-flavored milk (Figure 2).
Improvements varied from 1% to 18% of total students who selected skim or 1% plain
milk. Seven schools (58.3%) showed an improvement in the percentage of fruit sold
between March and October, whereas 33.3% (n=3) showed an improvement in
vegetables sold during this time period (Figure 3). Conversely, 4 schools showed
decreased sales of both fruits and vegetables in October as compared to March.
Pre Post Pre Post Pre Post Pre Post Pre Post How much of a problem do you
think childhood overweight and obesity is in your school?
43.3% 45.5% 43.3% 45.5% 10.0% 9.1% 0.0% 0.0% 3.3% 0.0%
How much of a problem do you think childhood overweight and obesity is in the state of
79.3% 93.8% 17.2% 6.3% 0.0% 0.0% 0.0% 0.0% 3.4% 0.0%
Not a problem at all Not too much
of a problem Somewhat
serious problem Very serious
[image:40.612.109.576.72.221.2]problem Not sure
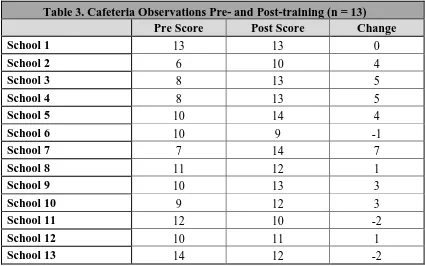
Cafeteria observations were conducted at 19 individual schools, but observations
both prior and post training were completed for only 13 schools. Therefore, only these
13 schools were included in the results. The cafeteria observation form questions and the
best answer for each question is shown in Appendix F. One point was allocated to each
line item in which the best answer was selected for a maximum number of 21 points.
Scores prior to the nutrition manager training ranged from 6 to 14. Scores following the
training ranged from 9 to 14 (Table 3). More than half of the schools (69%; n=9)
0% 10% 20% 30% 40% 50% 60% 70% 80% 90% 100%
Skim milk 1% milk Chocolate milk Strawberry milk Vanilla milk
% of milk type purchased by elementary students
[image:41.612.108.583.68.509.2]M ilk t ype s o ff er ed to e le m ent ar y st ud ent s
Figure 2. Student Purchasing Habits of Milk Pre- and
Post-manager Training
March 2013 October 2013
0% 20% 40% 60% 80% 100%
Fruit Vegetables Juice
Figure 3. Change in Student Purchasing Habits Pre- and
Post-manager Training
improved after the training, whereas the score for 23% (n=3) declined. The remaining
school showed no change between the initial and final observations. The most common
improvement was the placement of fruits and vegetables to provide a colorful variety.
The arrangement of easily visible menu labeling, use of descriptive names for menu
items, and addition of food or nutrition-themed wall art each improved after the training.
Multiple schools chose to display Strong4Life posters or MyPlate depictions; one school
chose to create their own owl-themed display entitled “Who Grows Strong with Good
Nutrition? Everyone!”. The list of schools in which food production data was collected
did not mirror the list of schools of which cafeteria observations were performed;
complete production data and cafeteria observations were collected for just 10 schools.
Therefore, we were unable to determine if the cafeteria environment contributed to a
[image:42.612.107.532.430.696.2]change in student sales.
Table 3. Cafeteria Observations Pre- and Post-training (n = 13)
Pre Score Post Score Change
School 1 13 13 0
School 2 6 10 4
School 3 8 13 5
School 4 8 13 5
School 5 10 14 4
School 6 10 9 -1
School 7 7 14 7
School 8 11 12 1
School 9 10 13 3
School 10 9 12 3
School 11 12 10 -2
School 12 10 11 1
29
CHAPTER V
Discussion & Conclusion
Discussion
The purpose of this study was to determine if school nutrition managers
demonstrated an increase in nutrition knowledge and belief in the importance of their role
as nutrition providers after attending a dietitian led training session. We hypothesized that
the managers’ knowledge would increase after the training session and that they would
enact changes to the presentation of food in the cafeteria that would then lead to an
increase in the purchase of more nutrient-dense food and beverage offerings by students.
We found that nutrition managers presiding over elementary schools within the same
school district displayed increase in nutrition knowledge and belief in themselves as
nutrition role models and that they implemented changes within the school cafeterias to
promote positive nutrition behaviors after the training. Therefore, we reject our first null
hypothesis. Additionally, changes were seen both in student food and beverage selection
and in the school cafeteria operations. Because of these changes, we also reject our
second hypotheses.
Following the dietitian-led training session, managers overall showed increased
basic nutrition knowledge. Improvements were observed for each of the questions.
Understanding of the portion size of fruits and vegetables related to the MyPlate figure
increased from 43% prior to training to almost 88% following the training; identification
following completion of the training, the majority of managers indicated a belief in the
importance of their role and the school cafeteria environment itself in promoting healthy
eating behaviors and in childhood obesity prevention. As a group, a 21% increase was
shown post-training in both manager belief in their ability to serve as positive role models
in the cafeteria and in their individual ability to provide guidance to staff to facilitate
positive changes in the cafeteria. Post-training, school nutrition managers’ perception of
the overweight and obese problem amongst students in their respective schools remained
the same. The number of overweight and obese students in Chatham County schools is
not available, but a third of children in the state of Georgia overall are currently
overweight and obese52. The percentage of managers that indicated overweight and
obese is a “very serious problem” in the state of Georgia more than doubled on the
[image:44.612.115.530.429.589.2]post-test, showing a much improved understanding of the severity of the obesity epidemic.
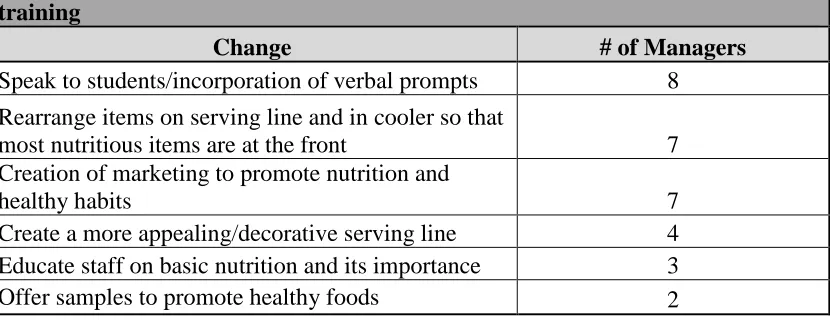
Table 4. Changes Nutrition Managers Indicated they will Implement Post-training
Change # of Managers
Speak to students/incorporation of verbal prompts 8 Rearrange items on serving line and in cooler so that
most nutritious items are at the front 7 Creation of marketing to promote nutrition and
healthy habits 7
Create a more appealing/decorative serving line 4 Educate staff on basic nutrition and its importance 3 Offer samples to promote healthy foods 2
More than two-thirds of schools included in the cafeteria observations reviews
showed improvement following the nutrition training (69%); just over half of these
managers were asked to provide detail of the changes they intended to incorporate into
their cafeterias (Table 4). Approximately a third of the managers specified an intention
to incorporate verbal prompting to encourage student selection of fruits, vegetables, and
other nutrient dense foods. However, the percentage of schools actually employing this
technique in the post-training observation remained at zero. It was noted that many of
these schools were serving “pre-portioned meals”, but cafeteria staff still retain the ability
to encourage the students to try the fruits and vegetables in the meal. The incorporation of
marketing to promote healthy habits and adjusting the placement of foods on the serving
line to highlight the most nutrient-dense items were also popular suggested changes from
the managers. In the pre-observation, almost 70% of schools displayed nutrition or
healthy habit wall art and promotion within the cafeteria; in the post-observation, 100%
of schools were utilizing such marketing tools. In the post-observation period, only two
of the schools (15%) had moved the flavored milks to the back of the cooler to make low
and no-fat milk the most prominent and easily accessible option. But, 46% of schools
repositioned the hot serving line to showcase the vegetables first; 15% already had this
arrangement in place during the pre-observation.
The majority of students showed improved selection of fruit items in the sample
of schools days reviewed after the manager training. Vegetable selection actually
decreased between the two time periods. Purchase of 1% milk increased during this time,
but purchase of skim milk decreased slightly. Flavored milk purchases decreased overall,
with chocolate milk selection specifically decreasing more than 8% throughout the time
period that was examined. Comparatively, the offering of flavored milk, in particular
included in this exercise, more than half of milk offered to students was chocolate. In
one school in particular, 77% of milk provided was chocolate. The distribution of change
in purchasing habits of juice was more varied: over 8% of schools showed an increase in
the selection of juice following the manager training, whereas 25% showed decreased
purchase of juice during this time. Of the remaining schools, a quarter did not indicate
the provision of juice at all and more than 40% showed no change in juice purchasing
habits. Considering the data collected, no determinations can be made regarding the cause
of this perceived behavior change.
Prior to this analysis, we intended to investigate if a change in manager nutrition
knowledge and/or beliefs in the importance of proper nutrition contributed to changes in
the school cafeteria nutrition environment. Further, we expected to examine if an
association exists between these changes in the school cafeteria and variations in student
purchasing habits. However, the design of the Strong4Life training program did not
provide adequate identifying information to allow for a linkage between the two data sets.
This study has multiple limitations. The inability to link the change in student
purchasing behaviors and the knowledge obtained and/or transformed perspectives of the
school nutrition managers is the primary restraint. The managers were not asked to
provide their names in the pre or post surveys as a manner of privacy. However, the
inclusion of a unique identifier that would relate to the individual schools in which he or
she oversees would allow for a relationship to be derived between any pre and post
training changes in the survey responses, school cafeteria observations, and purchasing
The pre and post surveys did not request demographic information (e.g., race,
number of schools managed, tenure as school nutrition manager, etc.). The inclusion of
this information would be helpful to draw further conclusions based upon the individual
responses. Overweight and obese occurrence rates of students would also allow for
further analysis as it relates to nutrition manager knowledge of nutrition and the obesity
epidemic.
We have several concerns about the accuracy of the food production data. The
food production reports, provided by representatives from the Chatham County school
district, detailed the number of each food and beverage item prepared and served.
Frequently, these numbers matched exactly (e.g., 350 portions of carrots prepared and
350 portions of carrots served/sold). Additionally, several of the school food production
data sets provided incomplete data. In these instances, one or more of the ten analyzed
school days indicated that “0” servings of all foods and beverages were prepared and
subsequently sold. The data for these schools was not used, contributing to a reduced
sample size. In future iterations of this program, pre- and post-manager training food
production reports and cafeteria observations are needed for all schools in which a
nutrition manager participates in the training exercise. It is also important to note that
benchmark food production data was provided from the spring semester of the 2012 –
2013 school year, whereas the post – training data was generated from the fall semester
of the 2013 – 2014 school year. This time difference suggests that the sample of students
Conclusion
School nutrition managers showed increased nutrition knowledge and belief in
their individual ability to act as a role model in the school cafeteria after completing a
dietitian-led training session. We were unable to evaluate the association between
increased nutrition knowledge of managers and changes in student food purchasing habits
due to the lack of key identifier between data sets. Future iterations of this training
program should include collection of the name of the school(s) in which the manager
presides to determine association between increased nutrition knowledge and/or changed
35
REFERENCES
1. Ogden CL, Carroll MD, Kit BK, Flegal KM. Prevalence of childhood and adult obesity in the united states, 2011-2012. JAMA. 2014;311(8):806-814.
doi:10.1001/jama.2014.732.
2. Freedman DS, Mei Z, Srinivasan SR, Berenson GS, Dietz WH. Cardiovascular risk factors and excess adiposity among overweight children and adolescents: the Bogalusa Heart Study. J Pediatr. 2007;150(1):12-17.e2.
doi:10.1016/j.jpeds.2006.08.042.
3. Whitlock EP, Williams SB, Gold R, Smith PR, Shipman SA. Screening and interventions for childhood overweight: a summary of evidence for the US Preventive Services Task Force. Pediatrics. 2005;116(1):e125-e144. doi:10.1542/peds.2005-0242.
4. Han JC, Lawlor DA, Kimm SYS. Childhood obesity. Lancet. 2010;375(9727):1737-1748. doi:10.1016/S0140-6736(10)60171-7.
5. Sutherland ER. Obesity and asthma. Immunol Allergy Clin North Am. 2008;28(3):589-602, ix. doi:10.1016/j.iac.2008.03.003.
6. Taylor ED, Theim KR, Mirch MC, et al. Orthopedic complications of overweight in children and adolescents. Pediatrics. 2006;117(6):2167-2174.
doi:10.1542/peds.2005-1832.
7. Whitaker RC, Wright JA, Pepe MS, Seidel KD, Dietz WH. Predicting obesity in young adulthood from childhood and parental obesity. N Engl J Med.
1997;337(13):869-873. doi:10.1056/NEJM199709253371301.
8. Biro FM, Wien M. Childhood obesity and adult morbidities. Am J Clin Nutr. 2010;91(5):1499S - 1505S. doi:10.3945/ajcn.2010.28701B.
9. Bishop J, Middendorf R, Babin T, Tilson W. ASPE Research Brief - Childhood Obesity. US Dep Health Hum Serv. August 2005.
http://aspe.hhs.gov/health/reports/child_obesity/index.cfm. Accessed January 17, 2015.
11. Livingston E, Zylke JW. Jama obesity theme issue: Call for papers. JAMA. 2012;307(9):970-971. doi:10.1001/jama.2012.262.
12. Rolls BJ, Ello-Martin JA, Tohill BC. What Can Intervention Studies Tell Us about the Relationship between Fruit and Vegetable Consumption and Weight
Management? Nutr Rev. 2004;62(1):1-17. doi:10.1111/j.1753-4887.2004.tb00001.x.
13. Kim SA, Moore LV, Galuska D, et al. Vital Signs: Fruit and Vegetable Intake Among Children -- United States, 2003-2010. MMWR Morb Mortal Wkly Rep. 2014;63(31):671-676.
14. USDA Economic Research Service - Balancing Nutrition, Participation, and Cost in the National School Lunch Program. http://www.ers.usda.gov/amber-waves/2008- september/balancing-nutrition,-participation,-and-cost-in-the-national-school-lunch-program.aspx#.VLVJnSvF8qo. Accessed January 13, 2015.
15. Stallings VA, West Suitor C, Taylor CL. School Meals: Building Blocks for Healthy Children. Washington, DC: Institute of Medicine of the National Academies;
2009:380. http://books.nap.edu/openbook.php?record_id=12751&page=1. Accessed November 25, 2014.
16. Healthy Hunger-Free Kids Act. http://www.fns.usda.gov/school-meals/healthy-hunger-free-kids-act. Accessed November 26, 2014.
17. Hanks AS, Just DR, Smith LE, Wansink B. Healthy convenience: nudging students toward healthier choices in the lunchroom. J Public Health. 2012;34(3):370-376. doi:10.1093/pubmed/fds003.
18. Hanks AS, Just DR, Wansink B. Smarter Lunchrooms Can Address New School Lunchroom Guidelines and Childhood Obesity. J Pediatr. 2013;162(4):867-869. doi:10.1016/j.jpeds.2012.12.031.
19. Tsui EK, Deutsch J, Patinella S, Freudenberg N. Missed Opportunities for Improving Nutrition Through Institutional Food: The Case for Food Worker Training. Am J Public Health. 2013;103(9):e14-e20.
20. Gunderson GW. Background and Development. U S Dep Agric Food Nutr Serv. http://www.fns.usda.gov/nslp/history. Accessed November 20, 2014.
21. Cronan ML. The School Lunch. Peoria, Ill., C.A. Bennett Co; 1962.
http://archive.org/details/schoollunch00cronrich. Accessed November 20, 2014.
22. Gunderson GW. Early Programs by States. U S Dep Agric Food Nutr Serv. http://www.fns.usda.gov/nslp/history_2. Accessed November 20, 2014.