Georgia State University
ScholarWorks @ Georgia State University
Business Administration Dissertations Programs in Business Administration
Spring 5-3-2015
How are Electric Utilities Responding to the
Impact of Renewables? Exploring an Integrative
Approach to Ambidextrous Business Behavior
Robert T. Casey JrGeorgia State University
Follow this and additional works at:https://scholarworks.gsu.edu/bus_admin_diss
This Dissertation is brought to you for free and open access by the Programs in Business Administration at ScholarWorks @ Georgia State University. It has been accepted for inclusion in Business Administration Dissertations by an authorized administrator of ScholarWorks @ Georgia State University. For more information, please [email protected].
Recommended Citation
Casey, Robert T. Jr, "How are Electric Utilities Responding to the Impact of Renewables? Exploring an Integrative Approach to Ambidextrous Business Behavior." Dissertation, Georgia State University, 2015.
PERMISSION TO BORROW
In presenting this dissertation as a partial fulfillment of the requirements for an advanced degree from Georgia State University, I agree that the Library of the University shall make it available for inspection and circulation in accordance with its regulations governing materials of this type. I agree that permission to quote from; to copy from, or publish this dissertation may be granted by the author or, in his/her absence, the professor under whose direction it was written or, in his absence, by the Dean of the Robinson College of Business. Such quoting, copying, or publishing must be solely for the scholarly purposes and does not involve potential financial gain. It is understood that any copying from or publication of this dissertation which involves potential gain will not be allowed without written permission of the author.
ii
NOTICE TO BORROWERS
All dissertations deposited in the Georgia State University Library must be used only in
accordance with the stipulations prescribed by the author in the preceding statement.
The author of this dissertation is:
Robert Thomas Casey, Jr
J. Mack Robinson College of Business
Georgia State University
Atlanta, Georgia 30303
The director of this dissertation is:
Dr. Karen Loch
Institute of International Business
J. Mack Robinson College of Business
Georgia State University
iii
How are Electric Utilities Responding to the Impact of Renewables?
Exploring an Integrative Approach to Ambidextrous Business Behavior
By
Robert Thomas Casey, Jr.
A Dissertation Submitted in Partial Fulfillment of the Requirements for the Degree
Of
Doctorate of Business
In the Robinson College of Business
Of
Georgia State University
GEORGIA STATE UNIVERSITY
ROBINSON COLLEGE OF BUSINESS
iv Copyright by
Robert Thomas Casey, Jr.
v
ACCEPTANCE
This dissertation was prepared under the direction of Robert Thomas Casey, Jr. Dissertation
Committee. It has been approved and accepted by all members of that committee, and it has
been accepted in partial fulfillment of the requirements for the degree of Doctoral of Philosophy
in Business Administration in the J. Mack Robinson College of Business of Georgia State
University.
Richard D. Phillips, Dean
DISSERTATION COMMITTEE
Dr. Karen Loch (Chair)
Dr. Steven Olson
vii
TABLE OF CONTENTS
LIST OF TABLES ... IX
LIST OF FIGURES ... X
LIST OF ABBREVIATIONS ... XII
I INTRODUCTION... 1
I.1 Electric Utility Background ... 4
I.2 Disruptive Innovations ... 7
II LITERATURE REVIEW ... 9
II.1 EU Business Model ... 9
II.2 Organizational Ambidexterity ... 15
II.3 Sensemaking ... 18
II.4 Competing Values Framework ... 21
III STUDY DESIGN ... 24
III.1 Data Analysis ... 30
III.1.1 Stage 1 - Code the narratives describing the EU business model process ... 33
III.1.2 Stage 2 - Identify the four forms of EU Leader and Stakeholder Interactions ... 34
III.1.3 Stage 3 - Identify the differing patterns between IOUs and Co-ops ... 35
IV RESULTS ... 37
IV.1 Hawaii - Pacific Region: KIUC (Co-op) and HEI (IOU) ... 37
IV.1.1 Guided Sensemaking and Contextual Ambidexterity ... 37
IV.1.2 Hawaii business model changes and OA ... 39
IV.1.3 Identified differing business model patterns of HEI (IOU) and KIUC (Co-op) .... 41
IV.1.4 Analysis for Hawaii ... 44
viii
IV.2.2 Colorado business model changes and OA ... 53
IV.2.3 Identified differing business model patterns of Tri-State (Co-op) and Sangre de Cristo (Co-op) ... 55
IV.3 Vermont - Northeast Region: Green Mountain (IOU) and VEC (Co-op) ... 62
IV.3.1 Restricted Sensemaking and Structural Ambidexterity ... 62
IV.3.2 Vermont business model changes and OA ... 63
IV.3.3 Identified differing business model patterns of GMP (IOU) and VEC (Co-op) .... 64
IV.4 Georgia and Carolinas - Southeast Region: Georgia Power Company (IOU), Georgia Electric Membership Corporation (Co-op), Duke Energy (IOU), Electric Cooperatives of South Carolina (Co-op), Santee Cooper (State-owned) ... 76
IV.4.1 Restricted Sensemaking and Structural Ambidexterity ... 76
IV.4.2 Georgia and South Carolina business model changes and OA ... 77
IV.4.3 Identified differing business model patterns between IOUs and Co-ops ... 79
V DISCUSSION ... 98
V.1.1 Effects of the EU Business Model and Competing Values Framework on OA ... 99
V.1.2 Patterns that differ between IOUs and Co-ops (Refer to Table 19) ... 102
VI CONCLUSIONS AND LIMITATIONS ... 112
VII IMPLICATIONS FOR PRACTICE AND FUTURE RESEARCH ... 116
VIII REFERENCES ... 120
IX APPENDIX A: EU INTERVIEW PROTOCOL ... 124
ix
LIST OF TABLES
Table 1 IOU and Co-op Characteristics ... 2
Table 2 EU Business Model Components ... 12
Table 3 Electric Utility Solar PV Disruptive Character ... 14
Table 4 Summary of Interview Data Sources ... 27
Table 5 KIUC Interview Common Issues and Response ... 43
Table 6 HEI Interview Common Issues and Response ... 44
Table 7 Hawaii Solar Regulatory Summary from DSIRE* ... 51
Table 8 Tri-State Interview Common Issues and Response ... 57
Table 9 Sangre de Cristo Common Issues and Response ... 58
Table 10 Colorado Solar Regulatory Summary from DSIRE* ... 61
Table 11 VEC Interview Common Issues and Response ... 67
Table 12 GMP Interview Common Issues and Response ... 67
Table 13 Vermont Solar Regulatory Summary from DSIRE* ... 75
Table 14 GPC Interview Common Issues and Response ... 82
Table 15 GEMC Interview Common Issues and Response ... 83
Table 16 Duke Energy / Santee Cooper Interview Common Issues and Response ... 84
Table 17 ECSC Interview Common Issues and Response ... 84
Table 18 Georgia and South Carolina Solar Regulatory Summary from DSIRE*... 98
x
LIST OF FIGURES
Figure 1 Electric Utility Disruptive Innovation (Solar Energy) ... 3
Figure 2 Evolution of the Electric Utility Industry Regulatory Environment ... 7
Figure 3 Richter (2011) EU Renewable Energy Business Models ... 11
Figure 4 Electric Utility Solar PV Disruptive Model ... 14
Figure 5 Four Forms of Organizational Sensemaking ... 21
Figure 6 Competing Values Leadership Framework (CVF) ... 23
Figure 7 2013 Solar State Rankings... 26
Figure 8 State Renewable Portfolio Standards ... 30
Figure 9 Data Analysis Flow Chart ... 32
Figure 10 Integrating Business Model Changes with CVF to Interpret OA... 36
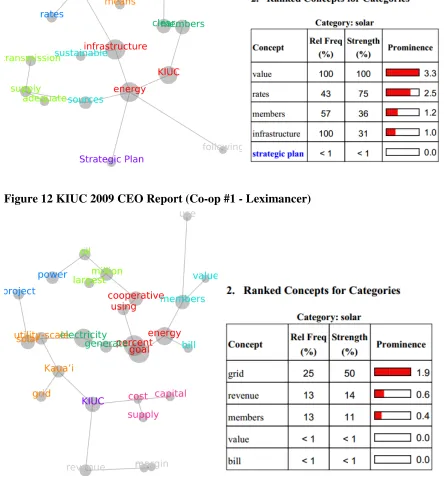
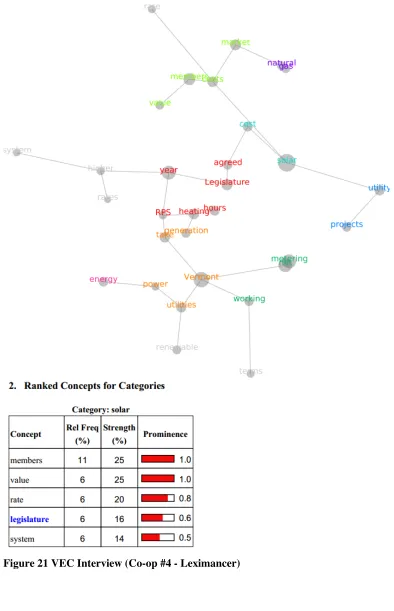
Figure 11 KIUC Interview (Co-op #1 - Leximancer) ... 46
Figure 12 KIUC 2009 CEO Report (Co-op #1 - Leximancer) ... 47
Figure 13 KIUC 2013 CEO Report (Co-op #1 - Leximancer) ... 47
Figure 14 HEI Interview (IOU #1 - Leximancer) ... 48
Figure 15 HEI 2009 CEO Report (IOU #1 - Leximancer) ... 49
Figure 16 HEI 2013 CEO Report (IOU #1 - Leximancer) ... 49
Figure 17 Tri-State Interview (Co-op #2 - Leximancer) ... 59
Figure 18 Tri-State 2009 Ceo Report (Co-Op #2 - Leximancer)... 59
Figure 19 Tri-State 2013 CEO Report (Co-op #2 - Leximancer) ... 60
Figure 20 Sangre de Cristo Interview (Co-op #3 - Leximancer) ... 60
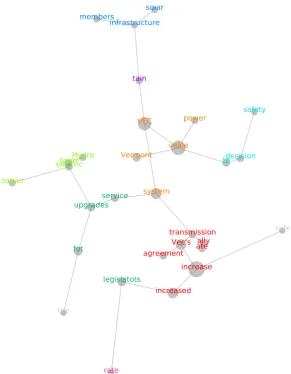
Figure 21 VEC Interview (Co-op #4 - Leximancer) ... 69
Figure 22 VEC 2009 CEO Report (Co-op #4 - Leximancer) ... 70
Figure 23 VEC 2013 CEO Report (Co-op #4 - Leximancer) ... 71
Figure 24 Green Mountain Interview (IOU #2 - Leximancer) ... 72
Figure 25 Green Mountain 2009 CEO Report (IOU #2 - Leximancer) ... 73
Figure 26 Green Mountain 2013 CEO Report (IOU #2 - Leximancer) ... 73
Figure 27 GPC Interview (IOU #3 - Leximancer) ... 86
Figure 28 GPC 2009 CEO/IRP Report (IOU #3 - Leximancer) ... 87
Figure 29 GPC 2013 CEO/IRP Report (IOU #3 - Leximancer) ... 88
Figure 30 GEMC 2009 CEO Report (Co-op #5 - Leximancer)... 89
xi
Figure 32 GEMC Interview (Co-Op #5 - Leximancer) ... 91
Figure 33 Duke Energy Interview (IOU #4 - Leximancer) ... 92
Figure 34 Duke Energy 2009 CEO Report (IOU #4 - Leximancer) ... 92
Figure 35 Duke Energy 2013 CEO Report (IOU #4 - Leximancer) ... 93
Figure 36 ECSC Interview (Co-op #6 - Leximancer) ... 94
Figure 37 ECSC 2009 CEO Report (Co-op #6 - Leximancer) ... 94
Figure 38 ECSC 2013 CEO Report (Co-op #6 - Leximancer) ... 95
Figure 39 Santee Cooper Interview (Leximancer) ... 95
Figure 40 Santee Cooper 2009 Report (Leximancer) ... 96
Figure 41 Santee Cooper 2013 CEO Report (Leximancer) ... 97
Figure 42 OA Analysis using Sensemaking Forms and CVF for Solar PV (Hawaii) ... 108
Figure 43 OA Analysis using Sensemaking Forms and CVF for Solar PV (Colorado) ... 109
Figure 44 OA Analysis using Sensemaking Forms and CVF for Solar PV (Vermont) ... 110
xii
LIST OF ABBREVIATIONS
ARRA – American Recovery and Reinvestment Act of 2009
ASI – Advanced Solar Initiative
BOD – Board of Directors
CAA – Clean Air Act
CPP – Clean Power Plan
CPS – Carbon Pollution Standards
DER – Distributed Energy Resources
PUC – Public Utility Commission
CVF – Competing Values Framework
Co-op – Electric Cooperative
DSIRE* – Database of State Incentives for Renewables and Efficiency
DSM – Demand-Side Management
ECSC – Electric Cooperatives of South Carolina
EPA – Environmental Protection Agency
EU – Electric Utilities
G&T – Generation and Transmission
GEMC – Georgia Electric Membership Corporation
GMP – Green Mountain Power
GPC – Georgia Power Company
HEI – Hawaiian Electric Industries
IOU – Investor-owned Electric Utility
IRP – Integrated Resource Plan
KIUC – Kaua’i Island Utility Cooperative
kWh – Kilowatt hour
NEM – Net-Metering
xiii
NRECA – National Rural Electric Cooperative Association
OA – Organizational Ambidexterity
PPA – Power Purchase Agreement
PSC – Public Service Commission
PV – Photovoltaics
REC – Renewable Energy Credit
ROI – Return on Investment
RPS – Renewable Portfolio Standard
SM – Sensemaking
VEC – Vermont Electric Cooperative
xiv ABSTRACT
How are Electric Utilities Responding to the Impact of Renewables?
Exploring an Integrative Approach to Ambidextrous Business Behavior
By
Robert Thomas Casey, Jr.
April 20, 2015
Committee Chair: Dr. Karen Loch
Major Academic Unit: Robinson College of Business
In the U.S., clean energy goals and the move towards a clean energy economy are
causing the electric power sector to add emerging and innovative renewable energy resources
into their generation mix. Electric utilities (EU) face a monumental challenge to create, deliver,
and capture value from emerging and disruptive technologies. This study seeks to address the
impact of solar photovoltaics on the EU market by investigating the role of business model
changes within the domain of urban and rural U.S. electric utility organizations. By integrating
the evolving EU business model with the Competing Values Framework (CVF), a new lens is
created to assess the changing and evolving business behavior within the EU industry.
Furthermore, a predictive and prescriptive tool emerges associated with organizational
ambidexterity (OA). Finally, four lessons are presented that will help EU leaders become more
1
I INTRODUCTION
Recently, the Senate Energy and Natural Resources Committee held a hearing that examined the
state of technological innovation related to the electric industry. Senator Lisa Murkowski
(R-Alaska), chairman of the committee, stated that “a combination of market forces, technological
innovation, and policy directives at both the federal and the state levels could well result in an
unprecedented transformation of the electricity sector" (U.S. Senate Committee on Energy and
Natural Resources, March 2015). This transformation is not just a U.S. phenomenon but across
the globe the electric power sector has added emerging and innovative renewable energy
resources into their electric power generation mix to fight climate change and resource depletion.
Electric utilities (EU) in the U.S. are now faced with a challenge of negotiating, managing, and
responding to emerging and disruptive renewable technologies.
The U.S. electric power industry has three types of EU service providers: 1) investor-owned
utilities, 2) electric cooperatives, and 3) municipal electric utilities. Since investor-owned electric
utilities (IOU) serve more than two-thirds of the urban U.S. population and electric cooperatives
(Co-op) serve about three quarters of the U.S. landmass they were included in this study. IOUs
and Co-ops have significant structural and operational differences. An IOU is a privately-owned
electric utility whose stock is publicly traded, is cost-of-service regulated by the state and is
authorized to achieve an allowed rate-of-return. A Co-op is a private, not-for-profit business
governed by their consumers and generally exempt from Federal income tax laws. Federal
guidelines require that all Co-ops have democratic governance and operate at cost. Consumers
elect local boards that oversee the Co-op which must return revenue above what is needed for
operation to the consumer. A Co-op generates, transmits, and/or distributes supplies of electric
2
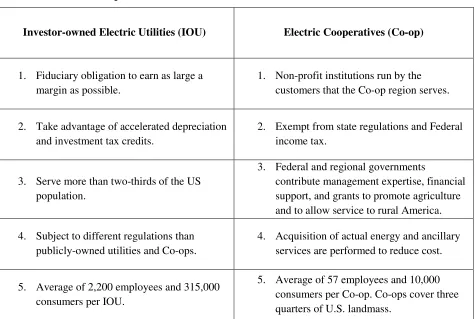
initially financed by the Rural Utilities Service and typically serve rural America (U.S. EIA,
[image:17.612.72.547.146.465.2]2014). Table 1 summarizes the main characteristics of both types of EUs.
Table 1 IOU and Co-op Characteristics
Investor-owned Electric Utilities (IOU) Electric Cooperatives (Co-op)
1. Fiduciary obligation to earn as large a margin as possible.
1. Non-profit institutions run by the customers that the Co-op region serves.
2. Take advantage of accelerated depreciation and investment tax credits.
2. Exempt from state regulations and Federal income tax.
3. Serve more than two-thirds of the US population.
3. Federal and regional governments
contribute management expertise, financial support, and grants to promote agriculture and to allow service to rural America.
4. Subject to different regulations than publicly-owned utilities and Co-ops.
4. Acquisition of actual energy and ancillary services are performed to reduce cost.
5. Average of 2,200 employees and 315,000 consumers per IOU.
5. Average of 57 employees and 10,000 consumers per Co-op. Co-ops cover three quarters of U.S. landmass.
IOUs and Co-ops have been slow to change in the last 35 years. However, IOUs and Co-ops
have recently witnessed an ever-growing and continuous pressure to change due to the disruptive
technology of solar energy. A 2013 report from the Edison Electric Institute shows the degree of
impact of these disruptive forces and proposes a possible electric utility death spiral due to
decreases in solar PV cost, increases in regulatory environment pressure, and changes in
Figure 1 Electric Utility Disruptive Innovation (Solar
As technological and economic changes challenge and transform the
changes (or “disruptive challenges”) arise due to a convergence of factors
“…falling costs of distributed
(DER); increasing customer, regulatory encourage selected technologies;
growth trends; and rising electricity prices in certain areas of the country
Decreases in sales growth create a downward
decrease in revenue causes EUs to raise rates
to consider the further implementation of alternative t
centralized EU business model is
technologies and the related customer behavioral changes that reduce
3
Electric Utility Disruptive Innovation (Solar Energy)
As technological and economic changes challenge and transform the EU business model
changes (or “disruptive challenges”) arise due to a convergence of factors:
falling costs of distributed solar generation and other distributed energy (DER); increasing customer, regulatory, ...government environmental programs to encourage selected technologies; the declining price of natural gas; slowing economic growth trends; and rising electricity prices in certain areas of the country
create a downward cycle which is driven by disruptive forces
EUs to raise rates to cover fixed costs, thereby prompting customers
further implementation of alternative technologies. Therefore, the
model is very likely to come from these new solar photovoltaic
customer behavioral changes that reduce electrical load. ( Energy)
business model, these
generation and other distributed energy resources programs to the declining price of natural gas; slowing economic growth trends; and rising electricity prices in certain areas of the country.” (EEI, 2013)
driven by disruptive forces. This
to cover fixed costs, thereby prompting customers
refore, the threat to the
solar photovoltaic
4
The purpose of this study is to consider the effects of solar photovoltaics on the EU market.
Specifically, it investigates the role of EU business model changes within the domain of IOU
(urban) and Co-op (rural) U.S. electric utility organizations. By using an integrative approach
with Cameron, Quinn, DeGraff, and Thakor’s (2006) Competing Values Framework (CVF) and
Richter’s (2011) EU business model, an assessment can be made to understand how IOUs and
Co-ops have changed between 2009 and 2014. Through this assessment, a predictive and
prescriptive tool emerges that enables EU leaders to interpret to what extent they have shown
ambidextrous behaviors to embrace solar energy and how they can become more anticipatory,
adaptable, and responsive to a shifting environment.
The two research questions to be addressed in this study are: 1) How have EUs responded to a
shift in their environment from 2009 - 2014 due to a disruptive solar technology? and 2) What
are the discernable business model patterns and OA behaviors that differ between
investor-owned (urban) and electric cooperative (rural) EUs in response to a disruptive solar
technology?
I.1 Electric Utility Background
To better grasp and respond to what is happening in their environments, IOUs and Co-ops use an
integrated resource planning (IRP) process which evaluates the costs and benefits of both
demand-side and supply-side resources to develop the least total-cost mix of electric utility
resource options over a twenty-year period (U.S. Department of Energy).
The Tri-State Generation and Transmission op in Colorado, which serves 18 distribution
Co-ops with generation and transmission resources, says the IRP has become a formal process
5
of 1992 (Tri-State IRP, 2010). This process is a critical tool for balancing the ability to see new
opportunities while maintaining a focus on current operating advantages. An IRP is typically
submitted every three years by the EU to the state’s Public Service Commission (PSC) for
approval (GPC IRP, 2013). The IRP is like organizational radar, allowing decision-makers to
develop an early warning system for potentially devastating disruptive technologies, third-party
competitor developments, and other electric utility industry shifts.
Some state IRP rules have remained unchanged since they were first implemented; other states
have amended, repealed, and in some cases reinstated their IRP rules. Rules that have been
amended often reflect current concerns in the electric industry such as fuel costs and volatility,
the effects of power generation on air and water, issues of national security, electricity market
conditions, and climate change, as well as individual state concerns. At Georgia Power
Company, the 2013 IRP results were formulated by using multiple scenario planning cases which
evaluated the impacts of three different fuel price views and three different carbon/renewable
generation views (GPC IRP, 2013). Co-ops typically propose a 15 year resource planning
process that is revised every 5 years. Co-ops are not regulated by the state PSC and therefore are
not required to submit a long-term resource plan for approval.
Both the IOU and Co-op are being impacted by the emergence of solar PV which has been
triggered primarily by two pieces of federal legislation. The first piece of legislation, the
American Recovery and Reinvestment Act of 2009 (ARRA), is an economic stimulus package
enacted by the 111th United States Congress in February 2009 and signed into law on February
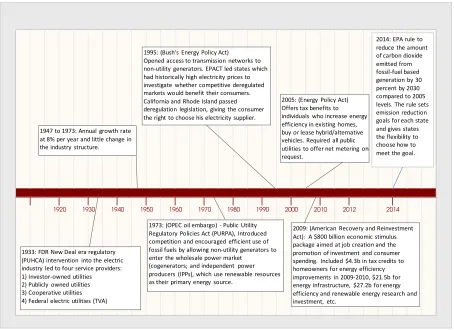
17, 2009, by President Barack Obama (Pub. L. 111–5). The ARRA (Figure 2) is an $800 billion
6
spending. This act allocated $4.3B in tax credits to homeowners for energy efficiency
improvements (2009 - 2010 extended to 2016), $21.5B for energy infrastructure, and $27.2B for
energy efficiency and renewable energy research and investment. The second piece of
legislation, under the Clean Air Act (CAA), is President Obama’s Climate Action Plan (CAP)
which includes two sections: Section 111(d) commonly called the Clean Power Plan (CPP) and
Section 111(b) commonly called the Carbon Pollution Standards (CPS). How did these two
pieces of legislation trigger the growth of solar energy use and technology?
President Obama’s Climate Action Plan, which encourages use of renewables and is supported
by the U.S. Environmental Protection Agency (EPA), has been introduced in three stages. The
plan first proposed cutting carbon pollution from new and existing power plants by creating
targets for fossil-fuel carbon dioxide emissions and mandated that CO2 emitted from fossil-fuel
based generation must be reduced by 30 percent by 2030 as compared to 2005 levels. Current
proposals include a specific emission reduction target for year 2030 for each state with a one
year deadline for an implementation plan to meet the targets. The EPA CAA Fact Sheet (U.S.
EPA) shows these milestones:
1. January 2013, EPA proposed standards to limit carbon pollution from new power plants.
2. June 2014, EPA proposed the CPP to limit carbon pollution from existing power plants.
3. June 2015, EPA plans to propose a federal plan to meet CPP goals for comment.
4. June 2016, proposed due date for states to submit compliance plans to EPA.
5. June 2020, proposed beginning of the CPP compliance period.
The CAA proposes to let states meet emission targets for power plants through plant upgrades,
by switching from coal to natural gas, and by improving energy efficiency or promoting
7
efficiency gains that could be made in power plants alone lest energy rates increase dramatically
across the nation. According to the ruling, if a state does not develop an effective implementation
plan, the EPA can impose a federal plan (U.S. EPA, 2015).
Due to these regulatory changes, the emergence of solar PV energy is becoming a disruptive
[image:22.612.80.534.208.538.2]force in the EU utility-side grid business model landscape.
Figure 2 Evolution of the Electric Utility Industry Regulatory Environment
I.2 Disruptive Innovations
Disruptive technological innovations disturb the established trajectory of performance
improvement and often destroy the value of existing competencies (Tushman & Anderson,
1986). A major characteristic of disruptive technologies is that they are rarely directly employed 1920 1930 1940 1950 1960 1970 1980 1990 2000 2010 2012 2014
1933: FDR New Deal era regulatory (PUHCA) intervention into the electric industry led to four service providers: 1) Investor-owned utilities 2) Publicly owned utilities 3) Cooperative utilities 4) Federal electric utilities (TVA)
1973: (OPEC oil embargo) - Public Utility Regulatory Policies Act (PURPA), Introduced competition and encouraged efficient use of fossil fuels by allowing non-utility generators to enter the wholesale power market
(cogenerators; and independent power producers (IPPs), which use renewable resources as their primary energy source.
1995: (Bush's Energy Policy Act) Opened access to transmission networks to non-utility generators. EPACT led states which had historically high electricity prices to investigate whether competitive deregulated markets would benefit their consumers. California and Rhode Island passed deregulation legislation, giving the consumer the right to choose his electricity supplier. 1947 to 1973: Annual growth rate
at 8% per year and little change in the industry structure.
2005: (Energy Policy Act) Offers tax benefits to individuals who increase energy efficiency in existing homes, buy or lease hybrid/alternative vehicles. Required all public utilities to offer net metering on request.
2009: (American Recovery and Reinvestment Act): A $800 billion economic stimulus package aimed at job creation and the promotion of investment and consumer spending. Included $4.3b in tax credits to homeowners for energy efficiency improvements in 2009-2010, $21.5b for energy infrastructure, $27.2b for energy efficiency and renewable energy research and investment, etc.
8
in established markets, but instead change the architecture of the market in the medium and long
term (Christensen & Bower, 1996).
The theory of disruptive technological change provides insight into the impact of different
renewable energy technologies for electric utilities:
1) Disruptive technologies generally “create entirely new markets through the introduction
of a new kind of product or service” (Christensen & Overdorf, 2000, p.72).
2) The concept of “architectural” (Henderson & Clark, 1990) or “integrative” (O’Reilly &
Tushman, 2004) innovations recognize the fact that many innovations do not require
breakthrough technology to have major disruptive impacts on markets. These
architectural innovations essentially take core technologies and ideas that already exist
and combine them in new and novel ways to achieve an innovation that is greater than
the proverbial sum of its parts (Henderson & Clark, 1990; O’Reilly & Tushman, 2004).
This author believes that distributed solar energy is both an architectural innovation and a new
market technology based upon the industry reaction to the disruptive impact on the vertically
integrated EU business model. Solar panel architecture (customer-side designs) allows electric
energy to be produced and then used where the consumer load is located reducing the need for
the electric grid and lowering the requirements for large EU resources. It can also be argued that
third-party customer-side solar leasing systems meet the criterion of creating “new markets” as
witnessed by the emergence of numerous companies offering leasing options to homeowners.
Finally, the emergence of new products and services that support these designs also constitute a
9
II LITERATURE REVIEW
Theory elaboration entails the application of new concepts borrowed from other theoretical
perspectives to explain the focal phenomena (Braxton et al., 1997; Thornberry, 1989). This
qualitative research uses theory elaboration to draw on, extend, and organize important ideas
from EU Business Model changes and OA behaviors in response to the challenges introduced by
the emergence of solar PV. The goals of this study are 1) to develop an integrative approach to
assess EU business model changes to understand how IOUs and Co-ops have changed between
2009 and 2014 and 2) to develop a predictive and prescriptive tool that allows EU leaders to
interpret to what extent they have shown ambidextrous behaviors in embracing solar energy and
to determine how they can become more anticipatory, adaptable, and responsive in a shifting
environment.
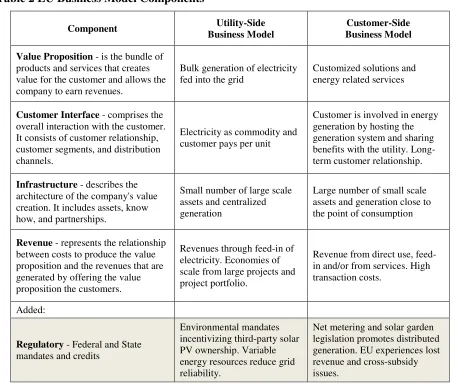
II.1 EU Business Model
Osterwalder and Pigneur (2009: 14) explain a business model as “the rationale of how an
organization creates, delivers, and captures value”. A business model also functions as a valuable
tool for analysis and management in engaged scholarship (Zott & Amit, 2008) and as an
organizational tool to build comprehensive groupings to help understand business phenomena
(Baden-Fuller & Morgan, 2010). As an organizational decision making tool, the business model
concept also helps executives and managers develop techniques to plan, design, construct,
operate, change, and interpret their business (Wirtz et al., 2010). Richter (2011) states that many
definitions of an EU business model encompass four basic elements: the value proposition, the
customer interface, the infrastructure, and the revenue model. Richter’s (2011) EU business
10
(Chesbrough & Rosenbloom, 2002) and to examine, compare, and contrast EU companies in a
structured manner.
The Richter (2011) EU model contains two “sides”: the utility-side and the customer-side, which
are analyzed throughout this study. A utility-side solar array encompasses a large scale project
with capacity between two and a few hundred megawatts. For example, a typical 30 megawatt
solar array requires approximately 200 acres of property and a connection to the transmission
grid for operation. The value to the EU is bulk generation of electricity; electricity is fed into the
grid and delivered to the customer in the traditional manner of coal, gas, and nuclear power
plants. Just as Teece (2010) describes, the utility-side generation business model describes how
EU organizations deliver value to customers and investors at a reduced cost, attracting
consumers to pay for that lower cost value, and then transforming the revenue into a profit or
service.
The second model is the customer-side distributed solar photovoltaics (PV) generation (roof-top)
installation. A roof-top installation is typically attached to a residential or commercial facility
close to the point of consumption. A building can be completely supplied with electricity to the
point that it is “net-metered”. Net-metering (NEM) allows electricity customers who wish to
supply their own electricity from on-site generation to pay only for the net energy they obtain
from the utility. PV systems can at times export excess power to the grid which is then credited
to the consumer’s bill. The possible value of solar PV to the EU would be providing a full
service package that includes financial solar panel leasing and maintenance, energy consulting
11
PV generation has no value chain proposition and therefore have not ventured into this new
market. In this U. S. study, the customer-side renewable energy business model, depicted in
Figure 3, is being explored and accepted as a model which both IOUs and Co-ops have adopted
between 2009 and 2014.
Figure 3 Richter (2011) EU Renewable Energy Business Models
Fundamentally EU business models are changing due to decreases in solar PV cost, increases in
regulatory environment pressure, and changes in customer behavior due to government incentive
programs. Is it possible that the renewable energy issues that impact the EU organization will be
debated and resolved in an EU model regulatory component? For the purpose of this study, the
business model refers to the Richter (2011) renewable energy nomenclature with a fifth business
model component of “regulatory” added by the author because the U.S. the electric utility
industry is regulated at all government levels: federal, state, and municipal. Table 2 provides an
overview of the Richter (2011) Business Model with the added regulatory component.
Generation Transmission Distribution Retail Consumption
Customer-Side Renewable Energy Business
Model Utility-Side
Renewable Energy Business
12 Table 2 EU Business Model Components
Component Utility-Side
Business Model
Customer-Side Business Model
Value Proposition - is the bundle of products and services that creates value for the customer and allows the company to earn revenues.
Bulk generation of electricity fed into the grid
Customized solutions and energy related services
Customer Interface - comprises the overall interaction with the customer. It consists of customer relationship, customer segments, and distribution channels.
Electricity as commodity and customer pays per unit
Customer is involved in energy generation by hosting the generation system and sharing benefits with the utility. Long-term customer relationship.
Infrastructure - describes the architecture of the company's value creation. It includes assets, know how, and partnerships.
Small number of large scale assets and centralized generation
Large number of small scale assets and generation close to the point of consumption
Revenue - represents the relationship between costs to produce the value proposition and the revenues that are generated by offering the value proposition the customers.
Revenues through feed-in of electricity. Economies of scale from large projects and project portfolio.
Revenue from direct use, feed-in and/or from services. High transaction costs.
Added:
Regulatory - Federal and State mandates and credits
Environmental mandates incentivizing third-party solar PV ownership. Variable energy resources reduce grid reliability.
Net metering and solar garden legislation promotes distributed generation. EU experiences lost revenue and cross-subsidy issues.
Solar PV technology has the potential to affect components of the EU Business Model. The
presence of a third-party entity owning a utility-side or customer-side solar system effects the
typical IOU and Co-op business model with opposing interests creating a context in which the
interaction between EU leaders and stakeholders (consumers and policymakers) are important to
recognize (Elsbach, 1994). The business model for an IOU is a guaranteed return-on-investment
(ROI) as established by a state regulatory agency, the PSC. The IOU can recover its cost through
rate increases or exercising fixed cost infrastructure tariffs to keep the investor interests in check.
13
Directors (BOD) is typically comprised of business owners within the Co-op’s service territory
and rate increases are scrutinized by the Co-op’s customers, not a state agency. What is common
between an IOU and a Co-op is that solar PV may erode revenue through its use at the industrial,
commercial, and residential levels.
Although IOUs and Co-ops are both negatively affected by the emergence of solar PV where
revenue is concerned, differences also exist. IOUs and Co-ops often have divergent interests (i.e.
investor-owned vs. customer-owned and regulated vs. unregulated) resulting in customer tension
stemming from conflicts between rural versus urban customer service goals. Moreover, the
relatively small size of Co-ops makes leaders and key stakeholders easily identifiable, whereas
IOUs are typically very large and management heavy insulating the needs of the customer from
business drivers.
To exacerbate the solar PV issue, policymakers have encouraged disruptive competing solar
energy through various subsidy programs such as tax incentives, renewable portfolio standards,
and net-metering, where the pricing structure of utility services allows customers to engage in
the use of new technologies consequently shifting costs and lost revenues to remaining
non-participating customers (EEI, 2013). Thus, the ongoing growth of solar energy will continue to
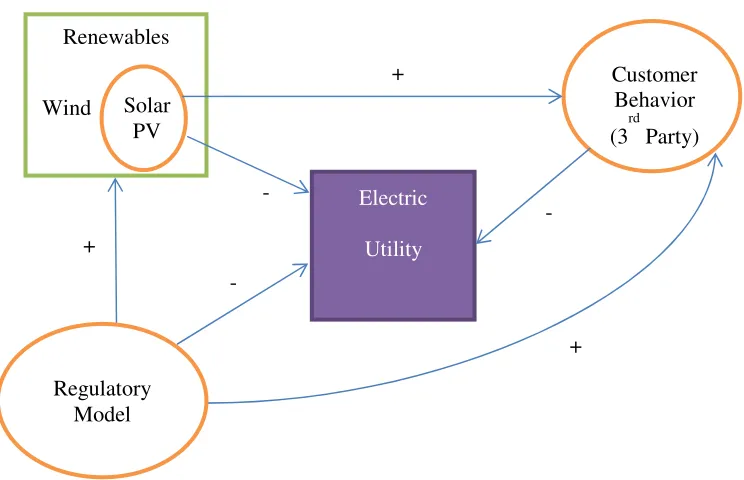
be a disruptive negative force in the EU industry. The potential impact of solar PV on the EU
industry, their customers, and regulatory agencies is shown in Figure 4 and Table 3. As shown,
the negative impact on the EU industry reveals an unclear value proposition for the development
14
organizational ambidexterity in the field of renewable energy.
[image:29.612.110.482.121.361.2]Figure 4 Electric Utility Solar PV Disruptive Model
Table 3 Electric Utility Solar PV Disruptive Character
IOU Co-op
Utility-Side
• EPA (CPP)
• VER ($)
• IOU Guaranteed Cost
Recovery
• Increased Rates
• EPA (CPP)
• VER ($)
• Third-party ownership
• Increased Rates
Customer-Side
Urban America
• Elitist Enterprise
• Regulatory Market
Dependent
• Non-solar Cost-sharing
Rural America
• Less Market
• Regulatory Market
Dependent
• Non-solar Cost-sharing
-
Electric
Utility
Renewables
Wind Solar PV
+
+
+ - -
Regulatory Model
Customer Behavior (3
rd
15
II.2 Organizational Ambidexterity
Organizational ambidexterity (OA) is the ability to pursue two different objectives
simultaneously (Porter, 1980). OA is a mental balancing act for managers of maintaining the
current core business while developing radically new products and services for the future of the
organization (Tushman & O’Reilly, 1996; March, 1991). Organization scientists have adopted
the human trait of ambidexterity (an ability to use both hands with equal skill) as a metaphor to
describe competent organizations. Thus, the theory of organizational ambidexterity suggests that
organizations are successful in the long term when they are able to exploit their existing
capabilities while developing new exploratory competencies (Tushman & O'Reilly, 1996).
Companies tend to divide their attention and resources between exploration and exploitation,
which are seen in the literature as two broad types of qualitatively distinct learning and
knowledge processes (Floyd & Lane, 2000; March, 1991). Exploration implies organizational
behavior characterized by variance-increasing activities including search, discovery,
experimentation, risk-taking and innovation, whereas exploitation is characterized by
variance-decreasing activities including disciplined problem solving, refinement, implementation,
efficiency, production and selection (Cheng & Van de Ven,1996; March,1991). Organizations
look to expand their capacities to successfully confront intensifying paradoxes and effectively
manage contradictory challenges to ensure their viability and competitiveness in an increasingly
turbulent environment in which multiple and inconsistent contextual demands can emerge (Smith
& Tushman, 2005; Tushman & O'Reilly, 1996). The management of these organizational
16
organization viable and enabling it to adapt and survive in the face of environmental
disturbances.
Birkinshaw and Gibson (2004) distinguish between two forms of organizational ambidexterity -
structural ambidexterity and contextual ambidexterity. Researchers have determined that
structural ambidexterity (Tushman & O'Reilly, 1996) and contextual ambidexterity (Gibson &
Birkinshaw, 2004) are important for the growth of the ambidextrous organization.
Structural ambidexterity is the structural separation and coordination of entities into those
focused on exploration and those focused on exploitation, often with different performance
metrics where it involves splitting into different organizational units (Tushman & O’Reilly,
1996). Splitting into different organizational units is one structural ambidexterity process that
copes with the dilemma of balancing exploration and exploitation. O'Reilly and Tushman (2004)
examined several different structural responses to disruptive change and determined that
separating the organization responsible for dealing with a disruptive change from the existing
business with coordination at the senior executive level is the organizational template most
closely associated with structural ambidexterity. The second structural ambidexterity process that
some organizations use is focused on the organizational characteristics and competencies
required to sense new opportunities and threats, seize upon them, and then reconfigure the
organization to take advantage of the opportunities or counter the threats (O'Reilly & Tushman,
2004). The theoretical framing describes the three key capabilities in the structural ambidexterity
17
Contextual ambidexterity is the ability for individuals within the organization to balance the
needs for alignment and adaptability (Gibson & Birkinshaw, 2004) where it involves creating an
organizational context and responding to the organizational stimuli that inspire, guide, and
reward people to act in a certain way (Ghoshal & Bartlett, 1997). Contextual ambidexterity
allows exploitation and exploration behaviors to grow, exist, and emerge in the same
organizational unit. Gibson and Birkinshaw (2004) have shown that the four established
characteristics of organizational context, as described by Ghoshal & Bartlett (1994), namely
discipline, stretch, support, and trust, are good indicators of contextual ambidexterity (Gibson &
Birkinshaw, 2004). In addition to these four organizational characteristics, Birkinshaw and
Gibson (2004) also identified four individual behaviors associated with contextual ambidexterity
(Birkinshaw & Gibson, 2004, p. 49) which are initiative, cooperation, communication, and
multitasking.
Birkinshaw and Gibson (2004) explain that contextual ambidexterity is the collective orientation
of the employees toward the simultaneous pursuit of alignment and adaptability. The key to
contextual ambidexterity is empowering employees to make day-to-day decisions on how to
balance exploration and exploitation, rather than having those decisions come from senior
management. To do so, it is necessary for senior management to create an organizational context
that provides support for individual employee decision-making roles and more generalist
positions (Birkinshaw & Gibson, 2004).
Specifically for this study, questions remain concerning the drivers for determining the EU
18
study seeks to understand EU organizational solar PV issues that give rise to paradoxes and
concessions to enhance long-term competitiveness (Gibson & Birkinshaw, 2004).
The two research questions to be addressed in this study are: 1) How have EUs responded to a
shift in their environment from 2009 - 2014 due to a disruptive solar technology?
Another expectation is to determine to what extent IOUs and Co-ops have shown ambidextrous
behaviors during this time period. Also, an investor-owned utility (IOU) may have a different
strategy of how to structure its business model compared to an electric cooperative (Co-op)
because the IOU serves primarily urban customers and the Co-op serves rural customers. This
potential difference leads to the second research question: 2) What are the discernable business
model patterns and OA behaviors that differ between investor-owned (urban) and electric
cooperative (rural) EUs in response to a disruptive solar technology?
II.3 Sensemaking
To examine the EU business model changes through a problem-solving process, the framework
of this study begins with a critical organizational activity - “sensemaking” (Weick, 1995).
According to Weick, Sutcliffe, and Obstfeld, (2005) sensemaking is a way of creating a shared
understanding that is plausible enough for a group to move toward action. Industry leaders use
sensemaking activities such as environmental scanning and issue interpretation to determine the
impact and control mechanisms necessary for organizational decisions and strategic change
(Gioia & Thomas, 1996). Other stakeholders such as consumers and legislators use sensemaking
19
Many EUs have established a resource planning process for their environmental and economic
sensemaking awareness. For example, a rolling three year integrated resource scenario planning
(IRP) process is being used by Georgia Power Company (GPC) to help it be more responsive
(ambidextrous) to the changing environment, as stated by an executive during a recent interview
(Roberts, personal communication, October 29, 2014). A study of the social processes of
sensemaking (Teece, 2007, 2010) suggests that with the advent of a disruptive technology,
integrated resource scenario planning (IRP) is a critical tool for fostering organizational
ambidexterity (OA) behaviors. An example of an IRP process (TVA IRP, 2010):
1. Identify Public Issues and Relevant Concerns
o Accumulate relevant issues and concerns from customers, employees, environmental
groups, and other key stakeholders.
2. Translate Public Issues and Concerns into Evaluation Criteria and Resource
Options
o Develop statements that reflect EU and stakeholder values to translate into an
evaluation criteria. For example, impacts on rates, environment, and fuel prices are
considerations in evaluating various future resource strategies.
3. Identify Possible Future Conditions (Uncertainties)
o Concerns and uncertainties are translated into future conditions. For example, high
growth in electricity sales, high cost of natural gas, and increasing air emission
20
4. Construct Scenarios
o Scenarios are created and discussed in terms of its relevant attributes and objectives.
Scenarios are then evaluated using modeling and simulation techniques to measure
their performance against the evaluation criteria.
5. Use Trade-Off Analysis to Find the Best Strategies for the Future
o Once a set of feasible scenarios are developed, trade-offs are considered under the
different future conditions. Discussions on trade-offs within the EU and stakeholders
focus on how well various strategies might be able to meet selected evaluation criteria.
Past studies (Maitlis, 2005; Carmeli & Halevi, 2009) have examined the critical roles played by
leaders and stakeholders in the social processes of sensemaking. Maitlis’s (2005) four forms of
the social processes of organizational sensemaking can help to identify the degree to which
leaders and stakeholders engage in “sensegiving”. Maitlis (2005) said that sensegiving is the
attempt to influence others’ understanding of an issue. Maitlis states,
“Each of the four forms of organizational sensemaking guided, fragmented, restricted, and minimal is associated with a distinct set of process characteristics that capture the dominant pattern of interaction. They also each result in particular outcomes,
specifically, the nature of the accounts and actions generated” (p.21).
For this study Maitlis’s (2005) four distinct forms of the social processes of organizational
sensemaking guided, fragmented, restricted, and minimal were used for two purposes. First,
there was a need to organize the business model changes into the dominant patterns of
interaction between the EU leader and the stakeholder (consumer, policymaker). These
interactions or aggregate observable responses to internal (EU leaders) and external
21
(stimuli) and grouped into Maitlis’s four distinct forms. Second, the four behavioral groups were
placed into Maitlis’s (2005) 2x2 framework (Figure 5) and overlaid onto the Cameron (2006)
Competing Values Leadership Framework (CVF) framework described in the next section.
Guided Sensemaking
Process Characteristics
• High Impact • High Control
Outcome
• Collaborative
Fragmented Sensemaking
Process Characteristics
• High Impact • Low Control
Outcome
• Create
H ig h S en se g iv in g S ta k eh o ld er I m p ac t Restricted Sensemaking Process Characteristics
• Low Impact • High Control
Outcome
• Control
Minimal Sensemaking
Process Characteristics
• Low Impact • Low Control
Outcome
• Compete
L o w S en se g iv in g
High Sensegiving Low Sensegiving
EU Leader Control
Figure 5 Four Forms of Organizational Sensemaking
II.4 Competing Values Framework
Competing Values Leadership Framework (CVF) highlights the trade-offs, inherent tensions,
contradictions, and paradoxes that face organizations and their leaders as they navigate complex
and changing environments (Cameron, 2006). The basic framework is comprised of two
dimensions that express the tensions or competing values that characterize all organizations. The
center horizontal axis separates the continuum between flexibility, adaptability, and exploration
and the continuum of control, alignment, and exploitation (as shown in Figure 6). The center
22
external positioning and opportunities related to stakeholders such as competitors, customers and
investors. Each continuum highlights dichotomous performance criteria such as internal versus
external orientation (horizontal axis) or flexibility versus control (vertical axis). Each quadrant
has been labeled to describe its most notable characteristic. The CVF defines each quadrant:
Collaborate (upper left), referring to team, group, fellowship among collaborators; Create (upper
right), referring to the ability of people to collaborate in new, creative, and innovative ways;
Compete (lower right), the ability to focus on results, attainment, and attention to the competitive
landscape and external positioning; and Control (lower left), the ability to create, operate, and
maintain structures and systems that support organizational control and learning (Cameron &
Quinn, 2006, 2011). The two upper quadrants share an emphasis on energy and flexibility. The
two bottom quadrants emphasize control and stability. The two left-hand quadrants are both
focused on internal capabilities whereas the two right-hand quadrants are externally focused.
Contradictory elements are found through comparison of the diagonally, or diametrically,
opposite quadrants (Figure 6).
23
Flexibility and Energy
Internal
COLLABORATE
• team, group, fellowship
among collaborators
CREATE
• ability of people to
collaborate in new, creative, and innovative ways
External
CONTROL
• create, operate and maintain structures and systems that support organizational control and learning
COMPETE
• focus on results,
attainment and attention to the competitive landscape and external positioning
Control and Stability
24
III STUDY DESIGN
This study uses a multiple case design (Lee, 1999; Yin, 2007) in which EU business model
components are traced retrospectively beginning in 2009 through 2014. CEO annual reports,
regulatory maps, and integrated resource plans are collected for each of the EUs interviewed.
Interviews of key executives / managers from 11 electric utilities in 4 of the 10 states ranked
highest in 2013 annual PV capacity additions of solar energy in the U.S. were conducted (Figure
7). The fifth state, Vermont, one of the most progressive distributive customer-side business
model solar states in the nation, was also recommended in a pilot interview with the National
Rural Electric Cooperative representative from Washington D.C. Four pilot interviews were
completed with EU executives and managers and one additional interview with a SolarCity
executive. SolarCity is America's largest third-party solar power provider. Table 4 shows EUs
interviewed by region, name, state, territory served, type, and interviewee title.
Qualitative methods are well suited to the study of dynamic processes, especially where these
processes are composed of individuals’ interpretations (Gioia & Thomas, 1996; Hinings, 1997).
Qualitative research typically examines issues from the perspective of the participant and is
frequently used in the study of organization members’ constructions and accounts (Dutton &
Dukerich, 1991; Isabella, 1990). This study uses an explorative qualitative research strategy to
address the two research questions. The retrospective approach will be used in order to gain an
in-depth understanding of how EU business models have changed since the beginning of the
American Recovery and Investment Act of 2009 through 2014 (see Timeline Figure 2).
Selection of interview candidates (Figure 7) involved a multi-step process. A recruitment script
25
reply was not received within two weeks, a phone call was made to the prospective executive or
manager. If they agreed to an interview, an informed consent form was e-mailed to the
interviewee for signature. On occasion, the interviewee recommended a key executive or
manager to contact. Those references proved to be very valuable in Vermont, Colorado, and the
Carolinas.
The states that were selected aligned across four regions of the U. S. (Southeast, Northeast,
Midwest, and Pacific). Each EU region has specific solar PV characteristics and inclinations that
are likely to be factors in how an EU responds. The location may impact the direction of the
issues and EU controls used to implement solar resources into their generation mix. For example,
the Southeast region has some of the lowest electrical consumer rates in the country and some of
the oldest and most established electric utilities.
The Northeast region has higher electricity rates than the Southeast and their natural gas supply
is limited due to confined pipeline access resulting in higher electric heating costs. The EU
industry regards this region as highly progressive with new technology; there is a need to
understand the EU impact and control mechanisms that are being proposed to reduce fuel costs.
The Midwest has an influx of renewables associated with the wind belt and highly stringent
renewable portfolio standards enacted by the states. Finally, the Pacific region (specifically
Hawaii) presents national renewable leadership in solar installations and the highest electric rates
in the United States. In addition, four pilot interviews were completed to confirm that the
SolarCity interview was done to understand the solar emergence from an EU
third-party business model competitor’s perspective. The interview protocol
designed to match each of Richter’s (2001) business model
is intensive, fifty percent of the interviews were
percent were conducted by telephone.
Figure
26
done to understand the solar emergence from an EU customer
competitor’s perspective. The interview protocol (Appendix A
designed to match each of Richter’s (2001) business model components. Because data collection
is intensive, fifty percent of the interviews were conducted face-to-face and the other fifty
by telephone.
Figure 7 2013 Solar State Rankings
SOLAR ENERGY
FACTS: 2013 YEAR
IN REVIEW
Solar Energy
customer-side
Appendix A) is
Because data collection
27 Table 4 Summary of Interview Data Sources
The similarity of the 11 electric utilities (4 investor-owned and 7 electric cooperatives) allows for
meaningful stratified comparisons across the EU industry leaders and the stakeholders involved,
while the diversity and the differences between the EUs provide a reasonable basis for
Region Interviews & CEO Reports State Service Territory Investor-Owned
Utility Cooperative Title
Pacific Kaua'i Island Utilities
Cooperative Hawaii Kaua'i x Power Supply Manager
Pacific Hawaiian Electric Hawaii Oahu, Maui, Hawaii
Island, Lanai and Molokai x Communication Specialist
Midwest Tri-States Generation &
Transmission Association Colorado
Colorado, Nebraska, New
Mexico and Wyoming x
Sr. Manager of Government Relations
Midwest Sangre de Cristo Electric
Association Colorado Colorado x Energy Use Advisor
Northeast Vermont Electric Cooperative Vermont Vermont x CEO
Northeast Green Mountain Power Vermont Vermont x Director of Government
Affairs
Southeast Georgia Power Company Georgia Georgia x Vice President of Pricing
and Planning
Southeast Georgia Power Company Georgia Georgia x Green Energy Program
Manager
Southeast Georgia Electric Membership
Corporation Georgia Georgia x
Vice President of Government Relations
Southeast Electric Cooperatives of
South Carolina
South
Carolina South Carolina x
Vice President for Government Affairs
Southeast Duke Energy South
Carolina
South Carolina, North Carolina, Florida, Indiana, Ohio, Kentucky
x Manager of Renewable
Strategy
Southeast Santee Cooper South
Carolina South Carolina State-owned
Sr. Vice President of Customer Service
Pilot Interviews
Southeast Georgia Transmission Corporation Georgia Georgia x Sr. Vice President of
Transmission Policy
Southeast Georgia Transmission Corporation Georgia Georgia x Vice President of
Transmission Planning
National Rural Electric
Cooperative Association United States United States x
Assistant Director of Regulatory Counsel
Pacific Anza Electric Cooperative California Southern California x General Manager
Pacific SolarCity Hawaii
AZ, CA, CO, CT, DE, HI, MA, MD, NJ, NV, NY, OR, PA, TX, WA, and DC
28
generalizability. The retrospective approach is used in order to gain an in-depth understanding of
how EUs business models are changing and becoming more ambidextrous in response to solar
PV.
The unit of analysis is the organizational level. The interviews are self-reports by senior
managers of what their respective organizations have done and are doing, of prevailing attitudes
towards solar PV and of their assessment of how well they are doing. Interviews are transcribed
and then coded with the aid of NVivo and Leximancer software; secondary data is coded with
Leximancer software. Both software programs are content analysis tools, however NVivo
requires the researcher to define the coding scheme whereas Leximancer generates its own
schema using word counts, word clustering, and proximity. Leximancer is also a text analytics
tool that can be used to analyze the content of collections of textual documents and to display the
extracted information visually.
The Leximancer information is displayed by means of a conceptual map that provides a
bird’s-eye view of the material, representing the main concepts contained within the text as well as
information about how concepts are related. The conceptual map allows the user to view the
conceptual structure of a body of text, as well as perform a directed search of the documents. The
interactive nature of the map permits the user to explore examples of concepts, their connections
to each other, as well as links to the original text. Leximancer provides both a means of
quantifying and displaying the conceptual structure of text and a means of using this information
to explore interesting conceptual features. The 2009 and 2013 CEO reports and the IRP data
29
Another secondary source of data is the regulatory map for each state which is compiled using
the Database of State Incentives for Renewables & Efficiency (Solar, D. S. I. R. E. 2012) which
is funded by the U.S. Department of Energy. DSIRE was established in 1995 and is currently
operated by the N.C. Solar Center at N.C. State University with support from the Interstate
Renewable Energy Council, Inc. The map includes state mandated renewable portfolio standards
or renewable state goals (Figure 8). A renewable portfolio standard (RPS) has been established
in 29 states plus the District of Columbia and Puerto Rico. States shown in red have an RPS
whereas states in orange have a renewable state goal. For example, Hawaii has a state mandated
standard that a percentage of their load (40% by 2020) must be served by renewable resources or
they will be penalized. Colorado, also in red, has a state renewable mandate that requires that
30% of the IOUs load and 10% (recently changed to 20%) of the Co-ops load must be served by
renewable resources by 2020. Typically, monetary penalties are enacted when RPS (red)
standards are not met whereas RPS (orange) goals are typically tied to warnings to comply or
30
Figure 8 State Renewable Portfolio Standards
Interviews, CEO reports, and the regulatory map for each state are analyzed using Richter’s
business model components from both a utility-side and customer-side perspective (Table 2).
The EU utility-side responses are expected to be more robust and complete because of their
substantial experience resulting in more and larger projects. In addition, it might be expected that
the Co-ops are lagging behind the IOUs in their response to disruptive technology and changing
environment, perhaps due to a lack of resources to manage the work.
III.1 Data Analysis
The data analysis is comprised of three stages. Stage 1 is comprised of several steps of data
31
using the interview protocol responses associated with the four Richter (2011) business model
components with the additional fifth regulatory component. The four IOU and seven Co-op
narratives under study are then summarized into a 2x5 matrix for each EU. The matrix uses the
characteristics of impact (stakeholder driven) and control (EU leader response) on one axis and
the five EU business model components on the other. These characteristics help to interpret the
business model behaviors and strategies associated with the stakeholder (consumers and
policymaker) and EU leader interactions (Maitlis, 2005). Next, the Leximancer conceptual maps
are developed from the interview and secondary data for longitudinal EU leader business model
comparisons. Finally, a Competing Values Framework (CVF) is created for each EU to interpret
ambidextrous behaviors. In the second stage, the first research question is addressed: 1) How
have EUs responded to a shift in their environment from 2009 - 2014 due to a disruptive solar
technology?
In the third stage, the second research question is addressed: 2) What are the discernable
business model patterns and OA behaviors that differ between investor-owned (urban) and
electric cooperative (rural) EUs in response to a disruptive solar technology?
32 16 Interviews and
CEO/IRP Secondary Data
Solar “Impact” and “Control” characteristics organized to Richter (2011) EU Business Model
Components including Regulatory
EU leader and stakeholder
interactions are analyzed to identify sensemaking type.
Integrate Cameron (2006) Competing Values Leadership Framework (CVF)
CVF for each EU to help understand and interpret their ambidextrous behaviors associated with the 2009-2014 EU business model changes
Pilot Interviews
Stage 1: Code the narratives and merge with secondary data.
Stage 2: Combine EU leader business model issues into a 2x5 matrix to identify a set of solar PV issues that are comparable across business model components.
Stage 3: Analyze business model data and behaviors to determine sensemaking type (guided, fragmented, restricted, and minimal).
Stage 4: Integrate sense-making type with CVF to interpret responses of the participants to determine the extent to which they exhibit ambidextrous behaviors
Stage 5: Identify the comparisons and contrasting patterns between IOUs & Co-ops
33
III.1.1 Stage 1 - Code the narratives describing the EU business model process
The initial data analysis stage begins with coding both the primary interviews and secondary data
sources using solar PV EU business model issues (Eisenhardt & Bourgeois, 1988). The primary
data source is comprised of the 16 EU interviews using an instrument protocol derived from
Richter’s (2011) four EU business model components and the additional regulatory component.
The secondary data source is comprised of the EU 2009 and 2013 CEO annual reports, EU IRP
documents, and the state regulatory maps from the same 11 EUs. These are processed using
Leximancer to allow automatic coding of organizational issues. The solar PV issues that are
identified in the interviews, annual reports, and IRP documents that involve a concern are
mapped to one of Richter’s EU business model components. A typical issue must meet two
criteria for inclusion. The first criterion is that an issue must be mentioned in all EUs, in all
IOUs, or in all Co-ops. Meeting this criterion requires a process of data reduction (Strauss &
Corbin, 1998) in which the solar issues are divided into subset characteristics within the business
model components. The second criterion for inclusion is that data should be available from both
the interviews and annual reports or IRP documents. The expectation is to have at least two
subset issue characteristics within each Richter EU business model component: (1) Value
Proposition: utility-side (grid reliability) and customer-side (energy conservation); (2) Customer
Interface: utility-side (competition) and customer-side (distributed energy involvement); (3)
Infrastructure: utility-side (centralized generation) and customer-side (net-metering or
community solar); and (4) Revenue: utility-side (ownership) and customer-side (cross-subsidies).
A fifth business model component is added to include Regulatory: utility-side (EPA carbon) and