Computational Heterogeneous
Electrochemistry – From
Quantum Mechanics to Machine
Learning
Thesis by
Yufeng Huang
In Partial Fulfillment of the Requirements for the degree of
Chemical Engineering
CALIFORNIA INSTITUTE OF TECHNOLOGY Pasadena, California
2019
2018
Yufeng Huang
ACKNOWLEDGEMENTS
First, I would like to thank my PhD advisor, Prof. William A. Goddard III, for all the guidance and insight throughout my graduate years at Caltech. Bill is probably the most knowledgeable and most insightful scientist I can think of. The depth and breadth of the sciences being done by Bill and the Goddard group still amaze me to this day. I truly appreciate the opportunity to learn not just about sciences, but also the historical contexts of these sciences from Bill. When I started my graduate school, I set out to learn about the microscopic world, from quantum mechanics to chemistry to molecular dynamics to mesoscale observables. I am fortunate to practice research in such a wide range of domains with Bill’s insights.
Next, I want to thank my thesis committee, Prof. Zhen-Gang Wang, Prof. Tom Miller, and Prof. Mark Davis for the exceptional teaching of the fundamental concepts in chemical engineering. The rigorous course works in thermodynamics, statistical mechanics, and reaction engineering form the basis of my approaches to understanding and solving heterogeneous catalytic problems in my research.
I would also like to thank Dr. Robert Nielsen (Smith!) and Dr. Tao Cheng for the all the advice and suggestions in many of the projects we worked on together. I still remember the early days of my PhD when Smith patiently taught me the nuts and bolts of quantum chemistry. Both Smith and Tao are extremely resourceful, and are truly the ones I could rely on whenever I encountered difficulties in research.
I also want to thank Dr. Lin-Wang Wang for hosting my short visit at the Lawrence
Berkeley National Laboratory (LBL). Dr. Wang is an exceptionally insightful physicist and an amazing software architect. During the few months at LBL, I was lucky to work on Dr. Wang’s new energy partitioning method and to implement machine learning approaches to
with whom we have worked closely. I want to thank Prof. Linyou Cao and Dr. Guoqing Li from North Carolina State University for working with us since the early years of my PhD. I also want to thank Prof. Haiqing Zhou and Prof. Zhifeng Ren at the University of
Houston to engineer and understand some of the highest performing catalysts for hydrogen evolution reactions.
I would also like to thank the heterogeneous catalysis group (Hetcat) led by Prof. Manuel Soriaga (Manny) at the Joint Center for Artificial Photosynthesis (JCAP) on campus. During the early years, I was fortunate to be invited to many of the Hetcat discussions, which helped me enormously in understanding the experimental side of electrochemistry and surface science. Manny is friendly and welcomes discussions. In fact, most of my PhD work is motivated by the discussions with Manny during many of my random afternoon visits to his office. I also want to thank the other Hetcat members for sharing research ideas and discussions: Dr. Youn-Geun Kim, Dr. Alnald Javier, Dr. Jack Baricuatro, Dr. Kyle Cummins, and Dr. Chu Tang.
I also want to thank other JCAP experimentalists with whom I have collaborated: Dr. Jimmy Jones, Prof. Jesus Velazquez (now at the University of California Davis), Dr. Joshua Wiensche, and Dr. Yi-Rung Lin.
become my most favorite sports since. My PhD would not be as well-rounded without having Sam as a great friend who I could discuss everything with. I also want to thank Jason for sharing many of the happy moments in the office. Jason has really sharp insights about everything that always allowed me to learn to look at things in new ways from our discussions. In addition, Jason’s passion for cycling has really motivated me to become a better cyclist. Lastly, I want to thank Sijia for all the discussions about many subjects, many people, and many areas of science.
I would also like to thank my recent 07 officemates and also friends, Jin Qian, Yalu Chen, Dr. Soonho Kwon, and Dr. Hyeyoung Shin. We have shared many lunches, dinners, and office trips together. I want to thank Jin for sharing and exploring many research ideas from our respective catalysis projects. I want to thank Yalu for working and improving our new machine learning research direction, for being a cheerful cycling and running buddy, and for being a good friend to share many stories in our lives. I want to thank Soonho for the many activities and trips outside of the office. I want to thank Hyeyoung for enduring my endless conversations, for practicing badminton together, and traveling to many places.
I want to thank the other WAG members, including Dr. Caitlin Scott, Dr. Daniel Brooks, Dr. Saber naserifar, Prof. Qi An, Prof. Yuanyue Liu, and Prof. Ravishankar Sundararaman.
Moreover, I want to thank many friends and classmates for sharing my PhD experience: Dr. Kevin Shen, Dr. Kevin Fiedler, Dr. Kevin Barkett, Dr. Kevin Marshall, Dr. Mark Harfouche, Dr. Travis Schlappi, Dr. Jacob Hedelius, Dr. Karthik Ramachandran, Dr. Cristofer Flowers, Dr. Cheng Li, Dr. Hao Chu, Dr. Jin Yang, Weiyi Chen (USC), and Shengan Zhan (UCLA).
I would also want to take the chance to thank my college research advisor, Prof. Marc-Olivier Coppens, now at University College London, for motivating me to become a scientist. In the early days of my college study, Prof. Coppens’s enthusiasm and passion
ABSTRACT
Because of coulomb interactions and complex surface morphologies, rigorous methods for heterogeneous electrochemical catalysis were not well-established. Thus, for different types of electrochemical systems, a specific strategy must be adapted. In this thesis, we first used the cluster model to study the chemistry on a 1D chain of MoS2 edges. Then, a rigorous grand canonical potential kinetics (GCP-K) method was developed for general crystalline systems. Starting from quantum mechanical calculations, the method gave rise to a
different picture from the traditional description given by the Butler-Volmer kinetics. Next, we studied the chemical selectivity of CO2 reduction on polycrystalline copper
nanoparticles. Because of the complexity of the reaction sites, we combined the reactive force field, density functional theory, and machine learning method to predict the reactive sites on 20,000 sites on a roughly 200,000-atom nanoparticle. Such a strategy opens up new way to understand chemistries on a much wider range of complex structures that were impossible to study theoretically. Lastly, we formulated a machine learning force field strategy using atomic energies for amorphous systems. We have shown that such a method can be used to reproduce quantum mechanical accuracies for molecular dynamics. This method will enable the accurate study of the dynamics of heterogeneous systems during electrochemical reactions. In summary, we have developed quantum chemical methods and machine learning strategies to reformulate rigorous ways to study a wide range of
heterogeneous electrochemical catalysts.
Huang Y. performed the calculations, analyzed the results, prepared the data, and wrote the manuscript.
Chapter III : Huang, Y. ; Nielsen, R. J. ; Goddard, W. A. III. (2018). “Reaction
mechanism for the hydrogen evolution reaction on the basal plane sulfur vacancy site of MoS2 using grand canonical potential kinetics”. In: J. Am. Chem. Soc. 140, 48, 16773-16782. doi: 10.1021/jacs.8b10016.
Adapted with permission from J. Am. Chem. Soc. 2018, 140, 48, 16773-16782. Copyright 2018 American Chemical Society.
Huang Y. came up with the theory, performed the calculations, analyzed the results, prepared the data, and wrote the manuscript.
Chapter IV: Huang, Y. ; Chen, Y.; Cheng, T. ; Wang, L.-W. ; Goddard, W. A. III. (2018). “Identificaiton of the selective sites for electrochemical reduction of CO to C2+ products on copper nanoparticles by combining reactive force field, density functional theory, and machine learning”. In: ACS Energy Letters. 3, 2983-2988. doi:
10.1021/acsenergylett.8b01933.
Adapted with permission from ACS Energy Lett. 2018, 3, 12, 2983-2988. Copyright 2018 American Chemical Society.
Huang Y. came up with the concept, implemented the machine learning algorithm, analyzed the results, and wrote the manuscript.
Chapter V: Huang, Y. ;Kang, J.; Goddard, W. A. III ; Wang, L.-W. (2019). “DFT based neural network force field from energy decompositions”. In: Phys. Rev. B 99, 064103. doi: 10.1103/PhysRevB.99.064103
Reprinted with permission from Phys. Rev. B. 2019, 140, 48, 16773-16782. Copyright 2019 by the American Physical Society.
TABLE OF CONTENTS
Acknowledgements………...iii
Abstract ………vii
Published Content and Contributions………...viii
Table of Contents………. ix
Chapter I: Introduction ... 1
1. Background... 1
2. Quantum chemical approaches ... 2
3. Overview of the thesis ... 4
References ... 8
Chapter II: The Reaction Mechanism with Free Energy Barriers for Electrochemical Dihydrogen Evolution on MoS2 ... 13
1. Introduction ... 14
2. Computational methods ... 15
3. Model systems ... 17
4. Results and discussions ... 20
5. Conclusion ... 28
References ... 29
Supporting information ... 33
Chapter III: The Reaction Mechanism for the Hydrogen Evolution Reaction on the Basal Plane Sulfur Vacancy Site of MoS2 Using Grand Canonical Potential Kinetics ... 34
1. Introduction ... 35
2. The grand canonical potential (GCP) formulation using the constant charge condition ... 38
3. Simulation Model for the basal plane of MoS2 ... 41
4. Relationship between grand canonical potential reaction kinetics and Butler-Volmer reaction kinetics ... 42
5. Discussion of the HER mechanism on MoS2 basal plane ... 48
6. Overall kinetics ... 52
7. Comparison with other Group VI transition metal dichalcogenides ... 55
8. Conclusion ... 58
References ... 58
Chapter V: DFT based Neural Network Force Fields from Energy
Decompositions ... 90
1. Introduction ... 90
2. Methods ... 93
3. Results and discussion ... 102
4. Conclusion ... 110
References ... 110
C h a p t e r 1
INTRODUCTION
1. Background
Energy is essential for human activities. The ability to control and generate energy contributes to the development of sophisticated human society1-2. As the average quality of
life is improving throughout the world and the total population is on the rise, the demand for energy is projected to increase accordingly3-5. Since the industrial revolution, fossil fuels
including coal, petroleum, and natural gases have been used to generate energy1,6. These
sources were the result of natural photosynthesis over millions of years7-8. Without adequate
replenishment, the ever-increasing usage of limited natural resources is unsustainable. Therefore, to meet energy needs in the long term, energy must be harvested directly from much larger energy sources9. Thermal10, biological11 and photoelectrochemical12 approaches
have been suggested and employed to harvest solar energy. In additional to harvesting energy directly from the sun, other renewable sources like hydropower, geothermal power, and wind power can be exploited13. Because all of these processes generate electricity, developing
efficient electrochemical processes to store the renewable energy in chemical forms is universally applicable and can be easily integrated into these systems.
The application of electrochemistry in energy includes batteries14, fuel cells15,
supercapactors16, and electrochemical chemical productions17. Because of the abundance of
H2O and CO2 on Earth, they are promising for large-scale energy conversion into chemical fuels in the form of H218 or carbon based fuels19. To perform efficient chemical transformations, catalysts are used to lower the energies of the reaction intermediates and reaction barriers.
them easy to handle and suitable for large-scale industrial applications. In addition, heterogeneous catalysts can be assembled in different scales for further optimization23.
However, because catalytic sites on heterogeneous catalysts cannot be isolated for chemical analysis, surface science techniques are generally used to study these catalytic sites24. Due to
the limitations of current experimental techniques in determining the active sites and reaction intermediates during the reactions, theoretical insights are necessary to understand the underlying electrochemical processes.
2. Quantum Chemical Approach
Chemical properties are governed by the Schrodinger equation. Because the motions of electrons follow the Schrodinger equation, the solution of this equation describes bond-breaking and formation in molecules. However, an exact solution to the Schrodinger equation is computationally prohibitive for large systems, because for N electrons in 2K one-electron spin orbitals, there are (2K)!/(2K-N)!N! slater determinants in the full configuration interaction solution25-26. Thus, for most systems, the Schrodinger equation can only be solved
approximately27-28. The Hartree-Fock method is the simplest approximation to the
Schrodinger equation based on the mean field theory. In this approach, electrons interact with each other via any average potential such that the overall wave function is the anti-symmetrized product of the orthogonalized eigenstates. To obtain chemical accuracies, post-Hartree Fock methods can be employed.
the total electronic density. In the original formulation, Hohenberg and Kohn established the uniqueness of the ground state electron density in the presence of external potentials29.
One of the simplest form of such orbital free DFT approach is the Thomas-Fermi functional based on the Fermi gas of metallic systems30. However, such an approximation still performs
poorly for general systems. An important breakthrough was made by Kohn and Sham, who re-formulated the mathematical proof using electronic orbitals rather than electronic densities31. Practical functionals including the local density approximation (LDA), PBE32,
and B3LYP33 functionals have been used to study a wide range of chemical systems.
The application of quantum mechanical calculations to catalysis typically involves calculating the relative energies of reaction intermediates and the transition states between these intermediates. Because a catalyst will be regenerated after each reaction, the overall catalytic process consists of a catalytic cycle, in which the catalyst interacts with the reactants, performs catalytic transformation, and then releases the products to regenerate itself for the next cycle.
For reactions in solution, temperatures and pressures are typically held constant. Thus, the appropriate thermodynamic potential is the Gibbs free energy34:
G = U – TS + pV = E + ZPE + Hvib– TSvib + Gsolv
Where E is the electronic energy calculated from the Schrodinger equation, ZPE is the quantum mechanical zero point energy, Hvib and Svib are thermodynamic contributions due to the vibrational modes, and Gsolv is the solvation energy35.
problem by including counterions from solutions to neutralize the net charge on the periodic reactive surface38-43.
3. Overview of the thesis
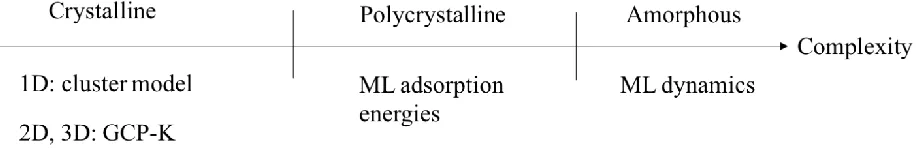
In electrochemistry, electrolytes are needed to transport charges between the cathode and the anode for conducting electricity. Since electrolytes are mobile ions in solution, heterogeneous catalysts in electrochemistry are typically in the solid phase. Solid catalysts can take many different forms, including perfect crystals, polycrystalline films or particles, and amorphous structures, with increasing complexity. Because chemical reactions take place at the interface between the heterogeneous catalysts and the reactants in the solution, the surface morphology directly determines the interfacial chemistry. However, because the complexities of the surface morphology differ in different categories of materials, the study of each type of catalysts require specific treatments. In this thesis, we employed quantum mechanical methods to study the three main categories of catalysts, as shown in Figure 1 below:
[image:14.612.111.569.548.625.2]First, quantum mechanical calculation is applied to study the simple low-index surface of crystalline materials. For extended systems, usually the periodic boundary condition is used, such that compounds in the forms of chains, slabs, or bulks are described by their dimensions as 1D, 2D, and 3D systems. The cluster model is first used on the 1-dimensional edge of crystalline MoS2. In the calculation, the catalytic region of the linear edge is extracted to form a cluster by including a sufficient number of nearby atoms. Since the catalytic site is isolated from the extended system as a cluster, it can be treated as a homogeneous catalyst such that well-established molecular calculations can be used on this cluster model to study the catalysis. Using this method, we placed net charges on the catalyst as we did for the homogeneous catalysts. We found that the hydrogen evolution reaction takes place via the Heyrovsky mechanism involving a molybdenum hydride and a solvated hydronium water cluster. This work is summarized in Chapter 2 of the thesis.
Although the cluster model is useful for 1D systems, for higher dimensions, a cluster will contain a large number of atoms, making the method less effective. Thus, a different strategy is needed for more general and higher dimensional systems.
To study the surface sites on polycrystalline systems, we combined the reactive force field (ReaxFF), quantum chemical calculations, and machine learning approaches. An important example of such systems is the copper nanoparticles on which the electrochemical CO2 reduction is driven favorably towards C2+ products. The first difficulty in studying polycrystalline systems is to computationally generate a realistic particle for study. Here, the ReaxFF is specifically trained to match the dynamics of copper to simulate a realistic particle. With this nanoparticle, we can sample the surface sites for interactions with reaction intermediates using the cluster model. However, for a nanoparticle with 200,000 atoms and 20,000 surface sites, it is too computationally expensive to sample every site using quantum mechanics. Thus, an efficient machine learning algorithm is developed to predict the relevant properties of all the surface sites using only hundreds or thousands of random surface sites. Using this approach, we found that the favorable C2+ selectivity is due to the presence of a twin boundary site near the step surfaces involving the (100) and (111) surfaces, and we designed a new catalyst that will be more selective than the developed copper nanoparticles.
atom for effective training of the neural network model. We showed that we could obtain errors as low as 1meV/atom in energy and 0.1eV/A in force using 10 times less data than the conventional approaches. To verify the methodology, we implemented and performed molecular dynamics simulation using the trained machine learning force field to calculate the heat conductivity of amorphous silicon, which requires a long molecular dynamics simulation that is not possible in typical quantum mechanical calculations. Such methodology can be easily extended to catalytically relevant systems.
In summary, we have used quantum mechanics and machine learning to study a wide range of heterogeneous catalytic systems, from simple crystalline structure, to polycrystalline structure, and to amorphous structures. In the development of these new approaches, we found that the surface electrochemistry is governed by more complex quadratic relations, rather than the simple Nernst equation and the Butler-Volmer type kinetics for homogeneous systems. In addition, machine learning methods have been shown to be promising to extend quantum mechanical results for more complex systems. We believe that the novel approaches used in the above systems will enable new insights to guide further developments of electrochemistry.
References
1. Pimentel, D.; Pimentel, M. H. Food, Energy, and Society, CRC Press, Taylor & Francis Group: Florida, 2008.
6. Bithas K., Kalimeris P. (2016) A Brief History of Energy Use in Human Societies. In: Revisiting the Energy-Development Link. Springer Briefs in Economics. Springer, Cham: 2015.
7. Ourisson, G.; Albrecht, P.; Rohmer, M. The microbial origin of fossil fuels. Scientific American. 1984. 2. pp 44-51.
8. Berner, R. A. The long-term carbon cycle, fossil fuels, and atmospheric composition.
Nature. 2003. 426, 323-326.
9. Zou, C.; Zhao, Q.; Zhang, G.; Xiong, B. Energy revolution: From a fossil energy era to a new energy era. Natural Gas Industry B. 2016. 3(1), 1-11.
10.Norton, B. Harnessing Solar Heat. Springer Netherlands: The Netherlands, 2014.
11.Rodionova, M.V. et al. Biofuel production: challenges and opportunities.
International Journal of Hydrogen Energy, 2017. 42. 8450-8461.
12.Piotrowiak, P. Solar energy conversion, The Royal society of chemistry: Cambridge, UK. 2013.
13.Renewable Energy Policy Network for the 21st Century. Renewables 2018, global status report. Dec. 2018, Web.
15.O’Hayre, R.; Cha, S.-W.; Colella, W. G.; Prinz, F. B. Fuel cell fundamentals, third edition. John Wiley & Sons. New Jersey 2016.
16.Vangari, M.; Pryor, T.; Jiang, L. Supercapacitors: review of materials and fabrication methods. Journal of Energy Engineering, 2013. 139(2). pp 72.
17.Detz, R. J.; Reek, J. N.; van der Zwaan, B. C. C. The future of solar fuels: when could they become competitive? Energy Environ. Sci., 2018, 11, 1653.
18.Crabtree, G. The hydrogen economy. Physics Today, 2004. 57(12), 39.
19.Spurgeon, J. M.; Kumar, B. A comparative technoeconomic analysis of pathways for commercial electrochemical CO2 reduction to liquid products. Energy Environ. Sci., 2018, 11, 1536.
20.Morrison, S. R. Electrochemistry at Semiconductor and Oxidized Metal Electrodes, Springer U.S., Plenum Press, New York: 1980.
21.Bard, A. J., Faulkner, L. R. Electrochemical Methods, John Wiley & Sons, New York: 2001.
22.Sato, N. Electrochemistry at Metal and Semiconductor Electrodes., Elsevier Science B. V., Amsterdam, The Netherlands: 1998.
23.Trogadas, P.; Ramani, V.; Strasser, P.; Fuller, T. F.; Coppens, M.-O. Hierarchically Structured Nanomaterials for Electrochemical Energy Conversion. Angew. Chem. Int. Ed. 2016, 55, 122-148
24.Kolasinski, K. W. Surface science. John Wiley & Sons. Ltd. United Kingdom: 2012.
29.Hohenberg, P; Kohn, W. Inhomogeneous electron gas. Physical Review, 1964. 136(3B): B864-B871.
30.Engel, E.; Dreizler, R. M. Density Functional Theory. Springer-Verlag Berklin Heidelberg: 2011.
31.Kohn, W.; Sham, L. J. Self-consistent equations including exchange and correlation effects. Physical Review, 1965. 140(4A): A1133-A1138.
32.Perdew, J. P.; Burke, K.; Ernzerhof, M. Generalized gradient approximation made simple. Phys. Rev. Lett. 1997. 78, 1396.
33.Becke, A. D. Density-functional thermochemistry. III. The role of exact exchange. J. Chem. Phys. 1993. 98, 5648.
34.Hill, T. L. An introduction to statistical thermodynamics. Courier Corporation: United States, 1986.
35.Skyner, R. E.; McDonagh, J. L.; Croom, C. R.; van Mourik, T.; Mitchell, J. B. O. A review of methods for the calculation of solution free energies and the modelling of systems in solution. Phys. Chem. Chem. Phys. 2015, 17, 6174-6191.
37.Jackson, J. D. Classical electrodynamics, third edition. John Wiley & Sons: Singapore, 1999.
38.Skúlason, E., Karlberg, G. S., Rossmeisl, J., Bligaard, T., Greeley, J., Jónsson, H., Nørskov, J. K. Density functional theory calculations for the hydrogen evolution reaction in an electrochemical double layer on the Pt(111) electrode. Physical Chemistry Chemical Physics, 2007, 9(25), 3241–3250.
39.Taylor, C. D., Neurock, M. Theoretical insights into the structure and reactivity of the aqueous/metal interface. Current Opinion in Solid State and Materials Science, 2005, 9(1–2), 49–65.
40.Taylor, C., Wasileski, S., Filhol, J.-S., Neurock, M. First principles reaction modeling of the electrochemical interface: Consideration and calculation of a tunable surface potential from atomic and electronic structure. Physical Review B, 2006, 73(16), 165402.
41.Jinnouchi, R., Anderson, A. B. Electronic structure calculations of liquid-solid interfaces: Combination of density functional theory and modified Poisson-Boltzmann theory. Physical Review B, 2008, 77(24), 245417.
42.Sha, Y.; Yu, T. H.; Merinov, B. V.;Goddard, W. A. Prediction of the Dependence of the Fuel Cell Oxygen Reduction Reactions on Operating Voltage from DFT Calculations. The Journal of Physical Chemistry C, 2012, 116(10), 6166–6173.
1. Introduction
A major challenge in renewable energy technology is water splitting; that is, using solar radiation to photoelectrochemically convert water molecules into H2 and O2. Here, both the hydrogen evolution reaction (HER) and the oxygen evolution reaction (OER) present challenges for the catalysts. The detailed reaction mechanisms have not yet been established for either one. Here, we consider the easier case of HER.
Platinum is the most efficient inorganic HER catalyst; however, the cost of platinum has motivated an extensive search for earth abundant HER catalysts1. Hinnemann et al.2 reported
DFT calculations suggesting that molybdenum disulfide (MoS2) can catalyze HER because of its nearly thermoneutral hydrogen adsorption energy. Indeed, Jaramillo et al.3 synthesized
MoS2 on Au(111) and showed that the activity for HER correlates linearly with the total length of the exposed edges of crystalline MoS2. Since then, numerous experimental synthetic techniques have attempted to synthesize MoS2 catalysts that carry out HER more efficiently4. Molecular analogues were also studied5.
Although the hydrogen adsorption energy has been a useful descriptor for screening materials to identify candidates for HER, it is reaction barriers that determine the rates. Thus, to design the most efficient HER catalysts, we must determine the reaction barriers for the various reaction sequences that can convert protons and electrons to H2. Here, the pathway with the lowest rate-determining step (RDS) is expected to dominate the reaction rate.
S and H using the 6-31G** basis set10 for structure optimization, and the 6-311G**++ basis
set11,12 (hydrogen and oxygen) and the 6-311G-3df basis set12,13 (sulfur) for the final
electronic energy. The solvation energy was calculated by solving the Poisson-Boltzmann equation (PBF)14 at the optimized geometry (using a solvent radius of 1.4A and a dielectric
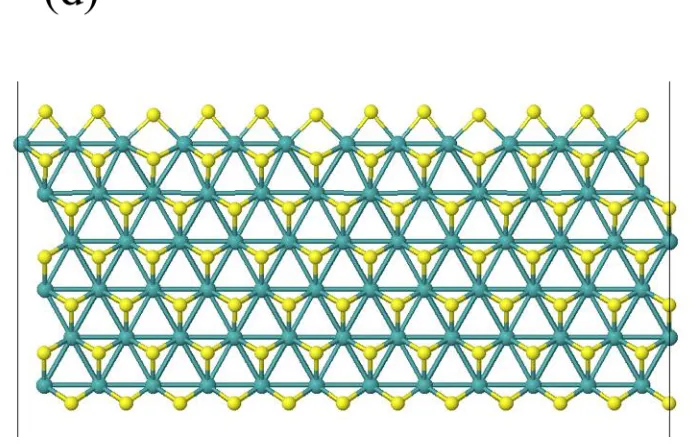
Figure 1. (a) Top view of the 2D MoS2 sheet. The two horizontal dashed lines indicate terminations along the (101̅0) Mo-edge and (1̅010) S-edge. The two triangles represent the terminations for Mo-edge and S-edge clusters; (b) Schematic representation of the 50% S coverage Mo-edge cluster; (c) Optimized triangular Mo-edge cluster with stoichiometry of Mo10S21. (d) Optimized structure of a 12Mo x 6Mo slab, where the Mo-edge (top edge) clusters into groups of 3 Mo. The same structure is obtained for the 3Mo and 6Mo wide slab.
The free energy of an H2 molecule at 1atm and 298K was calculated as above. The free energy of H+ at 1M in water (G = -270.3 kcal/mol) was taken to be its gas-phase value (G(H+, 1atm) = H – TS = 2.5 kBT – T * 26.04 = -6.3 kcal/mol) plus the empirical hydration energy (G(H+, 1atm→1M) = -264.0 kcal/mol)16. Using the definition of the standard hydrogen
electrode (SHE) condition where e- and H+ (pH=0) are in equilibrium with 1atm H2, the free energy of an electron at SHE can be determined as the difference between the free energies of ½H2 and H+. The chemical potential of electrons and protons away from the SHE condition are then calculated as
μe(E) = μe(SHE) - 23.06 × E, and
[image:25.612.144.491.114.338.2]energies. We used the projected augmented wave (PAW)18 method for pseudopotentials to
represent the effects of the inner 36 core electrons of Mo and the 10 electrons of the S, so that only the outmost 6 electrons of both Mo and S are described explicitly. Slab calculations are performed in VASP19.
Since the slab model consists of only a single S-Mo-S tri-layer with both the Mo-edge and the S-edge exposed, we used the Monkhorst-Pack 4 × 1 ×1 k-point mesh, where 4 k-points are used in the periodic direction. The electronic energy was minimized within 0.1 mH, and the geometry was optimized to 0.1 mH/A.
For these periodic calculations, the reference H2 molecule is calculated in a 15A × 15A × 15A cubic vacuum space with only the Γ point.
3. Model Systems
3.1 Periodic Slab. The dominant phase for bulk crystalline MoS2 is the 2H phase with AB stacking of the graphene-like hexagonal 2D sheets20. Upon synthesis, the exposed surfaces
are generally the (001) basal plane of the S-Mo-S tri-layer, the Mo-edge (101̅0) and S-edge
(1̅010). It was shown experimentally that the activity of the catalyst correlates directly with
the total length of the exposed edges3. A recent experiment confirms this observation by
comparing the activities between the edges and the basal plane21. In addition, we expect the
density (0.6 × 10⁻⁷A/cm2)22 reported for triangular pyramidal MoS
2 platelets is in the same order of magnitude as monolayer MoS2 (1.3 × 10⁻⁷ A/cm2)3. The edges from the top layers contribute little to the activity, thus the monolayer MoS2 is sufficient to understand the chemistry of HER on MoS2 edges.
STM studies of MoS2 crystals show three stable edge configurations: 100% S coverage of the Mo-edge, 50% S coverage of the Mo-edge, and the S-edge23. Under the sulfiding
conditions appropriate for hydrodesulfurization (HDS) processes, the Mo-edge has been established experimentally as the dominant form; however, under HER conditions with no external sulfur = 50% S coverage of the Mo-edge is the most stable form24-26. This has also
been observed in a recent HR-STEM study27. This structure was assumed in the previous
DFT studies of HER on MoS22. Thus, to study HER electrocatalysis, we chose to examine the 50% coverage case for the Mo-edge.
Experimental studies have observed finite MoS2 clusters ranging from 1 nm to bulk. However, for systems of such large sizes, it is convenient to use periodic boundary conditions in the x direction, exposing the Mo-edge in the +y direction and the S-edge in the -y direction (Figure 1). We carried out DFT calculations for such periodic slabs and found that models that are three or six unit cells long in the periodic direction relax to structures 0.1 eV/Mo lower than models that are either two or four unit cells long. This has also been observed in other studies of the 50% S coverage Mo-edge calculations but not yet explained25,28.
with 6 and 12 Mo periodicity in the x- direction show the same triad reconstruction, as shown in Figure 1d.
3.2 Cluster Model. Using molecular clusters to model a periodic system for determining reaction mechanisms allows more flexibility in the accuracy of the methods (allowing us to use M06L, which is more accurate for reaction barriers and bond energies than PBE7, the
most common method for periodic calculations). It is straightforward to use clusters with net charges (difficult in PBC), and we can use the PBF (Poisson Boltzmann) continuum solvation method that has been well-validated for aqueous solvation energies29. Indeed,
experiments can be carried out on supported MoS2 to validate predictions.
Figure 1a shows how we extract a triangular cluster from the periodic array to expose only the Mo edges. Figure 1b shows the schematic representation of the finite cluster and Figure 1c shows the optimized structure.
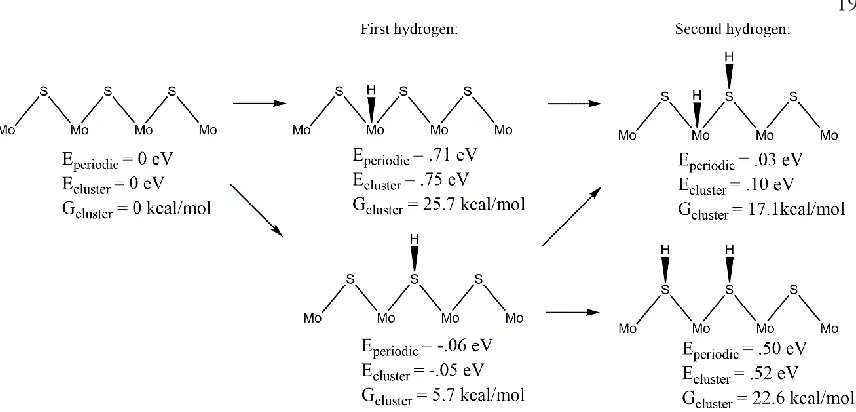
Figure 2. Hydrogen adsorption on the Mo-edge. Eperiodic is the relative electronic energy calculated from periodic calculations using ½ H2 as the reference energy for H atom. Ecluster is the relative electronic energy from cluster calculations, and Gcluster is the relative free energy from cluster calculations. This indicates that the first H strongly prefers to bind to S by 0.8 eV, but the 2nd H prefers to bind to a Mo instead of binding to a 2nd S by 0.42 eV.
4. Result and Discussion
We next describe the predicted energetics for the various reaction steps relevant for HER. Using the cluster model, we can now add or subtract electrons and protons independently in discrete steps. First, we calculate the free energies of the most likely intermediates to serve as a basis for describing the thermodynamics of HER. Then, we examine the barriers of the various reaction steps to locate the rate limiting step.
4.1 Thermodynamics of the Mo-edge. Figure 2 shows that the first hydrogen strongly prefers to bind to the edge sulfur atom rather than the molybdenum atom by 0.8 eV (electronic energy) and leads to a net binding energy relative to H2 of 0.05 eV. However, after including solvation effects, vibrational corrections, and entropy corrections, the free energy for adding a hydrogen atom to the edge S atom is 5.7 kcal/mol uphill relative to H2.
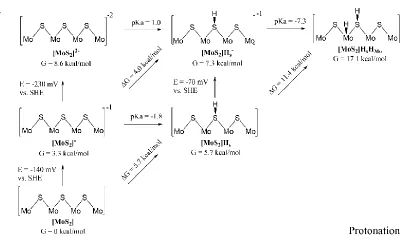
[image:29.612.111.539.77.283.2]Figure 3. Thermodynamics (free energies at 298K, pH=0, and E=0V vs. SHE) for the most stable configurations as a function of the number of protons and electrons added. Here we start with the Mo-edge cluster at equilibrium at the SHE potential. Each structure to the right has one additional proton. Each structure along the ordinate has one more electron, representing a reduction step.
In order to evolve an H2 molecule, protons and electrons must be added to the cluster. Here, it is useful to examine first the most stable structures with each number of extra electrons and each number of extra protons to understand the free energy differences between intermediate states, and ultimately find the lowest-barrier pathway. These free energies are shown in Figure 3.
1. At SHE conditions with E=0V and pH=0, the most stable state is [MoS2], the bare neutral
Mo-edge.
2. The first reduction potential to obtain [MoS2]-, is only -140mV, leading to a negatively
3. Protonating [MoS2] leads to [MoS2]HS+ (subscript s indicates the hydrogen atom is
bound to a S atom) with an energy cost of 7.2 kcal/mol.
4. Instead of Step 3, we can add a proton to the edge S having an extra electron, [MoS2]-,
to form [MoS2]HS, which costs ΔG=2.4 kcal/mol, corresponding to a pKA of -1.8. Comparing to [MoS2] the cost of adding an H atom (a proton and an electron
simultaneously) is ΔG=5.7 kcal/mol as in Figure 2. If instead we put the H on the Mo to
obtain [MoS2]HMo, the energy is 25.7 kcal/mol relative to [MoS2], corresponding to an
excitation energy of ΔG=20.0 kcal/mol.
5. Adding now an electron to [MoS2]HS to form [MoS2]HS- occurs at a potential of –0.07
V. Moving the H from the S to the Mo, to form [MoS2]HMo-, costs ΔG=5.9 kcal/mol.
6. Starting with [MoS2]HS- from Step 5 we can add a proton to obtain [MoS2]HSHMo at a
cost of 9.7 kcal/mol (pKA = -7.3).
7. Thus, the [MoS2] → [MoS2]- → [MoS2]HS → [MoS2]HMo- →[MoS2]HSHMo pathway
may proceed with no highly endergonic steps.
We can also consider the case with more hydrogen on the cluster, which would be required by a Volmer-Tafel mechanism. However, as shown in Figure 3, an extra hydrogen is thermodynamically much more difficult, with a cost of about 11 kcal/mol ([MoS2]Hs →
[MoS2]HSHMo).
Based on this thermochemistry, the highest-free energy intermediates for either a Heyrovsky ([MoS2]H-) or Tafel ([MoS2]HSHMo) mechanism are the last intermediates in the cycles.
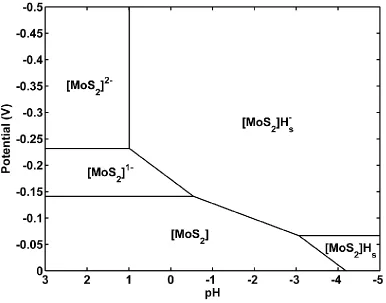
Figure 4. Calculated Pourbaix diagram for the surface states of the Mo-edge cluster.
4.2 Pourbaix Diagram. The intermediate species considered in Figure 3 lead to the Pourbaix diagram in Figure 4, showing the dominant phases as a function of pH and external potential. It is sufficient to use only the species in Figure 3, since only the most stable structure for a given stoichiometry appears on the Pourbaix diagram.
In the range of pH and potentials that are relevant to HER, 5 states are present. Starting from SHE at pH=0 and E=0V, and applying increasingly negative potentials, the cluster is reduced first to [MoS2]- to become negatively charged. Further reducing the potential leads to the
[MoS2]Hs- structure (at pH=0) rather than the -2 charged state. At very negative pH and
potential, the [MoS2]Hs structure is the most favorable, since the potential is not sufficiently
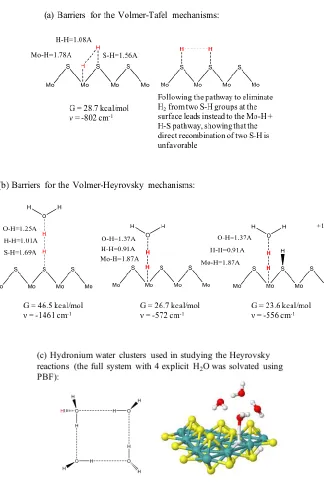
4.3 Transition States Analysis. Two types of transition states are considered in this study: the Volmer-Tafel mechanism in which two adsorbed hydrogens react to form H2, and the Volmer-Heyrovsky mechanism with one adsorbed hydrogen reacting with a solvated proton. The calculated free energy barriers are shown in Figure 5, at a potential of 0V and pH = 0.
4.3.1 Volmer-Tafel Mechanism. In the Volmer-Tafel mechanism, two adsorbed hydrogens next to each other react to form a dihydrogen molecule. Since there are two types of atoms, S and Mo, on the edge, we considered reactions of the type S-H + H-S and Mo-H + H-S. However, constraining the H atoms on two adjacent sulfurs to move toward a possible transition state, the hydrogen on one sulfur instead first moves onto the nearby Mo atom, forming a Mo-H species. Thus, a transition state of the type S-H + H-S is electronically unreasonable. Thus, the Volmer-Tafel reaction on the Mo-edge takes place between hydrogens on adjacent Mo and S atoms. Beginning from a relaxed geometry in which the H-H distance was constrained to 1.0 angstrom, eigenvector following was used to locate a transition state with a single imaginary frequency. This transition state geometry was found to have bond distances of
1.78 A for Mo-H (compared to the equilibrium Mo-H bond of 1.67A);
1.08 A for H-H (compared to a final H-H bond of 0.74A), and
1.56 A for S-H (compared to a normal S-H bond of 1.35A).
The free energy at the transition state is 28.7 kcal/mol relative to the [MoS2] ground state. It
is 11.6 kcal/mol above the preceding intermediate [MoS2]HSHMo.
First, we examined the hydronium reacting with an adsorbed hydrogen atom bound to the edge sulfur atom. Again, transition state structures were located by following imaginary modes from constrained initial guesses. The transition state found for S-H + H-OH2 has a free energy of 46.5 kcal/mol, which is too high for hydrogen evolution on the Mo-edge.
Using the same strategy, we found that the transition state free energies for reacting with the Mo hydrides [MoS2]HMo- and [MoS2]HMoHS are 26.7 and 23.6 kcal/mol. The barriers for
this process are much lower than the S-H case, making them the most favorable transition structures to form H2. The free energy profile for these reactions shows that protonation of the edge S atom promotes hydride transfer, resulting in a lower barrier for hydride transfer from [MoS2]HMoHS (G=17.1kcal/mol) than from [MoS2]HMo- (G=13.2kcal/mol). The bond
distances for the [MoS2]HMoHS case are 1.93 A for Mo-H, 0.85 A for H-H, and 1.51 A for
H-OH2, which correspond to a late transition state.
4.3.3 Overall Reaction. For the Mo-H + H-OH2 transition state to be rate-limiting, we must confirm that the barriers in the previous steps are smaller. Choosing the [MoS2] → [MoS2]
-→ [MoS2]Hs → [MoS2]HMo- → [MoS2]H2 path described in the thermodynamic section,
we calculated transition states for the protonation and migration steps that are of smaller energy than the Heyrovsky barrier, as shown in Figure 6.
This mechanism gives insights on why MoS2 is a good catalyst. The direct protonation of the Mo atom leads to a calculated high barrier of 28.1 kcal/mol, but in the presence of the S atom, the hydrogen adsorbs first on the chalcogenide, then migrates to the Mo atom (barrier = 20.5 kcal/mol), and finally reacts with a proton from solution to form H2. These multiple steps lower the barrier for the whole process.
Toulhoat et al. computationally examined the dissociation of H2 on MoS2 edges in the context of hydrodesulfurization (i.e., water free)30. In the absence of a protic solvent, our results are
Figure 6. Overall reaction mechanism for HER on the Mo-edge cluster. The edge is first reduced by one electron, followed by a protonation to create a sulfur-bound hydrogen with a small barrier of 6.3 kcal/mol. The structure is further reduced by one more electron, followed by the migration of hydrogen onto the Mo atom with a relatively high barrier of 20.5 kcal/mol. The edge is protonated again by hydronium with a barrier of 18.0 kcal/mol. Finally, the metal hydride reacts with a proton from solution, forming dihydrogen with a barrier of 23.6 kcal/mol. All the free energies are relative to the ground state with no adsorbed hydrogens.
Finally, our result can be compared with estimates from Jaramillo’s experimental study3. At
a potential of -150mV and pH = 0.24, he estimated a turnover frequency (TOF) of 1.64⨯ 10-2 s-1 per edge molybdenum atom for hydrogen evolution on the Mo edge clusters. Using transition state theory,
Rate = (kBT/h) × exp(-∆G‡/RT)
Mo S Mo S Mo S Mo H [MoS2]HS -G = 7.3 kcal/mol
-1 Mo S Mo S Mo S Mo H -1 [MoS2]HMo -G = 13.2 kcal/mol
‡ 20.5 kcal/molMigration
Mo S Mo S Mo S Mo H
[MoS2]HMoHS G = 17.1 kcal/mol
H ‡ 18.0 kcal/mol Protonation Mo S Mo S Mo S Mo +1 [MoS2]HS -G = 7.2 kcal/mol
This TOF corresponds to a barrier of 19.9 kcal/mol. After adjusting our theoretical calculations for the chemical potentials due to the applied potential and pH, the ground state shifts to the negatively charged unprotonated structure, as shown in Figure 4. From the new resting state, we calculate an adjusted barrier of 17.9 kcal/mol, very close to the 19.9 kcal/mol from the experimental estimate.
The Tafel slope b can also be estimated from the theoretical calculation, assuming electron transfer from the support to the catalyst does not limit the rate. We expect that
b=2.3RT/nF≈60mV/n, where n is the difference in the number of electrons between the ground state and the transition state. Under reaction conditions, n=1 since the ground state has shifted to the negatively charged structure, as shown in the Pourbaix diagram in Figure 4. In this case, the Tafel slope is 60 mV/dec, in agreement with the value of 55~60mV/dec from the experimental Tafel plot3. Different polymorphs of MoS
2 have been shown to have different Tafel slopes, likely due to the effects of conductivity, which are minimized in the case of single MoS2 layers on Au(111). For example, Chhowalla et al. measured a lower Tafel slope of 40mV/dec using 1T-MoS2, but proposed a different active site in the basal planes was responsible for HER31. Cao et al. also reported that the transition from crystalline
MoS2 to amorphous MoS3 resulted in a change of Tafel slope from c.a. 90mV/dec to 40 mV/dec32.
5. Conclusion
Modeling the Mo-edge of a single MoS2 sheet with a Mo10S21 cluster model, we found that the HER mechanism takes place through the Volmer-Heyrovsky mechanism involving an electron rich molybdenum hydride and a hydronium cation. This leads to an estimated barrier of 17.9 kcal/mol in good agreement with the experiment, in which the barrier 19.9 kcal/mol is estimated from the turnover frequency (TOF).
chalcogenide could lower the barrier for this mechanism.
Based on the volcano plot concept33, it is widely believed that the binding energy of hydrogen
on sulfur is the most important factor towards HER on crystalline MoS2. However, we find that the sulfur-hydrogen species is not the critical intermediate since the free energy of this species does not play a role in determining the effective activation barrier.
In fact, we find that the predicted activation barrier for reaction between molybdenum hydride and hydronium is in agreement with the experimental rate of per-site TOF. This indicates that kinetic parameters should be used as a descriptor for reactivity, rather than equilibrium thermodynamics.
In conclusion, to design a more reactive catalyst from exposed MoS2 edges, one should focus on lowering the reaction barrier between the metal hydride and a positively charged proton, either from the sulfur hydrogen species on the edge or from the hydronium in solution.
References
1. Laursen, A. B.; Kegnæs S.; Dahl, S.; Chorkendorff, I. Energy Environ. Sci. 2012, 5, 5577-5591. Merki, D.; Hu, X. Energy Environ. Sci. 2011, 4, 3878-3888. Yang, J.; Shin, H. S. J. Mater. Chem. A. 2014, 2, 5979-5985
3. Jaramillo, T. F.; Jørgensen, K. P.; Bonde, J. Nielsen, J. H.; Horch, S.; Chorkendorff, I.
Science, 2007, 317(5834), 100-102.
4. Kibsgaard, J.; Chen, Z.; Reinecke, N.; Jaramillo, T. F. Nature Materials 2012, 11, 963-969. Li, Y.; Wang, H.; Xie, L.; Liang, Y.; Hong, G.; Dai, H. J. Am. Chem. Soc. 2011, 133(19), 7296-7299. Liao, L.; Zhu, J.; Bian, X.; Zhu, L.; Scanlon, M. D.; Girault, H. H.; Liu, B. Adv. Funct. Mater. 2013, 23, 5326-5333. Bonde, J; Moses, P. G.; Jaramillo, T. F.; Nørskov, J. K.; Chorkendorff, I. Faraday Discuss. 2008, 140, 219-231. Merki, D.; Vrubel, H.; Rovelli, L.; Fierro, S.; Hu, X. Chem. Sci. 2012, 3, 2515.
5. Appel, A. M.; Lee, S.-J.; Franz, J. A.; DuBois, D. L.; DuBois, M. R. J. Am. Chem. Soc.
2009, 131, 5224-5232. Karunadasa, H. I.; Montalvo, E.; Sun, Y.; Majda, M.; Long, J. R.; Chang, C. J.; Science 2012, 335, 698.
6. Zhao, Y.; Truhlar, D. G. J. Chem. Phys., 2006, 125, 194101.
7. Zhao, Y.; Truhlar, D. G. Theor. Chem. Account. 2008, 120, 215-241.
8. Melius, C. F.; Olafson, D. B.; Goddard, W. A., III. Chem. Phys. Letters 1974, 28, 457-462. Melius, C. F.; Goddard, W. A., III. Phys. Rev. A 1974, 10, 1528.
9. Hay, P. J.; Wadt, W. R. J. Chem. Phys. 1985, 82, 270. Wadt, W. R.; Hay, P. J. J. Chem. Phys. 1985, 82, 284.
10. Hehre, W. J.; Ditchfield, R.; Pople, J. A. J. Chem. Phys. 1972, 56, 2257. Francl, M. M.; Pietro, W. J., Hehre, W. J.; Binkley, J. S.; Gordon, M. S.; DeFrees, D. J.; Pople, J. A. J. Chem. Phys. 1982, 77, 3654. Hariharan, P. C.; Pople, J. A. Theoretica Chimica Act. 1973, 28, 213-222
11. Krishnan, R.; Binkley, J. S.; Seeger, R.; Pople, J. A. J. Chem. Phys. 1980, 72, 650.
D. M.; Rinaldo, D.; Halls, M. D.; Zhang, J.; Friesner, R. A. Int. J. Quantum Chem. 2013, 113, 2110-2142.
16. Tissandier, M. D.; Cowen, K. A.; Feng, W. Y.; Gundlach, E.; Cohen, M. H.; Earhart, A. D.; Coe, J. V.; Tuttle, T. R., Jr. J. Phys. Chem. A 1998, 102, 7787-7794.
17. Perdew, J. P.; Burke, K.; Ernzerhof, M. Phys. Rev. Lett. 1996, 77, 3865. Perdew, J. P.; Burke, K; Ernzerhof, M. Phys. Rev. Lett. 1997, 78, 1396.
18. Blöchl, P. E.; Phys. Rev. B 1995, 50, 17953. Kresse, G.; Joubert, D. Phys. Rev. B 1999, 59, 1758.
19. Kresse, G.; Hafner, J. Phys. Rev. B 1993, 47, 558. Kresse, Hafner, J. Phys. Rev. B 1994, 49, 14351. Kresse, G.; Furthmüller, J. Comput. Mat. Sci. 1996, 6, 15. Kresse, G.; Furthmüller, J. Phys. Rev. B 1996, 54, 11169.
20. Wang, Q. H.; Kalantar-Zadeh, K.; Kis, A.; Coleman, J. N.; Strano, M. S. Nature Nanotechnology, 2012, 7, 699-712.
21. Wang, H.; Zhang, Q.; Yao, H.; Liang, Z.; Lee, H.-W.; Hsu, P.-C.; Zheng, G.; Cui, Y.
Nano Lett. 2014, 14, 7138-7144.
23. Helveg, S.; Lauritsen, J. V.; Laegsgaard, E.; Stensgaard, I.; Nørskov, J. K.; Clausen, B. S.; Topsøe, H.; Besenbacher F. Phys. Rev. Lett. 2000, 84, 951-954.
24. Lauristen, J. V.; Bollinger, M. V.; Laegsgaard, E.; Jacobsen, K. W.; Nørskov, J. K.; Clausen, B. S.; Topsøe, H.; Besenbacher, F. J. Catal. 2004, 221, 510-522.
25. Schweiger, H.; Raybaud, R.; Kresse, G.; Toulhoat, H. J. Catal. 2002, 207, 76-87.
26. Moses, P.G.; Hinnemann, B.; Topsøe H.; Nørskov, J. K. J. Catal. 2007, 248, 188-203
27. Hansen, L. P.; Ramasse, Q. M.; Kisielowski, C.; Brorson, M.; Johnson, E.; Topsøe, H.; Helveg, S. Angew. Chem. Int. Ed. 2011, 50, 10153-10156.
28. Li, T.; Galli, G. J. Phys. Chem. C 2007, 111, 16192-16196.
29. Jaramillo-Botero, A.; Nielsen, R.; Abrol, R.; Su, J.; Pascal, T.; Mueller, J.; Goddard, W. A. III. Top. Curr. Chem. 2012, 307, 1-42. Marenich, A. V.; Olson, R. M.; Kelley, C. P.; Cramer, C. J.; Truhlar, D. G. J. Chem. Theory Comput. 2007, 3, 2011-203.
30. Prodhomme, P.-Y.; Raybaud, P.; Toulhoat, H. J Catal. 2011, 280, 178-195.
31. Voiry, D.; Salehi, M.; Silva, R.; Fujita, T.; Chen, M.; Asefa, T.; Shenoy, V. B.; Eda, G.; Chhowalla, M. Nano Lett. 2013, 13(12), 6222-6227.
32. Li, P.; Yu, Y.; Huang, Y.; Nielsen, R. J.; Goddard, W. A. III; Li, Y.; Cao, L. ACS Catal.
2015, 5, 448-455.
m2 kg s-2 K-1, T = 298K, h = 6.63 x 10⁻³⁴ J·s, R = 1.987 x 10⁻³ kcal/(K·mol), ∆G‡ is found to be 19.9 kcal/mol.
Reference
C h a p t e r 3
THE REACTION MECHANISM FOR THE HYDROGEN EVOLUTION
REACTION ON THE BASAL PLANE SULFUR VACANCY SITE OF
MOS
2USING GRAND CANONICAL POTENTIAL KINETICS
Abstract
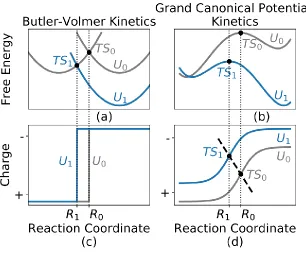
Figure 1. Schematic showing how voltage dependent electrochemical reactions described by grand canonical potential kinetics (GCP-K). (b) and (d) differs from the more standard view of Butler-Volmer kinetics (a) and (c). As the voltage is changed from U0 to U1, the energy profiles shift as in (a) and (b), while the relevant reaction coordinate changes from R0 to R1. The Butler-Volmer picture in (c) can be considered as a special case of the GCP-K scheme (d) in which the electron transfers instantaneously.
drive the chemical reactions. Recently, we have developed modifications in the traditional QM (fixed numbers of electrons) to enable the applied voltage (U) to be fixed, Grand Canonical QM (GC-QM)6. In GC-QM, the charges change continuously during the electrochemical reaction to keep the applied U constant. This provides a new way (Grand Canonical Potential Kinetics, GCP-K) to understand the kinetics, completely different from the traditional Butler-Volmer description of electrochemistry in which the potential surface is followed for each species keeping an integer number of electrons, from which the system can transform to a product state by tunneling between the electrode and the reacting molecule. This is illustrated in Figure 1.
Although the voltage dependent grand canonical potential can be obtained from quantum mechanical calculations, the connection to the Butler-Volmer kinetics is non-trivial as the latter theory is formulated for integer-charged solvated molecules. In this paper, we provide a macroscopic theoretical foundation for a new understanding of heterogeneous electrochemistry based on GPC-K and compare it to the traditional Butler-Volmer description.
Particularly, we will show that the voltage-dependent grand canonical potential (GCP) for surface states can be derived from traditional fixed-electron based free energies by using a Legendre transformation. As a result, we find that GCP depends quadratically on the applied potential U and on the number of electrons allowing a continuous description of the evolution of the reaction intermediates and transition states.
performance is less favorable than the edge sites18-21. Later, it was found that artificially creating sulfur vacancies using Ar plasma showed a correlation between the number of vacant sites and HER activity22. However, the experimental conclusion of this study is controversial, since others showed that the creation of sulfur vacancy by plasma is not
responsible for the HER23. Later, it was found that under electrochemical conditions sulfur vacancies are created without the use of Ar plasma24. However, the interpretation is complicated because the observed reactivity might also arise from the presence of edge sites since they are known to be active towards HER. This complicates the experimental identification of the true nature of the active sites. Thus, although many studies have been performed to optimize the basal plane for HER, the reaction mechanism is not yet established.
In this study, we performed QM calculations using our new grand canonical potential (GCP-K) formulation to determine the reaction steps as a function of applied potential involved in HER at sulfur vacancies on the basal plane of MoS2. By accounting for all HER related chemical processes, we predict the Tafel plots and onset potentials in both the acidic and basic conditions.
In contrast to the simplistic view in which the performance descriptor is protonation of the reactive site, we find that it is the addition of the second hydrogen to the reactive site that is the important step. Indeed, this Volmer step determines the reaction rates in both acidic and basic conditions. Thus, we conclude that the adsorption energy of the second hydrogen atom can be used as the proper descriptor to assess performance for the class of group VI transition metal dichalcogenides.
2. The Grand Canonical Potential (GCP) formulation using the constant charge condition
Quantum mechanics (QM) calculations, such as density functional theory (DFT), are nearly always performed with a fixed number of electrons. To appropriately account for electrochemical conditions at a specified applied voltage, we must modify the methodology for the QM. Early methods to correct the QM for electrochemical systems obtained a relationship between the number of electrons and the work function of the slab surface, where surface coverage26, explicit ions, or uniform background charges27,28 were introduced to modulate the work function of the system. Later, it was found that counter ions can be included in the implicit solvation model to provide a combined solvent-slab free energy, where the corresponding grand canonical potential is defined as in (1) so that electrochemistry processes can be obtained directly using G(n; U)29-31.
𝐺(𝑛; 𝑈) = 𝐹(𝑛) − 𝑛𝑒(𝑈𝑆𝐻𝐸− 𝑈) (1)
where G is the grand canonical free energy, which depends on the applied voltage U vs. SHE,
n is the number of electrons, e is unit electron volt in energy, F is the total free energy as a function of n, and USHE = μe,SHE/e is the electronic energy at the standard hydrogen electrode (SHE) condition. The signs are chosen such that U is directly related to the experimentally defined value, i.e., U=−0.1V corresponds to −0.1V vs. SHE. Changing to the reference
𝜇𝑒 = 𝑑𝑛 = 𝑒(𝑈𝑆𝐻𝐸− 𝑈) or 𝑑𝑛 = 0 (2)
Thus, we define the macroscopic thermodynamic Grand Canonical Potential (GCP) as in (3).
GCP(𝑈) = min
n 𝐺(𝑛; 𝑈) = minn (𝐹(𝑛) − 𝑛𝑒(𝑈𝑆𝐻𝐸− 𝑈)) (3)
Since experimental observations typically involve the response of a chemical system as a function of the applied voltage, we recommend using GCP(U) directly as an explicit function of U in QM calculations modeling electrochemical processes. In contrast, many recent studies have assumed a GCP(U) that depends linearly on U 34-35.
Instead, our definition of the GCP(U) in the form of minimization as in Equation (3), makes it immediately obvious that the linear approximation is not correct. The form of F(n) must be at least quadratic in n in order to describe the minimization of GCP(n; U). As reported previously27-28, the form of GCP(U) is in fact approximately quadratic. Hence, we expand
F(n) in a quadratic form
F(n) = a(n – n0)2+b(n − n0) + c,
where a, b, and c are fitted parameters. Substituting and performing the minimization, we have
GCP(𝑈) = − 1
4𝑎(𝑏 − 𝜇𝑒,SHE+ 𝑒𝑈) 2
+ 𝑐 − 𝑛0𝜇𝑒,𝑆𝐻𝐸+ 𝑛0𝑒𝑈 (4)
First, when the system is neutral, F(n = n0) = c.
Second, the number of electrons is 𝑛(𝑈) = −1
𝑒
𝜕𝐺𝐶𝑃(𝑈)
𝜕𝑈 = 𝑛0− 1
2𝑎𝑒(𝑏 − 𝜇𝑒,SHE+ 𝑒𝑈). Thus at the potential of zero charge, n(UPZC)=n0, and we obtain b = μe,SHE – eUPZC.
Finally, the differential capacitance is 𝐶diff = 𝜕𝑛
𝜕𝑈= − 1
2𝑎, which gives 𝑎 = − 1 2𝐶diff.
Summarizing, the grand canonical potential and the free energy have the following form in terms of physical quantities:
GCP(𝑈) =𝑒2𝐶diff
2 (𝑈 − 𝑈PZC) 2+ 𝑛
0𝑒𝑈 + 𝐹0− 𝑛0𝜇𝑒,𝑆𝐻𝐸 (5a)
𝐹(𝑛) = − 1
2𝐶diff(𝑛 − 𝑛0
)2+ (𝜇
𝑒,𝑆𝐻𝐸− 𝑒𝑈PZC)(𝑛 − 𝑛0) + 𝐹0 (5b)
where
Cdiff is the differential capacitance, calculated from parameter a,
UPZC is the potential of zero net charge, calculated from parameter b,
F0 is the free energy at zero net charge, calculated from parameter c,
n0 is the number of electrons at zero net charge, summing all valence electrons in the QM,
μe,SHE is the chemical potential of an electron vs. SHE, and
e is the energy of an electron volt, which is for unit conversion from voltage to energy
was proposed previously , but the relationship between n and U was established via the work function rather than a proper thermodynamic minimization.
Our approach shows that the work function is not needed to calculate the grand canonical potential since we define GCP(U) rigorously from the free energy F(n) via a Legendre transform. Using the Legendre transform allows us to write F(n) and GCP(U) in terms of physical parameters, with the connection to Butler-Volmer kinetics as discussed below.
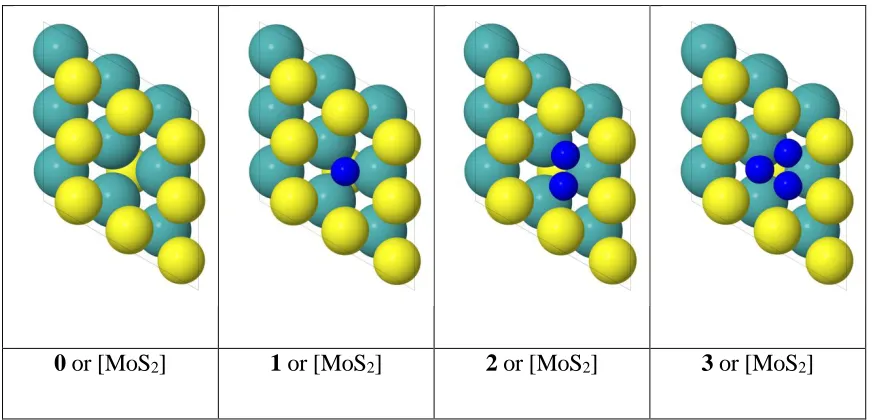
0 or [MoS2] 1 or [MoS2] 2 or [MoS2] 3 or [MoS2]
Figure 2. Four possible states for Hydrogen adsorption at the sulfur vacancy site. Blue: hydrogen atom; yellow: sulfur atom; cyan: molybdenum atom.
3. Simulation Model for the Basal Plane of MoS2
[image:50.612.107.543.360.570.2]atoms at the vacant site. We label them as 0, 1, 2 and 3 or [MoS2], [MoS2]H, [MoS2]H2 and [MoS2]H3 in Figure 2. A detailed description of the quantum mechanical calculations is provided in the supplementary information.
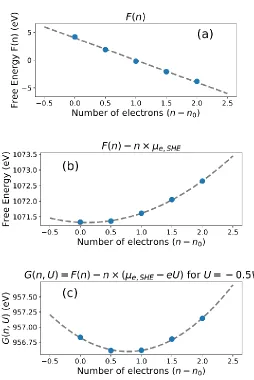
To illustrate the quadratic behavior of the grand canonical potential, we examined the voltage dependence for [MoS2]H in detail. [MoS2]H is used here because we find below that it is both the most stable intermediate thermodynamically and most populous for the steady state reaction. Figure 3(a) shows that the solvated free energy F(n) as a function of accumulated charges appears to be linear. However, this is due to the large contribution from the free energy of an electron at SHE. Rearranging Equation (5), leads to (6),
𝐹(𝑛) − 𝜇𝑒,𝑆𝐻𝐸𝑛 = − 1
2𝐶𝑑𝑖𝑓𝑓(𝑛 − 𝑛0) 2− 𝜇
𝑒,𝑆𝐻𝐸𝑛0 − 𝑒𝑈𝑃𝑍𝐶(𝑛 − 𝑛0) + 𝐹0 (6)
Equation (6) reveals the quadratic dependence on charge, as shown in Figure 3(b). We see that the minimum is approximately at n=n0.
Under electrochemical conditions, a nonzero voltage, U, is applied to drive the reaction. This shifts the free energy in Equation (6) by neU, leading to G(n, U), as defined in Equation (1). Figure 3(c) shows that applying a voltage of U= −0.5V vs. SHE shifts the minimum of G(n;
U) towards more electrons, indicating that the slab becomes more negatively charged.
Thus, although the free energy F(n) appears to be linear in Figure 3(a), the thermodynamically relevant potential G(n; U) or GCP(U) in Figure 3(c) is clearly quadratic.
4. Relationship between grand canonical potential reaction kinetics and Butler-Volmer reaction kinetics
Figure 3. The free energy and grand canonical potential as a function of the number of electrons. The DFT energies are indicated by blue dots, the dashed curve is the polynomial fit. (a) a linear fit to F(n) , (b) a quadratic fit to F(n) – n × μe,SHE , (c) a quadratic fit GCP(n,
U).
Fig 1 (b) shows schematically that as the voltage is changed from U0 to a more negative U1, the negatively charged product becomes more stable, shifting the potential energy surface downward for the species. However, this energy changes as the geometries change along the MEP. Because the reactant has fewer electrons, the stabilization is less effective, resulting in a leftward shift of the transition state towards the reactant. The coordinate along the reaction coordinate changes from R0 to R1 in Figure 1(b). In comparison, for Butler-Volmer kinetics 37-39, only two states are involved, and the shift from R
[image:52.612.197.451.75.455.2]The difference between the grand canonical potential reaction kinetics (GCP-K) and Butler-Volmer kinetics is more obvious for the reaction path in the charge-reaction coordinate or (n, R) plane as shown in Figure 1(c) and 1(d). In the Bulter-Volmer picture, an electron is transferred through tunneling from the electrode to the product, resulting in a discontinuity in the (n, R) plane. However, in extended systems where intermediates are adsorbed on the surface, there can be fractional charges per unit area since electrons are delocalized. As a result, the surface species can charge or discharge continuously, leading to a smooth reaction path in the (n, R) plane, as shown in Figure 1(d). Thus, the Bulter-Volmer picture in the (n, R) plane can be considered as the special case of the GCP-K picture in which the electron transfer takes place instantaneously as in Figure 1(c).
In the GCP-K picture, the reaction path changes continuously in the (n, R) plane. Thus, both the charge n and the spatial reaction coordinate R are relevant coordinates. Because the constant charge free energy F(n) is used to transform to GCP(U), we must prove that the grand canonical potential for the transition state obtained from the constant charge F(n) coincides with the grand canonical potential obtained from constant voltage calculations.
The transition state grand canonical potential GCPTS,n(U) can be found explicitly by transforming FTS(n), where FTS(n) is the barrier for each fixed charge n such that
FTS(n)=maxRF(n,R), with RIS < R < RFS
Then,
GCPTS,n(U) = minR(FTS(n) – ne(USHE – U))
On the other hand, including the spatial dependence in Equation (1), leads to
G(n, R; U) = F(n, R) – ne(USHE−U)
1. F(n, R) is quadratic and thus convex in n, then so is GCP(n, R; U) = F(n, R) – ne(USHE – U),
2. The reaction path is smooth in extended systems since the charges transfer continuously at the electrode. By the definition of the transition state, the reaction path is concave in R in the neighborhood of RTS.
Then,
GCPTS,U(𝑈) = max
𝑅 min𝑛 (GCP(𝑛, 𝑅; 𝑈))
= min
𝑛 max𝑅 (GCP(𝑛, 𝑅; 𝑈))
= min
𝑛 max𝑅 (𝐹(𝑛, 𝑅) − 𝑛𝑒(𝑈𝑆𝐻𝐸− 𝑈))
= min
𝑛 (𝐹TS(𝑛) − 𝑛𝑒(𝑈𝑆𝐻𝐸− 𝑈))
= GCP𝑇𝑆,𝑛(𝑈)
Because the grand canonical potential of the transition state is found by minimization in
n and maximization in R, at the transition state we then have
𝑑 𝑑𝑅
𝑑
𝑑𝑛GCP(𝑛, 𝑅; 𝑈) = 0 (7)
As discussed above, GCP(n, R; U) depends on R and U quadratically around the transition state, the derivatives in n and R reduce the dependence from order 2 to order 1. As a result, Equation (7) implies that RTS(n) depends linearly on n. This linear dependence is shown
Figure 4. The transition states as the system evolves from [MoS2]H to [MoS2]H2. (a): the transition state structure in basic conditions. (b): the transition state structure in acidic conditions. (c): relationships between the transition state charge (n) and spatial coordinates (RTS) in basic conditions. (d): relationships between the transition state charge (n) and spatial coordinates (RTS) in acidic conditions. The linear relationships in (c) and (d) agree with the qualitative picture in Figure 1(d).