www.hydrol-earth-syst-sci.net/18/1605/2014/ doi:10.5194/hess-18-1605-2014
© Author(s) 2014. CC Attribution 3.0 License.
Hydrology and
Earth System
Sciences
Comprehensive evaluation of water resources security in the
Yellow River basin based on a fuzzy multi-attribute decision
analysis approach
K. K. Liu1,2, C. H. Li1, Y. P. Cai3,4, M. Xu1, and X. H. Xia1
1Ministry of Education Key Laboratory of Water and Sediment Sciences, School of Environment, Beijing Normal University, Beijing, 100875, China
2CERI eco Technology Co., LTD, Beijing, 100053, China
3State Key Laboratory of Water Environment Simulation, School of Environment, Beijing Normal University, Beijing, 100875, China
4Institute for Energy, Environment and Sustainable Communities, University of Regina, 120, 2 Research Drive, Regina, Saskatchewan, S4S 7H9, Canada
Correspondence to: C. H. Li ([email protected]) and Y. P. Cai ([email protected])
Received: 9 December 2013 – Published in Hydrol. Earth Syst. Sci. Discuss.: 10 January 2014 Revised: – Accepted: 12 March 2014 – Published: 7 May 2014
Abstract. In this paper, a fuzzy multi-attribute decision
anal-ysis approach (FMADAA) was developed for supporting the evaluation of water resources security in nine provinces within the Yellow River basin. A numerical approximation system and a modified left–right scoring approach were adopted to cope with the uncertainties in the acquired in-formation. Also, four conventional multi-attribute decision analysis (MADA) methods were implemented in the evalua-tion model for impact evaluaevalua-tion, including simple weighted addition (SWA), weighted product (WP), cooperative game theory (CGT) and technique for order preference by simi-larity to ideal solution (TOPSIS). Moreover, several aggre-gation methods including average ranking procedure, Borda and Copeland methods were used to integrate the ranking re-sults, helping rank the water resources security in those nine provinces as well as improving reliability of evaluation re-sults. The ranking results showed that the water resources security of the entire basin was in critical condition, includ-ing the insecurity and absolute insecurity states, especially in Shanxi, Inner Mongolia and Ningxia provinces in which wa-ter resources were lower than the average quantity in China. Hence, the improvement of water eco-environment statuses in the above-mentioned provinces should be prioritized in the future planning of the Yellow River basin.
1 Introduction
Water is a fundamental resource for sustainable development of human society. Also, it is a critical factor for maintain-ing natural ecosystems. Water conflicts between human and ecosystems are posing great challenges for maintaining sus-tainability of water resources at the watershed scale. Along with the increasing consumptions of water resources by mul-tiple users, water security crisis becomes an emerging issue that is facing decision-makers in many regions. How can the water resources be effectively allocated among the multiple water users without causing damages on local ecosystems? A balance between human beings and ecosystems needs to be maintained based on the introduction of water security not only for human society but also for local ecosystems. The development of an effective method is thus desired to help evaluate water security and facilitate the management of water resources scarcity (Brown and Hilweil, 1987; Loucks, 2000; WWAP, 2002; Chen, 2004; Zhang, 2010).
environment on the basis of not exceeding the carrying ca-pacity of water resources and water eco-environment. This implies the desire to safeguard sustainable economic and so-cial development based on sustainable water resources uti-lization. The evaluation and insurance of water security are the core issues of sustainable water resources management. Conventionally, water resources supporting capacity is con-sidered as a basic water security measure which can be adopted for supporting the establishment of an evaluation– indicator system. At the same time, some scholars argue that water resources security’s core point lies in the sustainability of water use. If water resources in a region can be used sus-tainably, then, its water can be considered safe. According to this theory, the indicator system can be established including targets, criteria and indicators. The evaluation can be carried on in accordance with the indicators in five aspects including water resources availabilities, water resources exploitation and utilization efficiencies, external eco-environment condi-tions, water resources deployment condicondi-tions, and ability in managing water resources (Jia and Zhang, 2003; Zhang and Jia, 2003; Jia et al., 2004; Zhang et al., 2005, 2008).
At the same time, many evaluation methods were devel-oped for evaluating water resources sustainability, such as those based on statistic analysis, data envelopment analy-sis, principal components analyanaly-sis, system dynamics method, “pressure–state–response” modeling, set pair analysis, vague set evaluation, fuzzy element model, water-poor exponential method, artificial neural networks, element analysis and so forth. Many scholars have applied these methods to many real-world cases (Han et al., 2001; Cong, 2007; Zhu et al., 2008). Because the uncertain factors in the indicator system have great influences on the scientificity of evaluation, in or-der to deal with non-linear optimization of the evaluation process, the expression of implicit functions, fuzzy and ran-dom problems, the uncertainty evaluation methods and intel-ligent methods of integrated assessment methods gradually emerged. Among those methods, fuzzy multi-attribute deci-sion analysis approach (FMADAA) was one of the effective methods for multiple-criteria decision support. For example, it was adopted in a landfill selection problem in the city of Regina and was considered as a powerful tool for decision analysis. More recently, it has been rapidly developed in nu-merous fields such as management, engineering, and so on (Buede, 1996; Eom, 1999; Yu et al., 2004; Cai et al., 2009; Parviz and Saeed, 2010; George and Mike, 2011; Harrison et al., 2011; Ana et al., 2012).
In the last two decades, the amount of water resources has decreased significantly in the Yellow River basin of China. The problem of water shortage has become extremely se-rious (Li et al., 2004; Shen and Li, 2009; Li and Yang, 2004). Besides, water supply can not sufficiently meet the needs of industry, agriculture, residential and ecological sec-tors, which has made water security a particularly prominent problem affecting the economical and social development in the basin. In recent years, many scholars put their effort on
the calculation of the supplied water quantity and require-ment in order to analyze water utilization and water alloca-tion (Xia et al., 2009) in order to provide support for water resources management in the Yellow River basin. However, a few researchers have carried out comprehensive water se-curity evaluation in the Yellow River basin, especially in the analysis on the regional differences of the entire basin, which is important to the management in the basin. Therefore, the security evaluation in administrative regions of the basin is extremely necessary in order to promote the overall water resources security and to guarantee the coordinated develop-ment in the basin.
Since MADA aims to identify optimal alternatives for decision-makers, it is effective in supporting relevant decision-making processes. That is to say, various alterna-tives can be ranked according to certain criteria. Each region of the Yellow River basin can be considered as an alternative and each evaluation method can be considered as a criterion or an attribute. Also, in order to reflect uncertainties associ-ated with the process, FMADAA needs to be adopted. It is suitable for evaluating water resources security in the Yel-low River basin. Moreover, since the ranking results of dif-ferent methods are inconsistent in practical application, the results will also be integrated, which could enhance appli-cability and accuracy of the results. In addition, fuzzy infor-mation usually encountered in practical evaluation processes can also be dealt with. Therefore, in the paper, we will adopt FMADAA to carry on the water resources security evalua-tion in the Yellow River basin in order to provide support for water management in the basin.
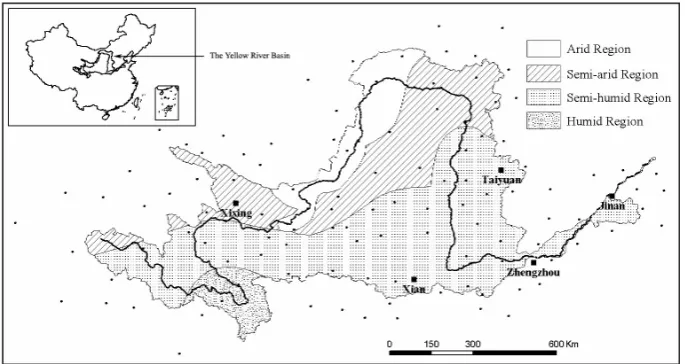
2 Overview of the Yellow River basin
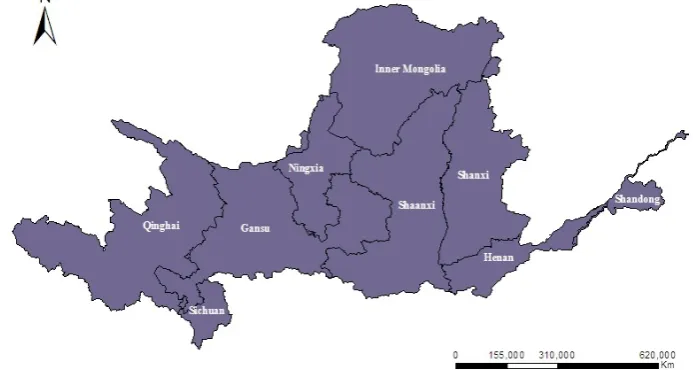
Fig. 1. The Yellow River basin.
Considering the data availability, we selected 2006 to be the evaluation year to analyze the current situation of water resources security in the Yellow River basin. Meanwhile, the data are derived from “Comprehensive Planning in the Yel-low River Basin” (YelYel-low River Conservancy Committee of the Ministry of Water Resources, YRCC, MWR, 2009), “Wa-ter Resources Comprehensive Planning in the Yellow River Basin” (Yellow River Conservancy Committee of the Min-istry of Water Resources, YRCC, MWR, 2009), related ma-terials and statistical yearbook of the Yellow River (Yellow River Conservancy Committee of the Ministry of Water Re-sources, YRCC, MWR, 2006).
3 Development of a water security evaluation system
3.1 Evaluation indicators
We established the “pressure–state–response” water re-sources security evaluation model system which covered the indicators reflecting the water security situation in the Yel-low River basin. “Pressure” system refers to those resources and social and economic factors which may cause pressure on the system, where the indicators are the decisive factors of the security of system. “State” system is the system sta-tus under the action of resources and social and economic indicators. “Response” system refers to the sensitivity and adaptability of the system to the actions of resources and so-cial and economic indicators as well as the various measures taken to decrease the aggravation of water resources security. Each sub-system is established from three aspects, including water resources, socio-economic and water environment (Jia et al., 2002).
The indicator selection methods used in this paper con-tain a frequency statistical method, theoretical analysis and expert consultation (Delphi method). Based on the feedback
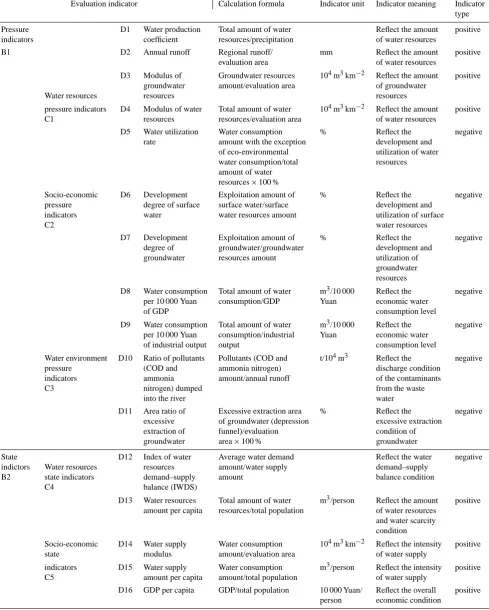
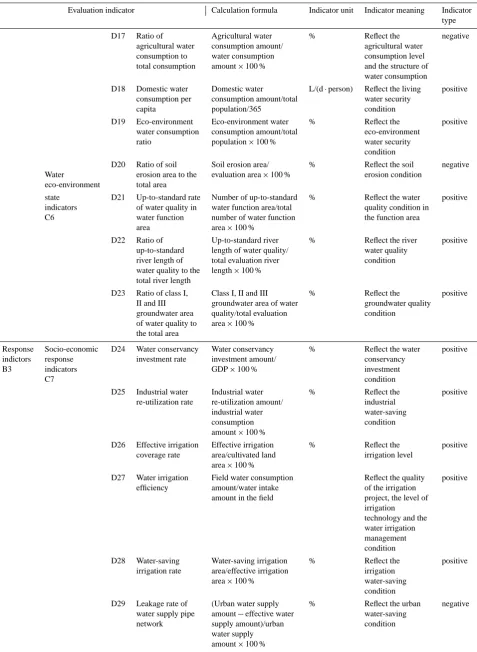
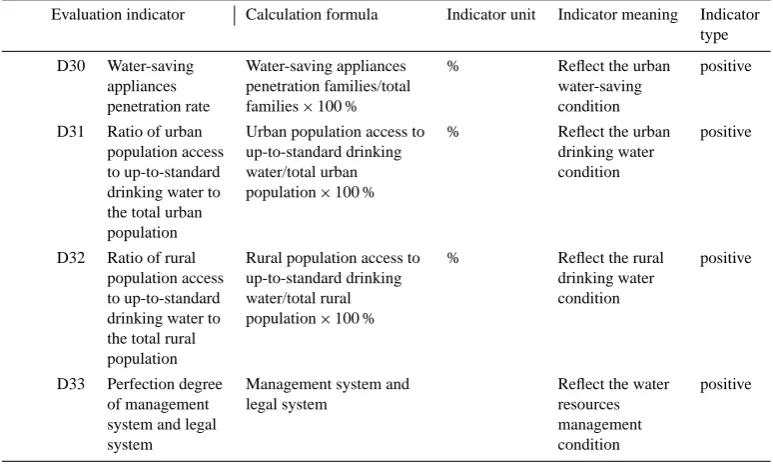
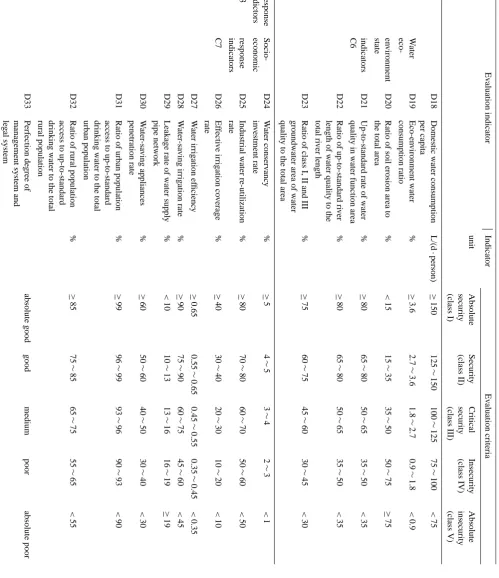
from experts, a fuzzy analytic hierarchy process (FAHP) is adopted as the system analysis method to determine the water security evaluation indicator system (Zhang, 2000). Hence, the indicator system can be established, with the connota-tions and calculaconnota-tions of indicators shown in Table 1.
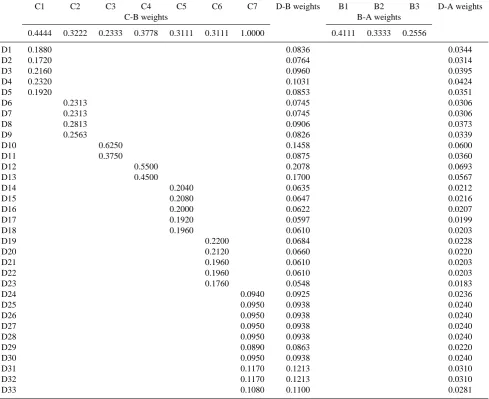
The evaluation criteria of the Yellow River basin has only a relative sense; we took the national data as a benchmark to set the evaluation criteria. The main references for determin-ing the criteria mainly include the statistical data, relevant standards, norms, procedures, development plan, existing re-search results and so forth. In this paper, five interval eval-uation criteria have been formulated, followed by absolute security, security, critical security, insecurity and absolute in-security. Based on the evaluation criteria, the standards of the evaluation system were determined, which are shown in Ta-ble 2. A fuzzy analytic hierarchy process (FAHP) is adopted to determine the weights of indicators, and the calculation steps are the same as in the establishment of the water re-sources security evaluation indicator system. The weights of indicators were also obtained, which are shown in Table 3.
3.2 Fuzzy multi-attribute decision analysis approach
Table 1. Water resources security evaluation indicator.
Evaluation indicator Calculation formula Indicator unit Indicator meaning Indicator type
Pressure D1 Water production Total amount of water Reflect the amount positive
indicators coefficient resources/precipitation of water resources
B1 D2 Annual runoff Regional runoff/ mm Reflect the amount positive
evaluation area of water resources
D3 Modulus of Groundwater resources 104m3km−2 Reflect the amount positive
groundwater amount/evaluation area of groundwater
Water resources resources resources
pressure indicators D4 Modulus of water Total amount of water 104m3km−2 Reflect the amount positive
C1 resources resources/evaluation area of water resources
D5 Water utilization Water consumption % Reflect the negative
rate amount with the exception development and
of eco-environmental utilization of water
water consumption/total resources
amount of water resources×100 %
Socio-economic D6 Development Exploitation amount of % Reflect the negative
pressure degree of surface surface water/surface development and
indicators water water resources amount utilization of surface
C2 water resources
D7 Development Exploitation amount of % Reflect the negative
degree of groundwater/groundwater development and
groundwater resources amount utilization of
groundwater resources
D8 Water consumption Total amount of water m3/10 000 Reflect the negative
per 10 000 Yuan consumption/GDP Yuan economic water
of GDP consumption level
D9 Water consumption Total amount of water m3/10 000 Reflect the negative per 10 000 Yuan consumption/industrial Yuan economic water
of industrial output output consumption level
Water environment D10 Ratio of pollutants Pollutants (COD and t/104m3 Reflect the negative
pressure (COD and ammonia nitrogen) discharge condition
indicators ammonia amount/annual runoff of the contaminants
C3 nitrogen) dumped from the waste
into the river water
D11 Area ratio of Excessive extraction area % Reflect the negative
excessive of groundwater (depression excessive extraction
extraction of funnel)/evaluation condition of
groundwater area×100 % groundwater
State D12 Index of water Average water demand Reflect the water negative
indictors Water resources resources amount/water supply demand–supply
B2 state indicators demand–supply amount balance condition
C4 balance (IWDS)
D13 Water resources Total amount of water m3/person Reflect the amount positive amount per capita resources/total population of water resources
and water scarcity condition
Socio-economic D14 Water supply Water consumption 104m3km−2 Reflect the intensity positive
state modulus amount/evaluation area of water supply
indicators D15 Water supply Water consumption m3/person Reflect the intensity positive
C5 amount per capita amount/total population of water supply
Table 1. Continued.
Evaluation indicator Calculation formula Indicator unit Indicator meaning Indicator type
D17 Ratio of Agricultural water % Reflect the negative
agricultural water consumption amount/ agricultural water
consumption to water consumption consumption level
total consumption amount×100 % and the structure of
water consumption
D18 Domestic water Domestic water L/(d·person) Reflect the living positive consumption per consumption amount/total water security
capita population/365 condition
D19 Eco-environment Eco-environment water % Reflect the positive
water consumption consumption amount/total eco-environment
ratio population×100 % water security
condition
D20 Ratio of soil Soil erosion area/ % Reflect the soil negative
Water erosion area to the evaluation area×100 % erosion condition
eco-environment total area
state D21 Up-to-standard rate Number of up-to-standard % Reflect the water positive indicators of water quality in water function area/total quality condition in
C6 water function number of water function the function area
area area×100 %
D22 Ratio of Up-to-standard river % Reflect the river positive
up-to-standard length of water quality/ water quality
river length of total evaluation river condition
water quality to the length×100 % total river length
D23 Ratio of class I, Class I, II and III % Reflect the positive
II and III groundwater area of water groundwater quality
groundwater area quality/total evaluation condition of water quality to area×100 %
the total area
Response Socio-economic D24 Water conservancy Water conservancy % Reflect the water positive
indictors response investment rate investment amount/ conservancy
B3 indicators GDP×100 % investment
C7 condition
D25 Industrial water Industrial water % Reflect the positive
re-utilization rate re-utilization amount/ industrial
industrial water water-saving
consumption condition
amount×100 %
D26 Effective irrigation Effective irrigation % Reflect the positive
coverage rate area/cultivated land irrigation level
area×100 %
D27 Water irrigation Field water consumption Reflect the quality positive
efficiency amount/water intake of the irrigation
amount in the field project, the level of
irrigation technology and the water irrigation management condition
D28 Water-saving Water-saving irrigation % Reflect the positive
irrigation rate area/effective irrigation irrigation
area×100 % water-saving
condition
D29 Leakage rate of (Urban water supply % Reflect the urban negative
water supply pipe amount−effective water water-saving
network supply amount)/urban condition
Table 1. Continued.
Evaluation indicator Calculation formula Indicator unit Indicator meaning Indicator type
D30 Water-saving Water-saving appliances % Reflect the urban positive
appliances penetration families/total water-saving
penetration rate families×100 % condition
D31 Ratio of urban Urban population access to % Reflect the urban positive population access up-to-standard drinking drinking water
to up-to-standard water/total urban condition
drinking water to population×100 % the total urban
population
D32 Ratio of rural Rural population access to % Reflect the rural positive population access up-to-standard drinking drinking water
to up-to-standard water/total rural condition
drinking water to population×100 % the total rural
population
D33 Perfection degree Management system and Reflect the water positive
of management legal system resources
system and legal management
system condition
MADM methods are inconsistent, a further aggregation is needed.
In this paper, nine provinces in the Yellow River basin and evaluation criteria constituted the alternatives. Then the numerical approximation system and the modified left–right scoring approach were adopted to cope with the uncer-tainties in the acquired information. Four commonly used multi-attribute decision-making (MADM) methods were im-plemented in the evaluation model for impact evaluation, including the simple weighted addition (SWA) method, weighted product (WP) method, cooperative game theory (CGT) method and technique for order preference by sim-ilarity to ideal solution (TOPSIS) method. These MADM methods helped to rank the nine provinces and the criteria alternatives, and three aggregation methods, including aver-age ranking procedure, Borda and Copeland methods, were used to integrate the ranking results. The details of the four phases are listed below.
3.2.1 Alternatives establishment
First, the alternatives to be ranked in the MADM methods should be fixed. In this paper, the nine provinces in the Yel-low River basin were considered to be the nine alternatives (see Fig. 2). Because the MADM method adopted in this pa-per is aimed to evaluate the water resources security of the Yellow River basin, the evaluation criteria should also be transformed into different alternatives in order to be com-pared with the security of the basin. Therefore, 13 criteria alternativesAa,Ab,Ac,Ad,Ae,Af,Ag,Ah,Ai,Aj,Ak,Al
andAmwere obtained here, among whichAa,Ae,AiandAm
are critical values of the 5 interval criteria. In addition, three criteria alternatives were added betweenAaandAe,Aeand
Ai, as well asAiandAm, respectively. It is worth noting that
the criteria alternatives can be selected according to different conditions or different evaluation purposes.
3.2.2 Fuzzy impact transformation
(a) Linguistic-term conversion
A numerical approximation system is proposed by Hwang and Chen (1992) to systematically transform linguistic terms to their corresponding fuzzy sets. According to Hwang, the transformation requires eight conversion scales. The conver-sion scales are proposed by synthesizing and modifying the work of Baas and Kwakemaak (1977), Bonissone (1982) and Chen (1988). It is assumed that the given figures can ade-quately cover all expressions of any specific feature –“high” vs. “low”. One of the figures is employed when certain terms are provided and the principle is to simply select a scale fig-ure that contains all the verbal terms given by the decision-maker and use the membership function set for that figure to represent the meaning of the verbal terms. For example, if the given certain terms include “low”, “medium” and “high”, the scale shown in Fig. 3 is to be selected.
(b) Conversion from fuzzy sets to crisp values
Table 3. Weights of water resources security evaluation indicator.
C1 C2 C3 C4 C5 C6 C7 D-B weights B1 B2 B3 D-A weights
C-B weights B-A weights
0.4444 0.3222 0.2333 0.3778 0.3111 0.3111 1.0000 0.4111 0.3333 0.2556
D1 0.1880 0.0836 0.0344
D2 0.1720 0.0764 0.0314
D3 0.2160 0.0960 0.0395
D4 0.2320 0.1031 0.0424
D5 0.1920 0.0853 0.0351
D6 0.2313 0.0745 0.0306
D7 0.2313 0.0745 0.0306
D8 0.2813 0.0906 0.0373
D9 0.2563 0.0826 0.0339
D10 0.6250 0.1458 0.0600
D11 0.3750 0.0875 0.0360
D12 0.5500 0.2078 0.0693
D13 0.4500 0.1700 0.0567
D14 0.2040 0.0635 0.0212
D15 0.2080 0.0647 0.0216
D16 0.2000 0.0622 0.0207
D17 0.1920 0.0597 0.0199
D18 0.1960 0.0610 0.0203
D19 0.2200 0.0684 0.0228
D20 0.2120 0.0660 0.0220
D21 0.1960 0.0610 0.0203
D22 0.1960 0.0610 0.0203
D23 0.1760 0.0548 0.0183
D24 0.0940 0.0925 0.0236
D25 0.0950 0.0938 0.0240
D26 0.0950 0.0938 0.0240
D27 0.0950 0.0938 0.0240
D28 0.0950 0.0938 0.0240
D29 0.0890 0.0863 0.0220
D30 0.0950 0.0938 0.0240
D31 0.1170 0.1213 0.0310
D32 0.1170 0.1213 0.0310
D33 0.1080 0.1100 0.0281
max) and a minimizing fuzzy set (fuzzy min) (Hwang and Chen, 1992). These two fuzzy sets are defined as
µmax(x)=
x,0 ≤x ≤ 1
0,otherwise (1)
µmin(x)=
1−x, 0 ≤x ≤ 1
0,otherwise . (2)
The right score refers to the intersections of the fuzzy setM with max. The right score ofMcan be determined using (see Fig. 3)
µR(M)=supx[µM(x)∧µmax(x)]. (3)
Similarly, the left score ofMcan be determined using µL(M)=supx[µM(x)∧µmin(x)]. (4)
Given the left and right scores ofM, the total score ofMcan be calculated using
µT(M)=[µR(M)+1−µL(M)]/2. (5)
Consequently, the set ofµtotalcan substitute the original lin-guistic terms and impact matrix with only the crisp values that are formed.
3.2.3 Multi-attribute decision-making (MADM) methods
Fig. 2. Administrative regions to be evaluated in the Yellow River basin.
Fig. 3. One scale for the graph of membership function (Hwang and Chen, 1992).
the details of these methods, some basic concepts of decision weight and data normalization should be introduced.
Firstly, almost all MADM problems require information regarding the relative importance of each attribute, including the methods used in the evaluation system here. The relative importance is usually given by a set of weights which are standardized to a sum equal to 1. Weight set is usually repre-sented as follows:
WT =(w1, w2, . . . , wn) (6)
n
X
i=1
wi =1, (7)
wherenrepresents the number of attributes,T represents a set of the traverse form,WT is a set of weights withn at-tributes. The weights can be assigned by different methods (Saaty, 1977; Chu et al., 1979; Nijkamp et al., 1990). In this paper, FAHP is adopted as referred to above.
Then, according to Hwang and Yoon (1981), some meth-ods such as SWA must apply the normalization method to normalize values in the impact matrix so that any effect in-troduced by different measurement units is neutralized. In the evaluation system, two ways of normalization are applied to cope with different MADM methods. The linear normal-ization adopted here is a modified process by Hwang and Yoon (1981). The normalized value rij can be defined as
follows:
for impact value of benefit attributes, rijb =xij
−ximin
xi∗−ximin, (8) for impact values of cost attributes, rijc = x
∗
i −xij
xi∗−ximin, (9) wherexi∗= max
j xij andx
min
i is the least acceptable impact
value of i attribute. The worst outcome of a certain at-tribute impliesrij= 0, while the best outcome impliesrij= 1.
[image:10.595.126.467.287.447.2]attribute by its norm, so that each normalized valuerij can
be calculated as rij =
xij
s
m
P
j=1 xij2
, (10)
wheremis the total number of alternatives. Several MADM methods will be adopted, including:
(a) Simple weighted addition (SWA) method
The SWA method is the simplest MADM method to handle cardinal data (Hwang and Yoon, 1981). Linear transforma-tion is applied, which normalizes the impact matrix, and the utility function can be written as
Uj = n
X
i=1
wirij, j =1,2, . . . , m, (11)
wherewiis the importance weight of the attributes andrijis
the normalized impact matrix. The alternative with the high-est score is the most preferable one. However, since comple-mentarity often exists among attributes, the assumption of preferential independence may be unacceptable, and ignor-ing the dependence among attributes may cause a misleadignor-ing result (Hwang and Chen, 1992).
(b) Weighted product (WP) method
The WP method was introduced long ago (Starr, 1972; Yoon, 1989) and normalization is not necessary (Yoon and Hwang, 1995). Formally, the utility valueUj of each alternative is
given by
Uj = n
Y
i=1
xwijj, j =1,2, . . . , m, (12)
wherewjis the importance weight of theith attribute andxij
is the impact value of thejth alternative. Similarly, the alter-native with the largest utility value is considered the most preferable one to the decision-maker. Theoretically, the util-ity value may become infinite due to the characteristic of multiplication and the distance between the utility values of the most and second most preferable alternatives would be greater than that derived from the SWA method.
(c) Cooperative game theory (CGT)
Developed by Szidarovszky and Yakowitz (1978), and it is described as the hybrid of the WP and TOPSIS method. By using CGT, the decision-maker looks for a solution that would be as far away from the worst solution as possible. Therefore, the safety of the solution is guaranteed. To define a worst solution, one way is to use the worst impact value of each attribute. Given a set of non-dominant alternatives, the set of worst impact value, denoted asA−, is defined as
A−= minjxij|i∈I
, maxjxij
i ∈I
∗
|j
=1,2, · · ·, m} =
x1−, x2−, . . . , x−i , . . . x−n , (13) wherexijis the impact value of attributeiandxi−is
consid-ered as the worst outcome for each attribute. Once the worst solution is defined, the utility valuesUjfor each attribute can
be measured by the following formula (Gershon, 1984):
Uj = n
Y
i=1
xij −xi−
wi
, j =1,2, . . . , m, (14)
wherewi is the importance weight for each attribute. After
calculating the utility values, the most preferable alternative can then be defined as the one with the greatest utility; the re-sult is given by ranking the values in descending order. How-ever, due to the fact that multiplying any value by 0 equals 0, using CGT will automatically screen out all the alternatives that carry at least one worst impact value. Even if those al-ternatives might result in better outcomes (impacts) in other attributes, they still will not be considered.
(d) Technique for order preference by similarity to ideal solution (TOPSIS)
TOPSIS is a technique that was developed by Hwang and Yoon (1981). They explain that a MADM problem may be viewed as a geometric system. The malternatives that are evaluated by n attributes are similar to mpoints in the n -dimensional space. Therefore, the most preferable alterna-tive should satisfy a condition such that it has the “shortest distance” from the positive-ideal solution and the “longest distance” from the negative-ideal solution.
3.2.4 Ranking result aggregation
Due to the different characteristics of the four MADM meth-ods, the outcomes from applying them to solve a decision-making problem might be diverse. If the diversity is small, then the outcome is considered reliable. If the outcomes are inconsistent, further aggregations have to be done. Different approaches of MADM aggregation were adopted in this pa-per, including:
(a) Average ranking procedure
The average ranking procedure is the simplest technique among the three aggregation methods. This technique is based on the concept of statistical calculation and ranks the alternatives according to the average rankings from the MADM methods.
(b) Borda method
defined as the number of “supporting” methods in whichAj
is more preferable thanAj0. Then anN×NmatrixXis
gen-erated such thatxjj0= 1, ifAj receives more votes thanAj0,
xjj0= 0, otherwise.Sjindicates the number of “wins” thatAj
has received against other alternatives and it is calculated by summing thexjj0 in each row of the matrix. Hence, the
alter-native with the highestSjis considered the most preferable.
(c) Copeland method
This is an extension of the Borda method, which is also based on the voting concept. It is believed that the aggregation util-ity ofAj does not only depend on the number of “wins”, but
the number of “losses” also needs to be taken into account. The number of “losses”, denoted asSj0, is used to
compen-sate the utility value ofSj.Sj0 is calculated by summing the
values of each column of the matrix and the aggregation util-ity is simply defined as the difference ofSjfromSj0. As with
the Borda method, the Copeland method ranks the alterna-tives in descending order of their aggregation utilities from largest to smallest. Although using these aggregation meth-ods may still result in inconsistencies among the rankings, some useful patterns can easily be observed by the decision-maker according to the analyzed information.
4 Results
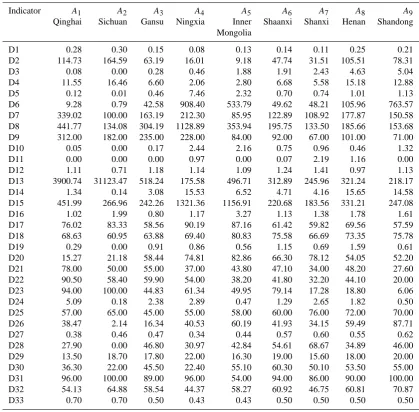
4.1 Indicator value of nine provinces in the Yellow River basin
First, theD33 indicator –“perfection degree of management system and legal system”, which involves the fuzzy data – was transformed into numeric data by applying the con-version scale, including five terms (see Fig. 3). The indi-cator refers to the five terms as “absolute good”, “good”, “medium”, “poor” and “absolute poor”, which correspond to the selected scale involving “high”, “medium high”, “medium”, “medium low” and “low”. Thus, the membership functions ofM1,M2,M3,M4andM5can be presented as µM1(x)= −
1
0.3x +1, 0≤ x ≤0.3 (15)
µM2(x)=
1
0.25x 0≤ x <0.25
− 1.
0.25x+2 0.25≤ x <0.5
, (16)
µM3(x)=
1
0.2x − 3
2 0.3≤x <0.5
− 1
0.2x + 7
2 0.5≤x <0.7
, (17)
µM4(x)=
1
0.25x −2 0.5 ≤x <0.75
− 1
0.25x+4 0.75≤ x <1
, (18)
µM5(x)=
1 0.3x−
7
[image:12.595.350.503.83.160.2]3, 0.75≤ x ≤1. (19)
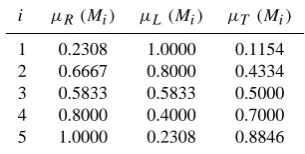
Table 4. Determination ofµtotal.
i µR(Mi) µL(Mi) µT (Mi)
1 0.2308 1.0000 0.1154
2 0.6667 0.8000 0.4334
3 0.5833 0.5833 0.5000
4 0.8000 0.4000 0.7000
5 1.0000 0.2308 0.8846
Using Eqs. (3)–(5), the total utility scores were calcu-lated and the set of µtotal can substitute the original lin-guistic terms, which are shown in Table 4. Hence, “absolute good”, “good”, “medium”, “poor” and “absolute poor” were replaced with the values: 0.8846, 0.7000, 0.5000, 0.4333 and 0.1154.
Water resources security in the Yellow River basin is in the middle and the lower level in China, so there is no need to add the four standard samples (Aa,Ab,AcandAd) in order
to simplify the calculation process. Therefore, 18 alternatives were determined in the evaluation, including the 9 provinces alternatives and 9 criteria alternatives. The values of the 18 alternatives are shown in Tables 5 and 6.
4.2 MADM ranking results
After the evaluation indicator system was established, the values of indicators were normalized by using Eqs. (8)–(9). Hence, the ranking results were obtained under the four MADM methods. By using Eq. (11), the SWA ranking results are Ae/,>Af>Sichuan>Ag>Henan>Ah>Shandong> Qinghai>Ai>Shaanxi>Aj>Gansu>Shanxi>Ak>Inner Mongolia>Al>Am>Ningxia. By using Eq. (12), the WP ranking results are Qinghai>Sichuan >Gansu>Ae>Shandong>Af>Ag>Ah>Inner Mongo-lia>Henan>Shaanxi>Ai>Aj>Ak> Shanxil>Al>Am >Ningxia. It is worth noting that when the negative in-dicator equals 0, its negative power does not make sense. Therefore, in order to rank all the provinces in the basin and the standard alternatives, we used 0.00001 to replace the indicator which equals 0 and the influence on the results can be ignored. By using Eq. (14), the CGT ranking results are Ae>Af>Ag>Ah>Henan>Ai>Aj>Shaanxi>Ak>Al >Gansu>Shandong>Qinghai>Am>Inner Mongolia> Shanxi>Sichuan>Ningxia. Specifically,Uj is 0 when the
Table 5. Indicator value of nine provinces in the water resources security evaluation system in the Yellow River basin.
Indicator A1 A2 A3 A4 A5 A6 A7 A8 A9
Qinghai Sichuan Gansu Ningxia Inner Shaanxi Shanxi Henan Shandong
Mongolia
D1 0.28 0.30 0.15 0.08 0.13 0.14 0.11 0.25 0.21
D2 114.73 164.59 63.19 16.01 9.18 47.74 31.51 105.51 78.31
D3 0.08 0.00 0.28 0.46 1.88 1.91 2.43 4.63 5.04
D4 11.55 16.46 6.60 2.06 2.80 6.68 5.58 15.18 12.88
D5 0.12 0.01 0.46 7.46 2.32 0.70 0.74 1.01 1.13
D6 9.28 0.79 42.58 908.40 533.79 49.62 48.21 105.96 763.57
D7 339.02 100.00 163.19 212.30 85.95 122.89 108.92 177.87 150.58
D8 441.77 134.08 304.19 1128.89 353.94 195.75 133.50 185.66 153.68
D9 312.00 182.00 235.00 228.00 84.00 92.00 67.00 101.00 71.00
D10 0.05 0.00 0.17 2.44 2.16 0.75 0.96 0.46 1.32
D11 0.00 0.00 0.00 0.97 0.00 0.07 2.19 1.16 0.00
D12 1.11 0.71 1.18 1.14 1.09 1.24 1.41 0.97 1.13
D13 3900.74 31123.47 518.24 175.58 496.71 312.89 245.96 321.24 218.17
D14 1.34 0.14 3.08 15.53 6.52 4.71 4.16 15.65 14.58
D15 451.99 266.96 242.26 1321.36 1156.91 220.68 183.56 331.21 247.08
D16 1.02 1.99 0.80 1.17 3.27 1.13 1.38 1.78 1.61
D17 76.02 83.33 58.56 90.19 87.16 61.42 59.82 69.56 57.59
D18 68.63 60.95 63.88 69.40 80.83 75.58 66.69 73.35 75.78
D19 0.29 0.00 0.91 0.86 0.56 1.15 0.69 1.59 0.61
D20 15.27 21.18 58.44 74.81 82.86 66.30 78.12 54.05 52.20
D21 78.00 50.00 55.00 37.00 43.80 47.10 34.00 48.20 27.60
D22 90.50 58.40 59.90 54.00 38.20 41.80 32.20 44.10 20.00
D23 94.00 100.00 44.83 61.34 49.95 79.14 17.28 18.80 6.06
D24 5.09 0.18 2.38 2.89 0.47 1.29 2.65 1.82 0.50
D25 57.00 65.00 45.00 55.00 58.00 60.00 76.00 72.00 70.00
D26 38.47 2.14 16.34 40.53 60.19 41.93 34.15 59.49 87.71
D27 0.38 0.46 0.47 0.34 0.44 0.57 0.60 0.55 0.62
D28 27.90 0.00 46.80 30.97 42.84 54.61 68.67 34.89 46.00
D29 13.50 18.70 17.80 22.00 16.30 19.00 15.60 18.00 20.00
D30 36.30 22.00 45.50 22.40 55.10 60.30 50.10 53.50 55.00
D31 96.00 100.00 89.00 96.00 54.00 94.00 86.00 90.00 100.00
D32 54.13 64.88 58.54 44.37 58.27 60.92 46.75 60.81 70.87
D33 0.70 0.70 0.50 0.43 0.43 0.50 0.50 0.50 0.50
4.3 MADM aggregation results
The alternatives were ranked according to the mean rankings from the four MADM methods, which are shown in Table 7. According to average ranking procedure, the fi-nal ranking order is Ae>Af>Ag>Sichuan>Ah, Henan>Qinghai>Shandong>Gansu>Shaanxi>Ai>Aj >Ak>Inner Mongolia>Shanxi>Al>Am>Ningxia. According to Borda, each pair of alternatives were compared separately and the N×N matrix X was formed, which is shown in Table 8. Accord-ing to the value of Sj, the final ranking order is
Ae>Af>Sichuan>Ag>Ah, Henan>Qinghai>Shaanxi, Shandong>Ai, Gansu>Aj>Ak>Shanxi, and Inner Mongolia>Al>Am>Ningxia. For the Copeland method, according to the value ofSj−Sj0, the final ranking order is
Ae>Af, Sichuan>Ag>Qinghai>Ah, Henan>Shaanxi,
Shandong>Ai, Gansu>Aj>Ak>Shanxi>Inner Mongo-lia>Al>Am>Ningxia.
Based on the ranking results of the three aggregation methods, the water resources security degrees of the nine provinces in the Yellow River basin are shown in Ta-ble 9. Copeland aggregation results are shown in Fig. 4 and Table 10.
Among the nine provinces in the Yellow River basin, water resources security evaluation conditions are relatively poor in Shanxi, Inner Mongolia and Ningxia province. Ranking results of the 33 indicator values are included in Table 11.
5 Discussions
Table 6. Indicator value of nine standards in the water resources security evaluation system in the Yellow River basin.
Indicator Ae Af Ag Ah Ai Aj Ak Al Am
D1 0.22 0.21 0.20 0.18 0.17 0.16 0.15 0.13 0.12
D2 80.00 71.25 62.50 53.75 45.00 36.25 27.50 18.75 10.00
D3 4.00 3.63 3.25 2.88 2.50 2.13 1.75 1.38 1.00
D4 35.00 31.25 27.50 23.75 20.00 16.25 12.50 8.75 5.00
D5 2.00 2.25 2.50 2.75 3.00 3.25 3.50 3.75 4.00
D6 50.00 55.00 60.00 65.00 70.00 75.00 80.00 85.00 90.00
D7 50.00 55.00 60.00 65.00 70.00 75.00 80.00 85.00 90.00
D8 200.00 220.00 240.00 260.00 280.00 300.00 320.00 340.00 360.00
D9 65.00 71.25 77.50 83.75 90.00 96.25 102.50 108.75 115.00
D10 0.90 1.00 1.10 1.20 1.30 1.40 1.50 1.60 1.70
D11 0.80 0.85 0.90 0.95 1.00 1.05 1.10 1.15 1.20
D12 1.00 1.05 1.10 1.15 1.20 1.25 1.30 1.35 1.40
D13 750.00 712.50 675.00 637.50 600.00 562.50 525.00 487.50 450.00
D14 12.00 11.00 10.00 9.00 8.00 7.00 6.00 5.00 4.00
D15 600.00 550.00 500.00 450.00 400.00 350.00 300.00 250.00 200.00
D16 1.80 1.75 1.70 1.65 1.60 1.55 1.50 1.45 1.40
D17 65.00 67.50 70.00 72.50 75.00 77.50 80.00 82.50 85.00
D18 125.00 118.75 112.50 106.25 100.00 93.75 87.50 81.25 75.00
D19 2.70 2.48 2.25 2.03 1.80 1.58 1.35 1.13 0.90
D20 35.00 40.00 45.00 50.00 55.00 60.00 65.00 70.00 75.00
D21 65.00 61.25 57.50 53.75 50.00 46.25 42.50 38.75 35.00
D22 65.00 61.25 57.50 53.75 50.00 46.25 42.50 38.75 35.00
D23 60.00 56.25 52.50 48.75 45.00 41.25 37.50 33.75 30.00
D24 4.00 3.75 3.50 3.25 3.00 2.75 2.50 2.25 2.00
D25 75.00 72.50 70.00 67.50 65.00 62.50 60.00 57.50 55.00
D26 70.00 67.50 65.00 62.50 60.00 57.50 55.00 52.50 50.00
D27 0.55 0.53 0.50 0.48 0.45 0.43 0.40 0.38 0.35
D28 75.00 71.25 67.50 63.75 60.00 56.25 52.50 48.75 45.00
D29 13.00 13.75 14.50 15.25 16.00 16.75 17.50 18.25 19.00
D30 55.00 52.50 50.00 47.50 45.00 42.50 40.00 37.50 35.00
D31 96.00 95.25 94.50 93.75 93.00 92.25 91.50 90.75 90.00
D32 75.00 72.50 70.00 67.50 65.00 62.50 60.00 57.50 55.00
D33 0.70 0.50 0.50 0.50 0.43 0.43 0.43 0.12 0.12
This is because CGT will automatically rule out (or shrink) all the alternatives that contain at least one minimum indica-tor value of the worst sample although the other indicaindica-tors are at a higher level in the whole basin. For example, wa-ter resources amount is abundant in Sichuan province, and many indicators of the evaluation system are better than the other provinces. However, the three indicator values are 0, in-cluding modulus of groundwater resources, eco-environment water consumption ratio and water-saving irrigation rate, which decreases overall water resources security in Sichuan province.
From Table 9, it can be seen that the ranking order is differ-ent from Borda and Copeland. This is because in FMADAA, four MADM methods’ impacts on the results of average ranking procedure methods are the same, since they are determined by the mean rankings. Hence, we can see that compared with the Copeland aggregation method, the water resources security condition in Henan province is better than in Qinghai province, which is influenced by the results of the
CGT method. Meanwhile, the condition in Gansu province is better than that in Shaanxi province and the Ai standard alter-native because of the impact by the results of the WP method. We can also see that the results of Copeland are a little differ-ent from the Borda method as well because it considers both the “wins” and “losses” of the alternatives.
Although the results of the three aggregation methods are not exactly consistent, some certain and useful in-formation can be obtained, such as the ranking order: Ae>Af, Sichuan, Ag>Ah, Qinghai, Henan>Ai, Shan-dong, Shaanxi, Gansu>Aj>Ak>Shanxi, Inner Mongo-lia>Al>Am>Ningxia. The water resources security in these provinces is in a critical state, including Sichuan, Qing-hai and Henan. Shanxi and Inner Mongolia are in the inse-curity state. Meanwhile, Ningxia province is in the absolute insecurity state. Shandong, Shaanxi and Gansu provinces are in the critical or insecurity state.
Fig. 4. Copeland aggregation results in the nine provinces.
Table 7. Summary of indicator values in average ranking procedure.
MADM methods Mean
M1 M2 M3 M4 rankings
A1Qinghai 11 18 6 15 12.50
A2Sichuan 16 17 2 18 13.25
A3Gansu 7 16 8 10 10.25
A4Ningxia 1 1 1 1 1.00
A5Inner Mongolia 4 10 4 4 5.50
A6Shaanxi 9 8 11 11 9.75
A7Shanxi 6 4 3 7 5.00
A8Henan 14 9 14 14 12.75
A9Shandong 12 14 7 9 10.50
Ae 18 15 18 17 17.00
Af 17 13 17 16 15.75
Ag 15 12 16 13 14.00
Ah 13 11 15 12 12.75
Ai 10 7 13 8 9.50
Aj 8 6 12 6 8.00
Ak 5 5 10 5 6.25
Al 3 3 9 3 4.50
Am 2 2 5 2 2.75
rule out the influence of the large difference of evalua-tion results between one MADM method and the others. Besides, it considers both the “wins” and “losses” of the alternatives, so to some extent, it is more reasonable. The ranking order by using the Copeland method is Ae>Af, Sichuan>Ag>Qinghai>Ah, Henan>Shaanxi, Shan-dong>Ai, Gansu>Aj>Ak>Shanxi>Inner Mongolia >Al>Am>Ningxia. From the results shown in Fig. 4 and Table 10, we can see that the water resources security of the whole basin is in critical, insecurity and absolute insecurity states, which is at the lower level in China. The provinces
whose water resources security is in a critical state include Sichuan, Qinghai, Henan, Shanxi, Shandong and Gansu. Shanxi and Inner Mongolia are in the insecurity state. Meanwhile, Ningxia province is in the absolute insecurity state.
For the regional distribution, we can see that water re-sources security of the provinces located upstream of the Yel-low River is better than the other provinces such as Qinghai and Sichuan province. The southern provinces are better than the northern provinces such as Sichuan province. Meanwhile, the developed provinces are better than the other provinces such as Sichuan, Shandong and Henan province. This is be-cause the amount of water resources that is relatively abun-dant in the upstream and the values of socio-economic-related indicators are higher in the developed provinces, which enhance its whole water resources security.
Table 8.N×Nmatrix used in the Borda and Copeland methods.
A2 A3 A4 A5 A6 A7 A8 A9 Ae Af Ag Ah Ai Aj Ak Al Am Sj
A1 0 0 1 1 1 1 1 0 0 0 0 0 0 1 1 1 1 1 10
A2 0 0 1 1 1 1 1 1 1 0 0 1 1 1 1 1 1 1 14
A3 0 0 0 1 1 0 1 0 1 0 0 0 0 0 0 1 1 1 7
A4 0 0 0 0 0 0 0 0 0 0 0 0 0 0 0 0 0 0 0
A5 0 0 0 1 0 0 0 0 0 0 0 0 0 0 0 0 1 1 3
A6 0 0 1 1 1 0 1 0 0 0 0 0 0 0 1 1 1 1 8
A7 0 0 0 1 0 0 0 0 0 0 0 0 0 0 0 0 1 1 3
A8 0 0 1 1 1 1 1 0 1 0 0 0 0 1 1 1 1 1 11
A9 0 0 0 1 1 0 1 0 0 0 0 0 0 1 1 1 1 1 8
Ae 1 0 1 1 1 1 1 1 1 0 1 1 1 1 1 1 1 1 16
Af 1 0 1 1 1 1 1 1 1 0 0 1 1 1 1 1 1 1 15
Ag 0 0 1 1 1 1 1 1 1 0 0 0 1 1 1 1 1 1 13
Ah 0 0 1 1 1 1 1 0 1 0 0 0 0 1 1 1 1 1 11
Ai 0 0 0 1 1 0 1 0 0 0 0 0 0 0 1 1 1 1 7
Aj 0 0 0 1 1 0 1 0 0 0 0 0 0 0 0 1 1 1 6
Ak 0 0 0 1 1 0 0 0 0 0 0 0 0 0 0 0 1 1 4
Al 0 0 0 1 0 0 0 0 0 0 0 0 0 0 0 0 0 1 2
Am 0 0 0 1 0 0 0 0 0 0 0 0 0 0 0 0 0 0 1
S0j 2 0 8 17 13 7 12 4 7 0 1 3 4 8 10 12 15 16 Sj−Sj0 8 14 −1 −17 −10 1 −9 7 1 16 14 10 7 −1 −4 −8 −13 −15
resources, socio-economic, and water environment system and backward socio-economic responses.
Therefore, the future planning of the Yellow River basin should focus on soil erosion management, and improvement of water quality in water function areas, rivers and ground-water in order to improve the ground-water eco-environment sta-tus in Shanxi and Inner Mongolia province. Meanwhile, the water utilization efficiency should be improved so that the socio-economic pressure is decreased and water manage-ment should be enhanced, such as increasing the water con-servancy investment, industrial and agricultural water-saving intensity and the rural population access to up-to-standard drinking water. In addition, it is also important to raise the water supply capacity in Shanxi province in order to improve the water resources status as well as to enhance the control of sewage disposal in Ningxia province so that the water en-vironment pressure can be decreased.
In summary, FMADAA can be successfully applied in wa-ter resources security evaluation in the Yellow River basin because it is a combination of fuzzy and different MADM methods; it also aggregates various results of MADM meth-ods, which can provide a more rational result. In addition, the system can also deal with fuzzy information usually encoun-tered in practical evaluation processes. The ranking results showed that the water resources security of the whole Yel-low River basin is in critical, insecurity and absolute insecu-rity states, which is at the lower level in China, especially in Shanxi, Inner Mongolia and Ningxia provinces, whose wa-ter resources are in insecurity and absolute insecurity states. Hence, future planning of the Yellow River basin should
focus on these three provinces in order to promote the overall water resources security and to guarantee coordinated devel-opment in the basin.
6 Conclusions
Table 9. Evaluation level of water resources security by three MADM aggregation methods in nine provinces in 2006.
Absolute Security Critical security Insecurity Absolute
security insecurity
Aa Ab Ac Ad Ae Af Ag Ah Ai Aj Ak Al Am
(a) Average ranking procedure method
Qinghai √
Sichuan √
Gansu √
Ningxia √
Inner Mongolia √
Shaanxi √
Shanxi √
Henan √
Shandong √
(b) Borda method
Qinghai √
Sichuan √
Gansu √
Ningxia √
Inner Mongolia √
Shaanxi √
Shanxi √
Henan √
Shandong √
(c) Copeland method
Qinghai √
Sichuan √
Gansu √
Ningxia √
Inner Mongolia √
Shaanxi √
Shanxi √
Henan √
[image:17.595.140.456.608.693.2]Shandong √
Table 10. Water resources security levels in administrative regions in the Yellow River basin under the Copeland aggregation method (in 2006).
Security level
Absolute Security Critical security Insecurity Absolute
security insecurity
Provinces Sichuan, Qinghai, Shanxi and Ningxia
Henan, Shaanxi and Inner
Table 11. Ranking results of indicator values in Shanxi, Inner Mongolia and Ningxia provinces.
Evaluation indicator Shanxi Inner Ningxia
Mongolia
Pressure Water D1 Water production coefficient 8 7 9
indictors resources D2 Annual runoff 7 9 8
B1 pressure D3 Modulus of groundwater resources 3 5 6
indicators D4 Modulus of water resources 7 8 9
C1 D5 Utilization rate 5 8 9
Socio- D6 Development degree of surface water 4 7 9
economic D7 Development degree of groundwater 1 3 8
pressure D8 Water consumption per 10 000 Yuan of GDP 1 7 9
indicators D9 Water consumption per 10 000 Yuan of industrial output 1 3 7
C2
Water D10 Ratio of pollutants (COD and ammonia nitrogen) dumped into the river 6 8 9
environment D11 Area ratio of excessive extraction of groundwater 9 2 7
pressure indicators C3
State Water D12 Index of water resources demand–supply balance (IWDS) 9 3 6
indictors resources D13 Water resources amount per capita 7 4 9
B2 state
indicators C4
Socio- D14 Water consumption modulus 6 4 2
economic D15 Water supply amount per capita 9 2 1
state D16 GDP per capita 5 1 6
indicators D17 Agricultural water consumption ratio 3 8 9
C5 D18 Domestic water consumption per capita 7 1 4
Water eco- D19 Eco-environment water consumption ratio 5 7 4
environment D20 Ratio of soil erosion area to the total area 8 9 7
state D21 Up-to-standard rate of water quality in water function area 8 6 7
indicators D22 Ratio of up-to-standard river length of water quality to the total river length 8 7 4 C6 D23 Ratio of class I, II and III groundwater area of water quality to the total area 8 5 4
Response Socio- D24 Water conservancy investment rate 7 2 8
indictors economic D25 Industrial water re-utilization rate 1 6 8
B3 response D26 Effective irrigation coverage rate 7 2 5
indicators D27 Water irrigation efficiency 8 3 1
C7 D28 Water-saving irrigation rate 1 5 7
D29 Leakage rate of water supply pipe network 2 3 9
D30 Water-saving appliances penetration rate 5 2 8
D31 Ratio of urban population access to up-to-standard drinking water to the total urban population 8 9 4 D32 Ratio of rural population access to up-to-standard drinking water to the total rural population 8 6 9
D33 Perfection degree of management system and legal system 5 8 9
was relatively abundant in the upstream and the values of socio-economic related indicators were higher in the devel-oped provinces. Since the water resources security in Shanxi, Inner Mongolia and Ningxia was the worst in the basin, fu-ture planning and management should focus on water man-agement in these three provinces.
Acknowledgements. This paper was sponsored by the National
Basic Research Program (973 Program) (2010CB951104), the National Science Foundation for Innovative Research Group (No. 51121003), International Science & Technology Cooperation Program of China 2011DFA72420 and the special fund of State Key Lab of Water Environment Simulation (11Z01ESPCN).
Edited by: Y. Cai
References
Ana, C. C., John, W. L., and Darrell, G. F.: Multicriteria decision support system for regionalization of integrated water resource management, Water Resour. Manage., 11, 1–22, 2012.
Bass, S. M. and Kwakemaak, H.: Rating and ranking of multiple aspect alternative using fuzzy sets, Automatica, 3, 47–58, 1977. Bonissone, P. P.: A fuzzy set based linguistic approach: theory and
applications, in: Approximate Reasoning in Decision Analysis, edited by: Gupa, M. M. and Sanchez, E., North-Holland Publish-ing Company, Amsterdam, 329–339, 1982.
Brown, L. R. and Hilweil, B.: China’s water shortage could shake world food security, World Watch, 7, 10–18, 1987.
Buede, D.: Second overvies of the MCDA software market, J. Multi-Attrib. Decis. Anal., 5, 312–216, 1996.
Chen, S. H.: Ranking fuzzy numbers with maximizing set and min-imizing set, Fuzzy Set Syst., 2, 113–129, 1985.
Chen, S. J.: Water resources security concept and its discussion, China Water Resour., 17, 13–15, 2004.
Chen, S. M.: A new approach to handling fuzzy decision-making problems, IEEE T. Syst. Man. Cyb., 6, 1012–1016, 1988. Chu, A. T. W., Kalaba, R. E., and Spingarn, K.: A comparison of
two methods for determining the weights of belonging to fuzzy sets, J. Optimiz. Theory App., 27, 531–538, 1979.
Cong, X.: Application of fuzzy mathematics in water quality assess-ment, Northwestern Water Conservancy and Hydropower, 276, 55–57, 2007.
Eom, S. B. and Min, H.: The contributions of multi-attribute de-cision making to the development of dede-cision support systems subspecialties: an empirical investigation, J. Multi-Attrib. Decis. Anal., 5, 239–255, 1999.
Gershon, M.: The role of weights and scales in the application of multiobjective decision making, Eur. J. Oper. Res., 15, 244–250, 1984.
Gorge, T. and Mike, S.: Planning against long term water scarcity: a fuzzy multicriteria approach, Water Resour. Manage., 4, 1103– 1129, 2011.
Han, P. Q., Lu, J. X., and Song, S. H.: Fuzzy clustering’s application in water quality evaluation, Environ. Sci. Technol., 30, 165–167, 2001.
Harrison, M., Saroj, S., and Kalanithy, V.: Multi-attribute decision analysis: a strategic planning tool for water loss management, Water Resour. Manage., 4, 1–23, 2011.
Hwang, C. L. and Chen, S. J.: Fuzzy Multiple Attribute Decision Making: Methods and Applications, Springer, New York, 1992. Hwang, C. L. and Yoon, K.: Multiple Attribute Decision Making:
Methods and Applications, Springer, New York, 1981.
Jain, R.: Decision making in the presence of fuzzy variables, IEEE T. Syst. Man. Cyb., 6, 698–703, 1976.
Jain, R.: A procedure for multi-aspect decision making using fuzzy sets, Int. J. Syst. Sci., 8, 1–7, 1977.
Jia, S. F. and Zhang, S. F.: Water resources security appraisement of Haihe basin, Prog. Geogr., 4, 379–387, 2003.
Jia, S. F., Zhang, J. Y., and Zhang, S. F.: Regional water re-sources stress and water rere-sources security appraisement indi-cators, Prog. Geogr., 6, 538–545, 2002.
Jia, S. F., He, X. W., and Xia, J.: Problems and countermeasures of water resource security of China, Bull. Chin. Acad. Sci., 5, 347–351, 2004.
Jiang, W. L.: Study on water resource safety strategy for China in the 21st century, Adv. Water Sci., 1, 66–71, 2001.
Li, C. H. and Yang, Z. F.: Natural runoff changes in the Yellow River basin, J. Geogr. Sci., 24, 427–436, 2004.
Li, C. H., Yang, Z. F., and Wang, X.: Trends of Annual natural runoff in the Yellow River basin, Water Int., 4, 447–454, 2004. Loucks, D. P.: Sustainable Water Resource Management, Water Int.,
1, 3–10, 2000.
Nijkamp, P., Rietveld, P., and Voogd, H.: Multicriteria Evaluation in Physical Planning, North-Holland Publishing Company, Am-sterdam, 1990.
Parviz, F. and Saeed, F.: A compromise programming model to in-tegrated urban water management, Water Resour. Manage., 6, 1211–1227, 2010.
Saaty, T. L.: A scaling method for priorities in hierarchical struc-tures, J. Math. Psychol., 15, 234–281, 1977.
Shen, N. and Li, C. H.: Evolution characteristics of runoff in Yellow River during recent 500 years, J. Water Resour. Water Eng., 5, 37–40, 2009.
Starr, M. K.: Production Management, Prentice-Hall, Englewood Cliffs, NJ, 1972.
Szidarovszky, F. and Yakowitz, S.: Principles and Procedures of Nu-merical Analysis, Plenum Press, New York, 1978.
WWAP: World Water Development Report-WWDR, Washington, D.C., 2002.
Xia, J. and Zhang, Y. Y.: Water security in north China and coun-termeasure to climate change and human activity, Phys. Chem. Earth, 33, 359–363, 2007.
Xia, X. H., Yang, Z. F., and Wu, Y. X.: Incorporation eco-environmental water requirements in integrated evaluation of wa-ter quality and quantity – a study for the Yellow River, Wawa-ter Resour. Manage., 6, 1067–1079, 2009.
Yellow River Conservancy Committee of the Ministry of Water Re-sources (YRCC, MWR): Statistical yearbook of the Yellow River (report), Zhengzhou, China, 2006.
Yellow River Conservancy Committee of the Ministry of Water Re-sources (YRCC, MWR): Comprehensive Planning in the Yellow River Basin (report), Zhengzhou, China, 2009.
Yellow River Conservancy Committee of the Ministry of Water Re-sources (YRCC, MWR): Water ReRe-sources Comprehensive Plan-ning in the Yellow River Basin (report), Zhengzhou, China, 2009. Yoon, K. P.: A reconciliation among discrete compromise
situa-tions, J. Operat. Res. Soc., 40, 681–686, 1989.
Yoon, K. P. and Hwang, C. L.: Multiple Attribute Decision Making: an Introduction, Sage Publication Inc., Thousand Oaks, Califor-nia, 1995.
Yu, Y. B., Wang, B. D., Wang, G. L., and Li, W.: Multi-person multi-objective fuzzy decision-making model for reservoir flood con-trol operation, Water Resour. Manage., 2, 111–124, 2004. Zhang, J. J.: Fuzzy analytic hierarchy process (FAHP), Fuzzy Syst.
Math., 2, 80–88, 2000.
Zhang, J. Y.: Impacts evaluation of climate changes on water re-sources security, China Water Resour., 8, 5–6, 2010.
Zhang, J. Y., Wang, G. Q., Yang, Y., He, R. M., and Liu, J. F.: The possible impacts of climate change on water security in China, Adv. Clim. Change Res., 5, 290–295, 2008.
Zhang, S. F. and Jia, S. F.: Water balance and water security study in the Haihe basin, J. Nat. Resour., 3, 684–691, 2003.
Zhang, X., Xia, J., and Jia, S. F.: Definition of water security its assessment using, Resource Science, 3, 145–149, 2005. Zheng, T. H.: Discussions on water resources safety and water
re-sources safety warning, China Water Resour., 6, 19–22, 2003. Zhu, H. Y., Du, S. S., and Gu, Y. Y.: Fuzzy mathematics and its