doi:10.5194/hess-15-1339-2011
© Author(s) 2011. CC Attribution 3.0 License.
Earth System
Sciences
Multi-objective automatic calibration of hydrodynamic models
utilizing inundation maps and gauge data
N. V. Dung1,3, B. Merz1, A. B´ardossy2, T. D. Thang3, and H. Apel1
1GFZ German Research Centre for Geosciences, Section 5.4 Hydrology, Potsdam, Germany 2Institute of Hydraulic Engineering, University of Stuttgart, Stuttgart 70569, Germany 3Southern Institute of Water Resources Research SIWRR, Ho Chi Minh City, Vietnam
Received: 22 November 2010 – Published in Hydrol. Earth Syst. Sci. Discuss.: 3 December 2010 Revised: 21 April 2011 – Accepted: 27 April 2011 – Published: 29 April 2011
Abstract. Automatic and multi-objective calibration of hy-drodynamic models is – compared to other disciplines like e.g. hydrology – still underdeveloped. This has mainly two reasons: the lack of appropriate data and the large compu-tational demand in terms of CPU-time. Both aspects are aggravated in large-scale applications. However, there are recent developments that improve the situation on both the data and computing side. Remote sensing, especially radar-based techniques proved to provide highly valuable infor-mation on flood extents, and in case high precision DEMs are present, also on spatially distributed inundation depths. On the computing side the use of parallelization techniques brought significant performance gains. In the presented study we build on these developments by calibrating a large-scale 1-dimensional hydrodynamic model of the whole Mekong Delta downstream of Kratie in Cambodia: we combined in-situ data from a network of river gauging stations, i.e. data with high temporal but low spatial resolution, with a se-ries of inundation maps derived from ENVISAT Advanced Synthetic Aperture Radar (ASAR) satellite images, i.e. data with low temporal but high spatial resolution, in an multi-objective automatic calibration process. It is shown that an automatic, multi-objective calibration of hydrodynamic models, even of such complexity and on a large scale and complex as a model for the Mekong Delta, is possible. Fur-thermore, the calibration process revealed model deficiencies in the model structure, i.e. the representation of the dike sys-tem in Vietnam, which would have been difficult to detect by a standard manual calibration procedure.
Correspondence to: N. V. Dung
1 Introduction
and the Gulf of Thailand. The differences between these models consist of the different representation of the flood-plains, of the numerical scheme used for solving the gov-erning equations, and – most important – the database for the hydraulic control structures in the Vietnamese part of the Delta. The flood model (Dung and Thang, 2007) used for this study was created in Southern Institute of Water Resources Research (SIWRR) using a huge updated database for the in-frastructure of the Mekong Delta and is based on the software package MIKE 11 developed by Danish Hydraulic Institute (DHI).
However, even though large efforts were put into obtain-ing the best possible data for settobtain-ing up the model, calibra-tion is required, which searches for the best possible rep-resentation of natural flow resistance in the simplified flow representation in the model, but also compensates for model insufficiencies and errors, which are unavoidable (Cunge, 2003). In fact, most models must be calibrated to some degree to be useful for any practical application (Gupta et al., 1998). The calibration can be performed either man-ually or automatically. For hydrodynamic models manual calibration is the standard – in contrast to hydrological mod-elling, where sophisticated automatic calibration dominates nowadays, both in research and application. In fact, just a few studies are published dealing with automatic calibration of hydrodynamic, respectively flood models (2-dimensional from Fabio el al., 2010, 1-dimensional from Madsen and Vin-ter, 2006). Automatic calibration adjusts parameters auto-matically according to a specified search scheme optimising numerical measures of goodness of fit of the model results to the data. Automatic calibration gained increasing pop-ularity in the past decades, because it alleviates the chief drawbacks of manual approaches which are subjective, te-dious, much dependent on the expertise of modellers, and need huge amount of labour (Duan et al., 1993; Madsen, 2000; Fabio et al., 2010). A lot of research has been carried out for developing automated calibration routines or applying them to a large number of water-related applications (Duan et al., 1992; Solomatine et al., 1999; Skahill and Doherty, 2006; B´ardossy and Singh, 2008). Depending on the spec-ified technique and the dimension of the parameter space, calibration algorithms have to evaluate many simulations, up to hundreds or thousands or even much more. Hydrological models usually take some minutes or even some seconds per simulation run. Most of hydrodynamic models, particularly flood inundation models, require much longer computation times, typically in the range of some hours or days. Con-sequently, work on automatic calibration of hydrodynamic models, especially of large-scale flood models, is rare. In the Mekong Delta, all the mentioned existing flood models have been calibrated manually. However, due to the ever growing computational power and parallelization techniques an auto-matic calibration of such large-scale hydrodynamic model as the one presented here became feasible from a computational point of view.
The lack of appropriate data is another handicap to model calibration. Data requirements used for a calibration process depend on the model. For example, for a lumped rainfall-runoff model, catchment rainfall-runoff data are needed (Madsen, 2000). For highly distributed hydrodynamic models, spa-tially distributed data such as satellite derived flood extents or water stage maps are strongly recommended as calibration dataset (Bates, 2004). In the last few decades, along with the growth in the area of flood modelling, major advances have been made in the field of remote sensing. Reinforcing the connection between increasing computation power and increasing data availability could improve the model perfor-mance significantly (e.g. Aronica et al., 2002; Di Baldassarre et al., 2009; Mason et al., 2009; Schumann et al., 2009a).
The dataset used for this calibration study contains in-situ data from a network of river gauging stations and a series of flood extent maps, derived from the ENVISAT Advanced Synthetic Aperture Radar (ASAR) satellite plat-form (http://envisat.esa.int/instruments/asar/). Because of the different type and spatial and temporal coverage of the calibration data, a multi-objective optimization frame-work has to be chosen. Several multi-objective optimiza-tion techniques have been developed in the past decade, such as multi-objective complex evolution method MOCOM (Yapo et al., 1998), multi-objective shuffled complex evo-lution metropolis algorithm MOSCEM (Vrugt et al., 2003) or multi-objective genetic algorithms (Zitzler, 2000; Deb et al., 2002; Khu and Madsen, 2005). From studies comparing different multi-objective automatic calibration algorithms it can be concluded that there is no algorithm which is supe-rior in all cases (Zitzler, 2000; Tang et al., 2006; W¨ohling et al., 2008). Given the comparable performance of the avail-able algorithms we selected the Non-dominated Sorting Ge-netic Algorithm II (NSGA II) (Deb et al., 2002) because of its ease-to-use properties and suitability for a parallelization scheme.
The purpose of this study was to develop a scheme which integrates in-situ data and remote sensing data in a paral-lelized multi-objective automatic calibration framework for a large-scale flood model in the Mekong Delta. In Sect. 2, the study site and data are introduced. In Sect. 3, the devel-oped flood model is described. The calibration routine with details on the formulation of objective functions, the auto-matic optimization algorithm and the parallelization scheme is explained. Section 4 reports the results and discussion, followed by conclusions in Sect. 5.
2 Case study area and data 2.1 The Mekong Delta
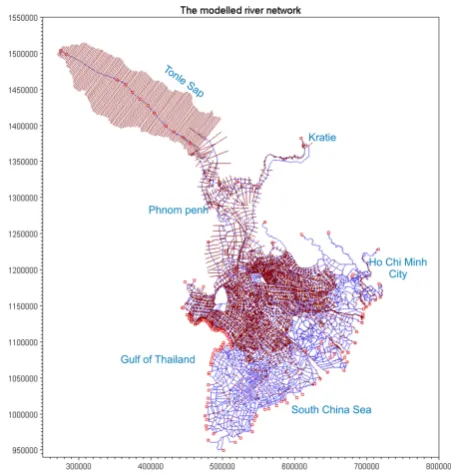
Fig. 1. The Mekong basin and delta and gauging stations in Cambodia and Vietnam used for the calibration (red points); station names are
given in Table 1.
low topography of the Mekong Delta, especially in the Viet-namese part presenting multiple layered circle channel sys-tems, the impacts of two different tidal modes, the peculiarity of the upstream boundary in Cambodia with the Great Lake Tonle Sap and the numerous man-made hydraulic structures in the Vietnamese part of the Delta. The most striking natural feature is the Tonle Sap lake in Cambodia, which serves as a huge buffer for flood discharges during the monsoon season. When the water level in Kratie, which is the upper boundary of the Delta, exceeds the level of 17 m a.s.l., overbank flow in the area of Kampong Cham downstream of Kratie is initiated (Hoi, 2005). The overbank flow separates into two different flow paths: The right overbank flow follows the main stream, but divides further near Phnom Penh into flow into the Tonle Sap Lake to the North and further down in southern direc-tion to the Mekong Delta, Vietnam. A large propordirec-tion of the left overbank flow flows directly south and reaches the Plain of Reeds, the North-eastern part of the Delta in Viet-nam, thus causing a second flood wave besides the floods from the Mekong main stem in these parts.
The floodplains in Cambodia differ significantly from those in Vietnam. In Cambodia the plains are in a compara-ble natural state with only a few control structures, whereas the floodplains in Vietnam are under large regulation by a huge system of navigation and irrigation channels, sluice gates, pumps and especially a sophisticated dike system. Thus, the combination of the natural hydraulic peculiarities in combination with the large anthropogenic influence cre-ates a very complex system, which challenges every mod-elling effort.
2.2 Data
The database used for this study consists of data used for building and modifying the model and those for evaluat-ing the performance of the model. A large amount of to-pographic data obtained from numerous administrative and scientific providers was used for the creation of the model, including data acquired by both ground survey and remote sensing. However, in the scope of this paper, we will mainly present the data used for the calibration.
Two types of data were used for this purpose. The first type consists of water level time series from a network of gauging stations. Further, we use a series of flood extent maps derived from ENVISAT ASAR satellite images. While the former data are point data with high temporal resolution, the latter have a high spatial, but a low temporal resolution. 2.2.1 Gauge data
The typical source of hydrodynamic model calibration data consists of main stream measurements at gauging stations at the boundaries of and sometimes also inside the model domain. In the present study, water level time series at 12 gauging stations of the measurement network (Fig. 1) along the Mekong River and Bassac were used, of which 7 stations are located in Cambodia and 5 stations in Vietnam. The time series used in this study cover the flood season 2008, e.g. from beginning of June to the end of December.
Table 1. Gauging stations used for calibrating the hydrodynamic model (data source: MRC); note: the Mekong in Cambodia is named Tien
river in Vietnam, the Bassac in Cambodia is the Hau river in Vietnam.
no. name of station geographical location location at weight assigned
long lat river to the station
1 Kratie (CAM) 105.987 12.240 Mekong 1
2 Kampong Cham (CAM) 105.338 11.909 Mekong 2∗
3 Prekdam (CAM) 104.804 11.813 Tonle Sap 1
4 Phnom Penh port (CAM) 104.923 11.575 Tonle Sap 1
5 Chaktomouk (CAM) 104.923 11.552 Mekong 1
7 Neakluong (CAM) 105.284 11.261 Mekong 1.5
6 Khokhel (CAM) 105.040 11.240 Bassac 1.5
8 Tan Chau (VN) 105.243 10.803 Tien river 2∗
9 Chau Doc (VN) 105.113 10.707 Hau river 2
10 Vam Nao (VN) 105.357 10.575 Vam Nao river 2∗
11 My Thuan (VN) 105.900 10.273 Tien river 1.5∗
12 Can Tho (VN) 105.790 10.033 Hau river 1.5
∗: those stations are shown in the hydrograph comparison in Sect. 5.
2.2.2 Remote sensing data
The availability of remotely sensed flood extends has made a significant change from a data poor to a data rich envi-ronment for flood modelling (Schumann et al., 2009a). By combining these data with gauge data the calibration of hy-drodynamic models can be better constrained, because the ability of the model to reproduce the temporal and spatial inundation dynamics can be evaluated at the same time.
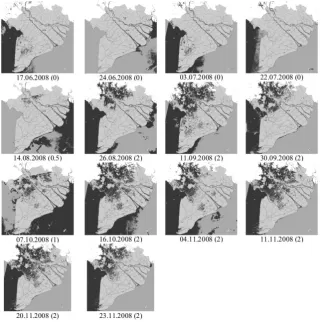
Most recently the mapping of inundation areas by Syn-thetic Aperture Radar (SAR) sensors have gained large pop-ularity because of their insensitivity to cloud coverage, which is the main drawback of optical sensors in inundation map-ping. The value of such data for model calibration has been documented in a number of studies, which all used one or sometimes two flood extent maps in manual calibration mode (Horritt, 2006; Di Baldassarre et al., 2009). In this study a series of flood extent maps (Fig. 2) covering the period of 17 June 2008 to 30 November 2008 were used. These maps were provided by German Aerospace Center (DLR) utilizing ENVISAT ASAR radar imagery. The Advanced Synthetic Aperture Radar (ASAR) on the platform uses the C-Band. Data used for generation of the inundation maps are acquired in wide swath mode (image mode) with a geometric resolu-tion of 90 m to ensure the coverage of the whole Mekong Delta in one dataset for one point in time. The derivation of the inundation maps is performed by a histogram threshold based approach similar to the one described by Schumann et al. (2009c). The implementation of the method used for in-undation map generation (Huth et al., 2009) was integrated in an automated processing chain for standardized and re-peatable processing of inundation time series (Gstaiger et al., 2011). The histogram threshold based method is based on the assumption that water surfaces are forward scattering the
radar signal resulting in low backscatter signals to the sensor. It uses multiple grey level thresholds and image morpholog-ical operations. The derived inundation maps were validated by several field surveys in the Mekong Delta. The accuracy at the edges of the inundation maps is estimated as 1–2 pix-els, i.e. 90–180 m for the ASAR derived inundation maps. Further details can be found in Gstaiger et al. (2011).
3 The flood model
Fig. 2. Flood extent maps derived from ASAR used for model calibration. The numbers in the brackets indicate the weights assigned for the
individual map in the calibration process (cf. Sect. 4).
linked to the channel by control structures. Here weirs were used to represent dikes and dike overflow and sluice gates were used whenever information on existing sluice gates was present. Figure 4 illustrates the approach, by which a quasi-2-dimensional model is established. This approach resem-bles the first hydrodynamic model developed for the Mekong Delta by Cunge (1975), but adopted to the present channels and dikes, which were hardly present at that time. The model consists of 4235 branches, of which more than 2134 are used to represent the flood plains of the Mekong Delta in Vietnam in 564 compartments, which is equivalent to about 26376 computational nodes (see Table 2). The length of the sim-ulated channel system is about 25 000 km. The topographi-cal data for the model were collected from various sources, thus having different levels of accuracy. The most accurate data could be collected for the main stems of the Mekong and some larger channels. For the smaller channels, where sometimes no bathymetric data were available, bed elevation had to be assumed. The same holds true for the dike ele-vations, with the additional problem of different datum used by the different agencies and districts for geo-referencing of elevations.
4 Calibration framework
For the automatic calibration of such a large-scale hydrody-namic model utilizing the different data sources described in Sect. 2.2 the framework shown in Fig. 5 has been developed. It consists of the following four elements:
1. parameter classification
2. multi-objective calibration algorithm 3. formulation of objective functions 4. parallelization scheme
4.1 Parameter classification
Fig. 3. The model river network including Tonl´e Sap – Great Lake.
Fig. 4. Representation of a typical floodplain compartment in the
Vietnamese part of the Delta.
defined: the main rivers in the Cambodian model domain (Mekong and Bassac), the main rivers (Tien and Hau rivers) and major channels in the Vietnamese part of the Delta, the floodplains in Cambodia and in Vietnam respectively due to their different characteristics, and the remaining medium and small channels in Vietnam. Figure 6 illustrates the spatial distribution of the different classes.
[image:6.595.308.547.63.266.2]For each class feasible ranges of roughness parameters were defined. The ranges are comparable to those published in hydraulic text books and other publications (Chow et al., 1988; Werner et al., 2005; Pappenberger et al., 2007b; Fabio et al., 2010). The ranges chosen enclose the values typically expected for the flow conditions, but are also large enough in order to enable compensation of model errors – most likely geometric errors – by the calibration. However, in sensitivity runs we observed that the model got unstable for values ex-ceeding the defined ranges. Therefore, the ranges were lim-ited to ranges preventing model instabilities. Table 3 sum-marizes the roughness parameterization.
Fig. 5. The calibration framework for the hydrodynamic model.
Table 2. Statistics of the hydrodynamic model of the Mekong Delta.
Number of real branches 4235
Length of simulated channel system ∼25 000
Number of “artificial” branches 2134
Number of computing nodes 26376
Downstream boundary conditions 84
Upstream boundary conditions 4
Number of flood plain compartments 564
4.2 Multi-objective optimization algorithm
A multi-objective calibration problem can be stated as a minimization or maximization problem over several objec-tive functions (Madsen, 2000). In this study, both objecobjec-tive functions formulated are based on maximum forms (Nash-Sutcliffe coefficient and flood area index). Hence, the opti-mization of the maximum is more suitable in this case. It can be formalized as:
Max{F1(θ ),F2(θ ),...,Fm(θ )} (1) Whereθ=(θ1,θ2,...,θn)is a decision vector located within the parameter space8⊂Rn. The numerators n and m denote the number of parameters to be estimated and the number of objective functions, respectively. The objective functions
Fi(θ ), i=1...mreflect the model performance with respect to the selected calibration objectives. Because of the max-imization form used higher values in Fi(θ ) indicate better model performance in calibration objectivei.
[image:6.595.335.519.331.412.2] [image:6.595.48.288.341.434.2]Table 3. Assignment of roughness values to five classes of channels and floodplains.
No. Group’s Strickler’s Descriptions
Name [Manning’s]
coefficient range
1 MK BS [20, 60] Branches used to model Mekong river in Cambodia,
[0.016, 0.05] Bassac River in Cambodia, Tonle Sap Great Lake
2 TienHau [20, 60] Mekong River in Vietnam (Tien River), Bassac River
[0.016, 0.05] in Vietnam (Hau River), and major branches of these rivers
[image:7.595.49.286.282.541.2]3 CamFP [10, 50] Branches for modeling Cambodia floodplains
[0.02, 0.1]
4 VietFP [10, 50] Artificial branches for modeling Vietnam floodplains
[0.02, 0.1]
5 Global [20, 60] Other from above (remaining branches)
[0.016, 0.5]
Fig. 6. Scheme of the roughness classification of channels and :
black for Mekong and Bassac in Cambodia, red for Tien and Hau river and major channels in Vietnam, blue for Cambodian flood-plains, green for Vietnamese floodplain compartments and magenta for the remaining channels in the Vietnamese delta (cf. Table 3).
In general, approaches to solve a multi-objective optimiza-tion problem can be categorized into two types. The classi-cal type, named weighted sum approach is to assign a weight to each normalized objective function so that the problem is transformed to a single objective problem. The main diffi-culty of this approach is the need of prior information of the weight factor. Opposite of this, Pareto-ranking approaches
use the concept of Pareto dominance in evaluating fitness or in assigning selection probabilities to solutions. In this approach, the population of estimated parameters is ranked according to a dominance rule, and then each solution is as-signed a fitness value based on its rank in the population. The first Pareto ranking technique was proposed by Gold-berg (1989).
Genetic algorithms (GA) are well suited heuristic meth-ods for multi-objective optimization problems. In this class of algorithms solutions are generated using mechanisms in-spired by natural evolution. They encompass selection, mat-ing, crossover, and mutation principles. Since the pioneer-ing work by Schaffer (1985), a number of studies on multi-objective genetic algorithms (MOGA) have emerged (Konak et al., 2006). Most of these studies were motivated by a sug-gestion of a non-dominated GA outlined in (Goldberg, 1989). The most notable one is the Non-sorting Genetic Algorithm (NSGA) II developed by (Deb et al., 2002). Compared to its previous version NSGA first proposed by Srinivas and Deb (1995), NSGA II shows a significant improvement by using a fast non-dominated sorting algorithm and the elitism concept. Several calibration studies of hydrological models based on NSGA II have been published (Khu and Madsen, 2005; Kollat and Reed, 2006; Madsen and Khu, 2006; Feni-cia et al., 2007; Reed et al., 2007; Tang et al., 2007).
NSGA II involves four steps (Deb et al., 2002): Step 1: Population Initialization
– Generate initial populationP of sizeN. – Evaluate the fitness of each individual inP. Step 2: Ranking
– SortP based on domination to form fronts. – Compute “density” or “crowding distance” for each
– Make a complete ordered sorting using both above concepts.
Step 3: Offspring Generation
– Form a pooling group of a size less thanNof the current population using binary tournament selection
– Implement crossover using Simulated Binary Crossover (SBX) to create a temporarily offspring set of size ofN. – Mutate each individual of the above set to create the
offspring populationQof sizeN. Step 4: Forming Next Generation Population
– CombineP andQto makeR(size of 2×N), then rank
Rbased on domination and diversity (“crowding distance”).
– Select the bestNindividual inRto form next generation
– Back to step 3. (the loop consisting of step 3 and step 4 is called main loop of the algorithm)
Table 4 gives values of main parameters used for the NSGA II in this study.
The stopping criteria of the process
In multi-objective optimization problems, several termi-nating conditions could be applied to stop the calibration process, e.g. evolution time, a fixed number of generations. These criteria can be defined at the beginning of the calibra-tion process. Another way to determine the terminacalibra-tion of the process is to measure the improvement over the iterations by comparing a function based on the two Pareto parameter sets which belong to two successive populations (Zitzler et al., 2000; Shafii and De Smedt, 2009). In this calibration framework a fixed number of loops MI (see Table 4) was used. Due to the computational demand for the whole pro-cess, MI should be chosen so that the initial populationiP
multiplied by MI is not exceedingly large. The choice ofiP
is elaborated in detail in Sect. 4.4. Through a series of im-plementing tests withiPranging from 36 to 60 and MI from 30 to 50, MI was fixed to 30.
4.3 Definition of the calibration objectives 4.3.1 The first objective function
Using the stage hydrographs recorded at 12 stations along the main stream of the Mekong and Bassac rivers, the first objec-tive function evaluates the temporal performance in simulat-ing water levels in the main channels and is formulated based on the Nash-Sutcliffe model efficiency coefficient:
F1= nS X
i=1
[image:8.595.306.523.92.314.2]ωSiFiS (2)
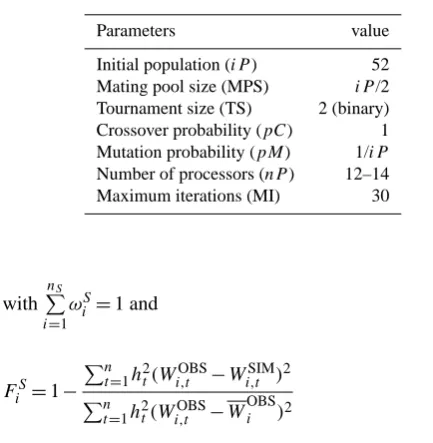
Table 4. Summary of parameter settings for multi-objective
opti-mization in master-slave parallelization scheme.
Parameters value
Initial population (iP) 52
Mating pool size (MPS) iP/2
Tournament size (TS) 2 (binary)
Crossover probability (pC) 1
Mutation probability (pM) 1/iP
Number of processors (nP) 12–14
Maximum iterations (MI) 30
with nS P
i=1
ωSi =1 and
FiS=1− Pn
t=1h2t(Wi,tOBS−W SIM i,t )2 Pn
t=1h2t(Wi,tOBS−W OBS i )2
(3)
In the above equations,Wi,tOBS,Wi,tSIM are the observed and simulated water level, respectively, at station numberi and at timet,WOBSi the average observed water level at station numberi,nS the number of stations, nthe number of time steps in the calibration period. ht andωSi are weighting co-efficients. ht indicates the importance given to particular portions of the hydrograph. This reflects the idea that it is difficult to obtain a model which performs equally well for high and low flows (Madsen, 2000), and that, in our flood study, high flows are of higher importance. Therefore, the flood peak period of the hydrograph is given a higher weight.
ωiindicates the importance given to a certain location of the network of gauging stations.FiSis the weighted form of the Nash-Sutcliffe coefficient given to station numberi. F1 de-notes the first objective function which is the maximization form of the weighted average of the station coefficients men-tioned. The optimal solution isF1=1.
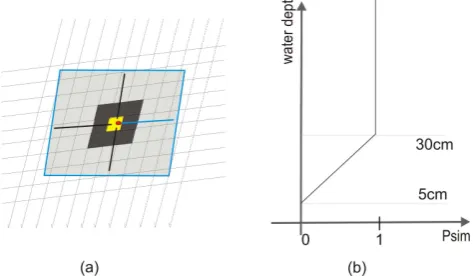
Fig. 7. Illustration of the evaluation of the spatial performance of
the model using flood extent maps. (a) Representation of the diked floodplains in the Vietnamese part of the Delta in the model overlain by the flood extent map. Red dot: node that represents the inunda-tion state of the area in the floodplain compartment surrounding the node in the model; yellow pixel: pixel of the extent map matching the node; gray pixels: neighbouring pixels of the extent map used in the performance evaluation. (b) Fuzzy membership function used for the determination of the floodplain compartment nodes as being flooded.
4.3.2 The second objective function
The second objective function evaluates the spatial perfor-mance of the model in predicting inundation extent utilizing the series of ASAR derived flood extent maps. Several ap-proaches to compare simulated and observed inundation ex-tents have been proposed and discussed (Aronica et al., 2002; Hunter et al., 2005; Pappenberger et al., 2007a; Schumann et al., 2009a). The most recommended measure is the flood area index, which is a binary pixel-wise comparison of observed and simulated flood extent maps and which is formulated for a single flood extent map as:
FiM= P 11 i
Pi11+Pi01+Pi10 (4)
where:Pi11is the number of pixels for which simulation and observation indicate “wet”.
Pi10 is the number of pixels for which observation indi-cates “wet” and simulation indiindi-cates “dry”.
Pi01is the number of pixels for which simulation indicates “wet” and observation indicates “dry”.
FiMis the flood area index to the flood map numberi. The deficiencies of this measure, for example bias towards large inundation extent, are known and reported. Nonethe-less, due to the lack of better alternatives up to date, it is still the basic measure used and recommended for deterministic calibration (see Schumann et al., 2009a for a review). In this study we accept this limitation and put the focus more on the development and testing of automatic calibration routines,
instead of improving the goodness of fit measure for the in-undation extent. However, since the hydrodynamic model is basically 1-dimensional and does not deliver inundation maps directly, the method for deriving the flood area index had to be revised. Interpolating a 2-dimensional flood ex-tent map for comparison with the observed inundation exex-tent from the nodes of the 1-dimensional model, which is a quite error-prone procedure especially in the complex and heav-ily dike protected floodplains in Vietnam, was an inappropri-ate option. Therefore we developed the following method, which also considers uncertainties of the simulation (by the model setup and imperfect spatial representation) and flood maps (by classification errors and geo-referencing). Fig-ure 7a shows the overlay of a flood extent map and a typi-cal flood plain in Vietnam as represented in the model. The junction of the four floodplain branches point represents the inundation state and depth of an enclosed floodplain com-partment. This is overlain by a single pixel of the flood ex-tent map (yellow in Fig. 7a). The probability of being flooded of the simulated nodePsimrepresenting the floodplain com-partment is defined by a fuzzy set, i.e. a membership func-tion is assigned to each floodplain node as shown in Fig. 7b. Just one computational node at the centre of the compartment (red node in Fig. 7a) is taken into account in the comparison. However this is an imperfect representation of the inundation state of the area around the node in the compartment. We therefore assume that the higher the water depth at the node the higher is probability of the area around the node being flooded completely. If the water depth is lower than or equal to 5 cm, the probability is defined as 0 given the uncertain-ties of the DEM and the actual micro-topography. In other words, with simulated water levels below 5 cm the probabil-ity of the major parts around the node of the compartment being flooded is zero. On the other hand, if the water depth is higher than 30 cm, we assume that the area surrounding the node is inundated completely. This assumption is based on the typical micro-topography, especially the height of the low dikes surrounding paddy fields. The probability of inun-dation for water levels between 5 and 25 cm rises linearly. And, in order to reduce the spatial error in comparing just a single pixel of the flood extent map with the state of the node for the floodplain compartment, also the neighbouring 8 pixels are included in the performance evaluation. Here, the probability of being floodedPSAR is determined by the proportion of the 9 cells identified as flooded in the extent map.
By the assignment of probabilities of a floodplain compart-ment of being flooded both in the simulation and the map-ping, the performance of the model can be evaluated proba-bilistically in a Monte-Carlo procedure comprised two steps:
Step1:
– generate a random numberrSAR in (0, 1) for every 9-pixel cell; ifrSARis smallerPSARthen this cell is con-sidered being wet, otherwise it is dry.
– repeat the actions above for all flood cells Step 2:
– calculate the measureFi using Eq. (4)
The above two steps are repeated 1000 times (Monte Carlo sampling). The mean (50 % percentile of the distribution function ofFi)is considered as the measure based on a single map numberi.
To calculate the second objective function, the Fi of the individual extent maps are combined as a weighted sum:
F2= nM
X
i=1
ωMi FiM (5)
where nM
P
i=1
ωiM=1
F2is the second objective function to be maximized, with
ωMi as the weighing coefficient which indicates the impor-tance given to flood extent map numberi. A perfect match if all flood extent maps would evaluate toF2=1. In the pre-sented work we used the weighting coefficients as shown in Fig. 3. Emphasis is given on maps covering the whole flood-plain in Vietnam and mostly acquired during the flood sea-son. Four early “almost dry” maps were assigned the value 0 to their weights, because our study is mainly focused on flood modelling. Maps which do not cover whole area of interest were assigned a lower weight.
4.3.3 Normalization of objective functions
Many Multi-Objective Evolutionary Algorithms (MOEAs) use a distance metric to ensure a well-spread distribu-tion of individuals along the Pareto front. In NSGA it is the crowding distance d. However, the individual ob-jective functions may or may not operate over a compa-rable scale. It is, therefore, important to consider and adapt to widely disparate scaling among different objectives (Pedersen and Goldberg, 2004).
In this present study, two objective functions were formu-lated using different performance measure. The first objec-tive function is based on Nash-Sutcliffe coefficient, hence ranges from−∞to 1 (not fully bounded). While the sec-ond objective function is founded on flood indexes, which vary between 0 and 1 (bounded). In the published version of NSGA II proposed by Deb et al. (2002), the crowding dis-tance method did not discuss on scaling factor which may cause bad distribution on the Pareto front. Or, the crowd-ing distance only took account for the case of known bounds (Pedersen and Goldberg, 2004). The normalization is for-malized as:
dj=dj+
fi,j+1−fi,j−1
fi,max−fi,min
(6)
wheredj is the crowding distance for an individualj,fi,j objective value of theith objective of the individual j. In literature,fi,maxandfi,minare recommended to be fixed or equal to the two bound values of the objectivei. If the nor-malization byfi,maxandfi,minwas not done, the crowding distance would be dominated by the objective functions with larger values. Hence distribution of solutions on the Pareto front would be biased towards those objectives. Furthermore, for the case of unbounded or not fully bounded range of pa-rameters, it is necessary to find another way for the normal-ization. Thereforefi,maxandfi,min will be selected as lo-cal maximum and minimum values of F1 and F2 for each Pareto front and the normalization is consequently performed on these varying bounds.
4.4 The master slave parallelization scheme
In order to facilitate the automatic calibration of the model a parallelization scheme for the optimization process was im-plemented. Computational time is still the bottleneck of au-tomatic calibration on single processor unit.
In this study, a typical model run for the simulated time period of five months took roughly 150 min, which is not ex-tremely long, but still too long for automatic calibration on a single processor requiring several hundreds or even thou-sands of model runs. Therefore a master-slave paralleliza-tion routine was designed for this study and implemented on a Windows-based computational server with 16 proces-sors. In a master-slave scheme the master processor controls the communication and work load of sub-ordinated – slave – processors (Tang et al., 2007). Applying this scheme to the calibration framework (see Fig. 6) the master processor has a fully functional version of the NSGA II that uses slave processors to evaluate solution and return objective values to perform all of the required evolutionary search operations.
The number of processorsnP used for the computation was selected between 12 and 14. The reason is that nP
should be enough big to maximize the utilization of multi-processors units but should not be too big to cause the unit to stall by processor communication overload. And, in order to optimize the performance of the computation, the size of the initial populationiPand the number of CPUsnPshould suit (see Table 4). In general,nPshould be an integer divisor of
iP in order to achieve optimal synchronization of the model runs of the slaves. In the present study, for example, we set
iP to 52 andnP to 13.
4.5 Computational framework
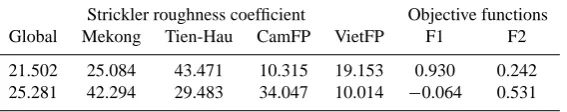
Table 5. Parameter sets and objective function values for best solutions for F1 (first line) and F2 (second line).
Strickler roughness coefficient Objective functions
Global Mekong Tien-Hau CamFP VietFP F1 F2
21.502 25.084 43.471 10.315 19.153 0.930 0.242
25.281 42.294 29.483 34.047 10.014 −0.064 0.531
published studies on hydrological model calibration (Mad-sen, 2000; Mad(Mad-sen, 2003; Blasone et al., 2006; Ngo et al., 2007). However, the current version of AUTOCAL is not appropriate for presented study for the following reasons:
1. Both above algorithms are mainly designed for single objective calibration (although they can be suited for multi-objective optimization by aggregating single ob-jective calibration).
2. The format of the input and output file should follow the format supported by AUTOCAL, which at the moment does not support the use of flood extent maps or spatial information in general.
3. It requires the installation of the additional commercial OfficeGrid module for parallel computing facilities. DHI MIKE is a commercial software package, therefore ac-cess to the source code in order to implement the required changes is not possible. In order to meet the requirements of this study wrapper codes around the actual hydrodynamic model were developed. A parallel version of NSGA II has been developed to control the calibration process and serve as a wrapper for all components. The scripting language Python was selected due to available packages for paralleliza-tion (http://wiki.python.org/moin/ParallelProcessing). Fur-thermore, Python is the main scripting language in Ar-cGIS, which could be included in the evaluation of the sec-ond objective functions in future applications, e.g. for 2-dimensional hydrodynamic model calibration, where a direct comparison of inundation extents is possible. Others issues to deal with were reading the ASCII output files of MIKE11 to retrieve the simulation results and comparison with the flood extend maps.
5 Results and discussion
[image:11.595.310.543.179.353.2]The flood model was used to simulate the flood season of 2008. A time step of 30 min was chosen to maintain model stability. For the optimisation algorithmiP was set to 52, the maximum iterations to 30, and hence the total number of model runs and objective function evaluations to 1560. The number of processors used was 13. The evaluation of each population took about 10 h, i.e. the whole calibration process took about 300 h or 12.5 days. Figure 8 shows the Pareto
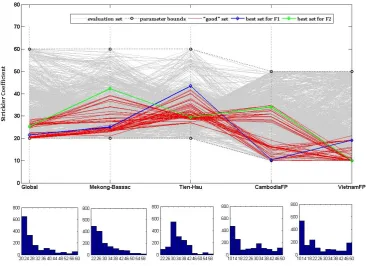
Fig. 8. Pareto-optimal solutions of the final population maximizing
the objective functions.
front of the final population, which consist of 52 Pareto-optimal solutions. Table 5 lists the parameter sets and ob-jective function values for the optimal solutions for both F1 and F2.
Figure 8 and Table 5 indicate that the objective function values for F1 and F2 exhibit a significant spread over the final population and also on the Pareto front. The best solution for either objective can only be reached in combination with a rather poor performance in the other objective. However, F1 is more sensitive than F2 as the wider spread on the horizon-tal axis in Fig. 8 illustrates. Because the objective function values were normalized (cf. Sect. 4.3.3), a direct comparison of the sensitivity by value range is valid.
Figure 9 shows the parameter distribution for the final pop-ulation over the five parameter classes. The parameter dis-tributions on the Pareto front exhibit two distinct features: (1) As already indicated in Table 5, the best solutions for F1 and F2 show an almost contrary behaviour, and (2) the largest spread in parameter range from the Pareto optimal solutions is observed in the Cambodian floodplain.
Fig. 9. Parameter distribution of the simulations of final population.
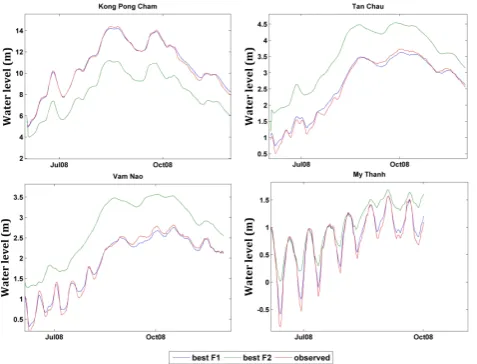
for two different dates in the high flood period. Here it be-comes obvious, that the best solution for F1 underestimates the inundation areas, especially in the Long Xuyen Quad-rangle west of the Bassac/Hau river. Also in the Plain of Reeds the simulation exhibits some problems in simulating the observed inundation pattern. Some compartments are simulated as flooded while being observed as dry and vice versa. This situation is improved in the best simulation for F2, as expected. Here the Long Xuyen Quadrangle is inun-dated to a large extent and also the inundation pattern in the Plain of Reeds is matched better. However, this improve-ment comes at the cost of large errors in the simulation of the hydrographs as shown in Fig. 11. In order to improve the spatial performance of the model the calibration routine tries to increase the water levels in the Vietnamese part of the Delta, for which the comparison of the inundation maps was performed. This is achieved by lowering the roughness (higher Strickler coefficients) in the Mekong/Bassac and in the Cambodian floodplains, causing less inundation and in-flow in the Tonle Sap. This is illustrated by the simulated water levels in Kampong Cham, which are about 3 meters below the observed water levels. By this the buffering capa-bilities of the Tonle Sap in the model is reduced and more water is conveyed to the Vietnamese Delta, both through the main channels and the floodplains. In addition, the rough-ness was enlarged in the Tien and Hau rivers (lower Strick-ler coefficients) resulting in simulated water levels about 1 m above the recorded values (cf. stations Tan Chau and Vam Nao in Fig. 11). This in turn causes larger inundation areas
in the Long Xuyen Quadrangle and the Plain of Reeds mainly due to overflow of dikes. The overflow of dikes, respectively the dike elevations, controls the inundation of closed flood-plain compartments in Vietnam, while the actual floodflood-plain flow has only little influence on the inundation extent. This can be derived from the comparatively small changes in the roughness of the Pareto optimal solutions for the Vietnamese floodplains in Fig. 9. These findings indicate that the dike el-evations as implemented in the model are erroneous, despite the efforts taken in gathering the best possible information.
Possible error sources are the different datum and projec-tions used by the different districts and provinces in the Delta when surveying the dikes. These often do not conform and can cause inconsistencies in the model. In general it can be noted that the spatial performance of the model is average at best and that the main reason is the representation of the dike elevations in the model. Another error has to be attributed to the coarser representation of the floodplain compartments in the model compared to reality.
Simulation with best Euclidean parameter set and dikes heights−20 %
Fig. 10. Inundation areas from ENVISAT ASAR (blue) and simulated inundation areas (light red) for best solutions for F1 and F2 for two
[image:13.595.49.288.393.575.2]satellite overpasses during the high flood period. Areas which are both observed and simulated wet appear in purple, both simulated and observed dry appear white. The red circle indicates the Long Xuyen Quadrangle, the green circle the Plain of Reeds. The small diamonds represent the floodplain compartments for which the flood area index was calculated.
Fig. 11. Observed and simulated hydrographs for best solutions for
F1 and F2 for selected gauging stations.
min(p(1−F1)2+(1−F2)2) (7) Table 6 lists the parameter set fulfilling the criteria. This set was used simulating the inundation with dike heights gener-ally lowered by 20 %. The result in terms of model perfor-mance is also given in Table 6. Both two objectives show increased performance when lowering the dike heights by
20 %. This corroborates the hypothesis that the dike repre-sentation in the model is responsible for the errors in predict-ing inundation extents. Further investigations on the real dike heights are therefore advised. However, this is not within the scope of this paper.
6 Conclusions
Table 6. Best Euclidian distance parameter set of the final Pareto optimal population and performance values of F1 and F2 and corresponding
Euclidian distances to the optimal pit (1,1) with original (in normal font style, upper) and lowered dike heights (in bold, lower) cases.
Strickler coefficient Objective
Euclidian Distance functions to (1, 1)
Global Tien-Hau Meko-Bass CamFP VietFP F1 F2
20.816 24.808 34.512 10.000 14.859 0.745 0.405 0.647
0.759 0.499 0.556
It can be concluded that an automatic, multi-objective cal-ibration of hydrodynamic models, even of such large-scale and complex applications as in the Mekong Delta, is possi-ble. This is an important step towards more objectivity in hy-drodynamic model calibration. The calibration showed that a trade-off between the two objectives exists – a good perfor-mance in one of the objectives can only be reached at the ex-pense of a poor performance in the other. Exploring the best solutions for the single objective functions it became clear that the model contains deficiencies in the representation of the dike system in Vietnam. Thus it can be concluded that the automatic, multi-objective calibration is not only able to pa-rameterize a hydrodynamic model properly, but also able to identify model deficiencies on an objective basis. This con-clusion was corroborated by a sensitivity simulation using the best Euclidean distance parameter set and dike heights generally lowered by 20 %, which improved the performance of the model. By obtaining a set of Pareto-optimal solutions, it is also possible to derive uncertainty estimates of simula-tion runs. This is achieved by evaluating the ensemble of model results obtained with the Pareto-optimal parameteri-zations. Thus the benefit of the multi-objective, automatic calibration is trifold, encouraging us to advocate for an in-creasing use of this procedure in hydrodynamic modelling.
Acknowledgements. This study was conducted within the
frame-work of the WISDOM project which is funded by the German Ministry of Education and Research BMBF and the Vietnamese Ministry of Science and Technology. Funding by the ministries and support from various Vietnamese administrative bodies is gratefully acknowledged. We would also like to thank Guy Schumann, Nigel Wright and an anonymous reviewer for their helpful comments.
Edited by: E. Toth
References
Apel, H., Aronica, G., Kreibich, H., and Thieken, A.: Flood risk analyses – how detailed do we need to be?, Nat. Hazards, 49, 79–98, 2009.
Aronica, G., Hankin, B., and Beven, K.: Uncertainty and equifi-nality in calibrating distributed roughness coefficients in a flood propagation model with limited data, Adv. Water Resour., 22, 349–365, 1998a.
Aronica, G., Tucciarelli, T., and Nasello, C.: 2D multilevel model for flood wave propagation in flood-affected areas, J. Water Res. Pl.-ASCE, 124, 210–217, 1998b.
Aronica, G., Bates, P. D., and Horritt, M. S.: Assessing the un-certainty in distributed model predictions using observed binary pattern information within GLUE, Hydrol. Process., 16, 2001– 2016, 2002.
B´ardossy, A. and Singh, S. K.: Robust estimation of hydrologi-cal model parameters, Hydrol. Earth Syst. Sci., 12, 1273–1283, doi:10.5194/hess-12-1273-2008, 2008.
Bates, P. D. and De Roo, A. P. J.: A simple raster-based model for flood inundation simulation, J. Hydrol., 236, 54–77, 2000. Bates, P. D.: Remote sensing and flood inundation modelling,
Hy-drol. Process., 18, 2593–2597, 2004.
Blasone, R. S., Madsen, H., and Rosbjerg, D.: Comparison of pa-rameter estimation algorithms in hydrological modelling, IAHS-AISH Publication, 304, 67–72, 2006.
Chow, V. T.: Open-Channel Hydraulics, McGraw-Hill, New York, 680 pp., 1973.
Chow, V. T., Maidment, D. R., and Mays, L. W.: Applied Hydrol-ogy, McGraw-Hill, New York, 572 pp., 1988.
Cunge, J. A.: Two-dimensional modeling of floodplains, Water Re-sources Publications, 2, 705–762, 1975.
Cunge, J. A.: Of data and models, J. Hydroinform., 5, 75–98, 2003. Dac, N. T.: Mathematical method for modelling flows and water quality in channels, Agriculture Publishing House, Ho Chi Minh city, 2005.
Deb, K., Agrawal, S., Pratap, A., and Meyarivan, T.: A Fast Elitist Non-Dominated Sorting Genetic Algorithm for Multi-Objective Optimization: NSGA-II, Kanpur Genetic Algorithms Laboratory (KanGAL), Indian Institute of Technology Kanpur, Kanpur, 11, 2002.
Di Baldassarre, G., Schumann, G., and Bates, P. D.: A technique for the calibration of hydraulic models using uncertain satellite observations of flood extent, J. Hydrol., 367, 276–282, 2009. Duan, Q., Sorooshian, S., and Gupta, V.: Effective and efficient
gloabl optimization for conceptual rainfall-runoff models, Water Resour. Res., 28, 1015–1031, 1992.
Duan, Q., Gupta, V., and Sorooshian, S.: Shuffled Complex Evolu-tion Approach for effective and efficient global minimizaEvolu-tion, J. Optimiz. Theory App., 76, 501–521, 1993.
Dung, N. V. and Thang, T. D.: Updating information and analysing national and international impacts to the dike system in the Mekong delta, Southern Institute of Water Resour. Res. (SI-WRR), Ho Chi Minh city, Technical report, 2006.
hydro-dynamic model for modelling floods in the Mekong Delta using MIKE11, SIWRR – Southern Instute of Water Resour. Res. Ho Chi Minh City, 2007.
Dung, N. V., Apel, H., and Merz, B.: Floods in the Mekong Delta: a future perspective, European Geosciences Union, Austria, 19–24 April 2009.
Dung, N. V., Apel, H., and Merz, B.: Integration of remote sensing and in-su data in automatic calibration of hydraulic models. A case study in the Mekong Delta, European Geosciences Union, Vienna, Austria, 2–7 May 2010.
Fabio, P., Aronica, G. T., and Apel, H.: Towards automatic calibra-tion of 2-D flood propagacalibra-tion models, Hydrol. Earth Syst. Sci., 14, 911–924, doi:10.5194/hess-14-911-2010, 2010.
Fenicia, F., Savenije, H. H. G., Matgen, P., and Pfister, L.: A comparison of alternative multiobjective calibration strategies for hydrological modeling, Water Resour. Res., 43, W03434, doi:10.1029/2006WR005098, 2007.
Goldberg: Genetic algorithms in search, optimization, and machine learning, Addison-Wesley Publ. Co., Inc., Massachusetts, 1989. Gstaiger, V., Gebhardt, S., Huth, J., and Wehrmann, T.:
Multi-sensoral derivation of inundated areas using TerraSAR-X and ENVISAT ASAR data., Int. J. Remote Sens., accepted, 2011. Gupta, H. V., Sorooshian, S., and Yapo, P. O.: Toward improved
calibration of hydrologic models; multiple and noncommensu-rable measures of information, Water Resour. Res., 34, 751–763, 1998.
Hoa, L. T. V., Nhan, N. H., Wolanski, E., Tran, T. C., and Haruyama, S.: The combined impact on the flooding in Vietnam’s Mekong River delta of local man-made structures, sea level rise, and dams upstream in the river catchment, Estuarine, Coastal and Shelf Science, 71, 110–116, 2007.
Hoa, L. T. V., Shigeko, H., Nhan, N. H., and Cong, T. T.: Infras-tructure effects on floods in the Mekong River Delta in Vietnam, Hydrol. Process., 22, 1359–1372, 2008.
Hoi, T. N.: Research on scientific and technological solutions on building dike system for sustainable development in the Mekong Delta, Southern Institute of Water Resour. Res., Ho Chi Minh City, 2005.
Horritt, M.: Development and testing of simple 2D finite volume model of sub-critical shallow water flow, Int. J. Numer. Meth. Fl., 44, 1231–1255, 2004.
Horritt, M. S.: A methodology for the validation of uncertain flood inundation models, J. Hydrol., 326, 153–165, 2006.
Hunter, N. M., Bates, P. D., Horritt, M. S., De Roo, A. P. J., and Werner, M. G. F.: Utility of different data types for calibrat-ing flood inundation models within a GLUE framework, Hy-drol. Earth Syst. Sci., 9, 412–430, doi:10.5194/hess-9-412-2005, 2005.
Huth, J., Gebhardt, S., Wehrmann, T., Schettler, I. , K¨unzer, C., Schmidt, M., Dech, S.: Automated inundation monitoring us-ing TerraSAR-X multi-temporalimagery, European Geoscience Union Annual Assembly 2009, Vienna, Austria, 2009.
Khu, S. T. and Madsen, H.: Multiobjective calibration with
Pareto preference ordering: An application to
rainfall-runoff model calibration, Water Resour. Res., 41, W03004, doi:10.1029/2004WR003041, 2005.
Kollat, J. B. and Reed, P. M.: Comparing state-of-the-art evo-lutionary multi-objective algorithms for long-term groundwater monitoring design, Advances in Water Resources, 29, 792–807,
doi:10.1016/j.advwatres.2005.07.010, 2006.
Konak, A., Coit, D. W., and Smith, A. E.: Multi-objective optimiza-tion using genetic algorithms: A tutorial, Reability engineering and system safety, 91, 992–1007, 2006.
Madsen, H.: Automatic calibration of a conceptual rainfall-runoff model using multiple objectives, J. Hydrol., 235, 276–288, 2000. Madsen, H.: Parameter estimation in distributed hydrological catch-ment modelling using automatic calibration with multiple objec-tives, Adv. Water Resour., 26, 205–216, 2003.
Madsen, H. and Khu, S. T.: On the use of Pareto optimization for multicriteria calibration of hydrological models, Calibration and Reliability in Groundwater Modelling: From Uncertainty to De-cision Making, 304, 93–99, 2006.
Madsen, H. and Vinter, B.: Parameter optimisation in complex hydrodynamic and hydrological modelling systems using dis-tributed computing, 7th International Conference on Hydroinfor-matics HIC 2006, Nice, France, 2489–2496, 2006.
Mason, D. C., Bates, P. D., and Dall’ Amico, J. T.: Calibration of uncertain flood inundation models using remotely sensed water levels, J. Hydrol., 368, 224–236, 2009.
MRC: Annual Mekong Flood Report 2008, Mekong River Com-mission, Vientiane, 2009.
Ngo, L. L., Madsen, H., and Rosbjerg, D.: Simulation and optimisa-tion modelling approach for operaoptimisa-tion of the Hoa Binh reservoir, Vietnam, J. Hydrol., 336, 269–281, 2007.
Nien, N. A.: KOD model for flood computation in Cuu Long river delta., Proceedings of Conference on Flood Modeling in Cuu Long river delta, Ho Chi Minh city, 1996.
Pappenberger, F., Beven, K., Frodsham, K., Romanowicz, R., and Matgen, P.: Grasping the unavoidable subjectivity in calibration of flood inundation models: A vulnerability weighted approach, J. Hydrol., 333, 275–287, 2007a.
Pappenberger, F., Frodsham, K., Beven, K., Romanowicz, R., and Matgen, P.: Fuzzy set approach to calibrating distributed flood inundation models using remote sensing observations, Hydrol. Earth Syst. Sci., 11, 739–752, doi:10.5194/hess-11-739-2007, 2007b.
Pedersen, G. K. M. and Goldberg, D. E.: Dynamic Uniform Scaling for Multiobjective Genetic Algorithms, in: Proceedings 3103, Genetic and Evolutionary Computation Gecco, 11–23, 2004.
Reed, P., Kollat, J. B., and Devireddy, V. K.: Using
in-teractive archives in evolutionary multiobjective
optimiza-tion: A case study for long-term groundwater monitoring
design, Environmental Modelling & Software, 22, 683–692, doi:10.1016/j.envsoft.2005.12.021, 2007.
Sanders, B. F.: Evaluation of on-line DEMs for flood inundation modeling, Adv. Water Resour., 30, 1831–1843, 2007.
Schumann, G., Bates, P. D., Horritt, M. S., Matgen, P., and Pap-penberger, F.: Progress in integration of remote sensing derived flood extent and stage data and hydraulic models, Rev. Geophys., 47 , RG4001, doi:10.1029/2008RG000274, 2009a.
Schumann, G., Lunt, D. J., Valdes, P. J., de Jeu, R. A. M., Scipal, K., and Bates, P. D.: Assessment of soil moisture fields from imperfect climate models with uncertain satellite observations, Hydrol. Earth Syst. Sci., 13, 1545–1553, doi:10.5194/hess-13-1545-2009, 2009b.
2009c.
Shafii, M. and De Smedt, F.: Multi-objective calibration of a dis-tributed hydrological model (WetSpa) using a genetic algorithm, Hydrol. Earth Syst. Sci., 13, 2137–2149, doi:10.5194/hess-13-2137-2009, 2009.
Skahill, B. E. and Doherty, J.: Efficient accommodation of local minima in watershed model calibration, J. Hydrol., 329, 122– 139, 2006.
Solomatine, D. P., Dibike, Y. B., and Kukuric, N.: Automatic cal-ibration of groundwater models using global optimization tech-niques, Hydrol. Sci. J., 44, 879–894, 1999.
Srinivas, N. and Deb, K.: Multi-Objective function optimization using non-dominated sorting genetic algorithms, Evolutionary Computation, 2(3), 221–248, 1995.
Tang, Y., Reed, P., and Wagener, T.: How effective and effi-cient are multiobjective evolutionary algorithms at hydrologic model calibration?, Hydrol. Earth Syst. Sci., 10, 289–307, doi:10.5194/hess-10-289-2006, 2006.
Tang, Y., Reed, P. M., and Kollat, J. B.: Parallelization strategies for rapid and robust evolutionary multiobjective optimization in water resources applications, Adv. Water Resour., 30, 335–353, doi:10.1016/j.advwatres.2006.06.006, 2007.
Thuy, D. T. and Dac, N. T.: Modelling of flow and salinity in the Mekong Delta by SAL99 Model., Mekong River Commission, Phnom Penh, 225–235, 2000.
Vrugt, J. A., Gupta, H. V., Bastidas, L. A., Bouten, W., and Sorooshian, S.: Effective and efficient algorithm for multiobjec-tive optimization of hydrologic models, Water Resour. Res., 39, 1214, doi:1210.1029/2002WR001746, 2003.
Werner, M. G. F., Hunter, N. M., and Bates, P. D.: Identifiability of distributed floodplain roughness values in flood extent estima-tion, J. Hydrol., 314, 139-157, 2005.
Yapo, P. O., Gupta, H. V., and Sorooshian, S.: Multi-objective global optimization for hydrologic models, J. Hydrol., 204, 83– 97, 1998.