Hydrol. Earth Syst. Sci., 16, 391–407, 2012 www.hydrol-earth-syst-sci.net/16/391/2012/ doi:10.5194/hess-16-391-2012
© Author(s) 2012. CC Attribution 3.0 License.
Hydrology and
Earth System
Sciences
Sensitivity of SWAT simulated streamflow to climatic changes within
the Eastern Nile River basin
D. T. Mengistu1,2and A. Sorteberg2,3
1Arba Minch Institute of Technology, Arba Mich University, Ethiopia 2Geophysical Institute, University of Bergen, Norway
3Bjerknes Centre for Climate Research, University of Bergen, Norway
Correspondence to: D. T. Mengistu (dertes [email protected], [email protected])
Received: 6 September 2011 – Published in Hydrol. Earth Syst. Sci. Discuss.: 5 October 2011 Revised: 12 January 2012 – Accepted: 26 January 2012 – Published: 9 February 2012
Abstract. The hydrological model SWAT was run with daily station based precipitation and temperature data for the whole Eastern Nile basin including the three subbasins: the Abbay (Blue Nile), BaroAkobo and Tekeze. The daily and monthly streamflows were calibrated and validated at six out-lets with station-based streamflow data in the three different subbasins. The model performed very well in simulating the monthly variability while the validation against daily data revealed a more diverse performance. The simulations in-dicated that around 60 % of the average annual rainfalls of the subbasins were lost through evaporation while the esti-mated runoff coefficients were 0.24, 0.30 and 0.18 for Ab-bay, BaroAkobo and Tekeze subbasins, respectively. About half to two-thirds of the runoff could be attributed to surface runoff while the other contributions came from groundwater. Twenty hypothetical climate change scenarios (perturbed temperatures and precipitation) were conducted to test the sensitivity of SWAT simulated annual streamflow. The result revealed that the annual streamflow sensitivity to changes in precipitation and temperature differed among the basins and the dependence of the response on the strength of the changes was not linear. On average the annual streamflow responses to a change in precipitation with no temperature change were 19 %, 17 %, and 26 % per 10 % change in precipitation while the average annual streamflow responses to a change in temperature and no precipitation change were−4.4 % K−1,
−6.4 % K−1, and−1.3 % K−1 for Abbay, BaroAkobo and
Tekeze river basins, respectively.
47 temperature and precipitation scenarios from 19 AOGCMs participating inCMIP3 were used to estimate fu-ture changes in streamflow due to climate changes. The cli-mate models disagreed on both the strength and the direc-tion of future precipitadirec-tion changes. Thus, no clear conclu-sions could be made about future changes in the Eastern Nile streamflow. However, such types of assessment are impor-tant as they emphasise the need to use several an ensemble of AOGCMs as the results strongly dependent on the choice of climate models.
1 Introduction
the potential water resource management problems associ-ated with water supply, power generation, and agricultural practices as well as for future water resource planning, reser-voir design and management, and protection of the natural environment, it is necessary to provide quantitative estimates of the hydrological effects of climate change. In this regard as Taye et al. (2011) stated several studies have been con-ducted on the sensitivity of streamflow to climate changes for many parts of the Nile. Among these studies, Elsahmay et al. (2009) run an ensemble of climate change scenarios using the Nile Forecasting Model with bias corrected pre-cipitation and temperatures from 17 coupled general circu-lation models (AOGCMs) for the 2081–2098 period to as-sess the effects on the streamflow of the Blue Nile at Diem which belongs to Eastern Nile basin. One of the conclu-sions in Elshamy et al. (2009) was that the uncertainty in future precipitation change due to increased greenhouse gas emissions are large, making the future changes in streamflow very uncertain. Recently Taye et al. (2011) simulated the cli-mate change impact on hydrological extremes in two regions (Nyando basin found in white Nile and Lake Tana catchment located in upper Blue Nile subbasin) and noted that for Lake Tana catchment the GCM uncertainty was more important than the hydrological models uncertainty.
Abbay (Blue Nile), BaroAkobo (Sobat) and Tekeze (At-bara) are the three major river basins in the Eastern Nile which all originated from the Ethiopian Highlands. 86 % (or 82 km3)of the total average flow of the Nile at Aswan is esti-mated to origin from these three river basins (Arsano, 2005). Several attempts have been made to implement hydrological models for the Blue Nile basin. Sutcliffe et al. (1989) and Dugale et al. (1991) used a simple daily hydrological model calibrated by METOSAT derived rainfall estimates and the National Oceanic and Atmospheric Administration, USA in collaboration with the Egyptian Ministry of Public Works has developed a comprehensive model of the Nile to predict the inflow to the Aswan Dam (Barrett et al., 1993; Schaake et al., 1993; Johanson and Curtis, 1994; Todd et al., 1995). How-ever, as Conway (1997) stated, both of these investigations suffered by the lack of in situ data, in particular subbasin dis-charge data to calibrate the hydrological models and gauge estimates of daily rainfall to calibrate the METEOSAT de-rived estimates of rainfall. Conway (1997) applied a grid-based water balance model with limited meteorological and hydrological data inputs on a monthly time step for the Blue Nile catchment. According to Conway (1997) the correlation between observed and simulated annual flows was 0.74 for a 76-yr data period and the mean error was 14 %, although relatively large errors occurred in individual years. Further-more, Mohamed et al. (2005) focused on the interaction be-tween the climatic processes and the hydrological processes on the land surface in the subbasins of Nile (White, Blue Nile, Atbara and the main Nile) using a regional atmospheric model to show that the model could reproduce runoff reason-ably well over the subbasins of the Nile. The above studies
except the latter, have all been investigating the upper Blue Nile basin but there are still very few published studies on the two other basins (Tekeze and BaroAkobo). Recently, Sete-gen et al. (2008) investigated the Lake Tana Basin (part of the Blue Nile) using the hydrological model (SWAT) and stud-ies applying the same model have also been conducted for the Meki basin (Central Ethiopia) and the upper Awash basin (western catchment of the Awash basin in Ethiopia) by Zeray et al. (2007) and Checkol (2006), respectively. These three studies showed that the SWAT model was able to describe the study areas with a quality that makes it suitable for water resource management use.
The aim of this paper is to test the applicability of the Soil and Water Assessment Tool (SWAT) physically distributed model over the three major subbasins in Eastern Nile at larger watershed scale and thereby complementing other older stud-ies that have simulated parts of the catchment. Sensitivity studies to assess the potential impacts of climate change on the annual streamflow is performed using twenty hypothet-ical climate change perturbations in temperature, precipita-tion or both. In addiprecipita-tion, the sensitivities found above to-gether with 47 temperature-precipitation scenarios from 19 AOGCMs which were participating inpahse 3 of the Cou-pled Model Inercomparison Project (CMIP3) are used to as-sess the uncertainty in future streamflow changes for the Eastern Nile.
2 Description of the study area
The Eastern Nile and their tributaries all originate on the Ethiopian plateau and the three subbasins of the Eastern Nile lies between 5◦N 330E and 15◦N 390E with altitude ranges
from 390 m in part of BaroAkobo to over 4500 m in the Tekeze river basin (MoWR, 2002). The total average annual flows are estimated to be 50.0, 23.6 and 8.2 billion cubic me-ters from the Abbay, BaroAkobo and Tekeze river basins, respectively (Arsano et al., 2004; MoWR, 2002). They pro-vide 86 % of the waters of the Nile (Abbay 59 %, BaroAkobo 14 %, Tekeze 13 %, Swain, 1997).
D. T. Mengistu and A. Sorteberg: Sensitivity of SWAT simulated streamflow to climatic changes 393
There are numerous tributaries of Abbay between Lake Tana and the Sudanese border. Some of these are Bashilo, Walaka, Jamma, Muger, Guder, Anger, Didessa, and Dabus Rivers from the left bank, and Muga, Temcha, Lah, Chamoga, Fettam and Beles Rivers from right bank of the main Abbay River. After flowing past Roseires inside Su-dan, the Blue Nile joins the White Nile at Khartoum and, as the River Nile, flows through Egypt to the Mediterranean Sea at Alexandria. Due to the high seasonal variability in rainfall over the Ethiopian plateau, the seasonal variation of the flow of the Abbay is large with maximum runoff is in August when it is about 60 times greater than its minimum in the month of February (Arsano, 2005).
The Baro-Akobo (Sobat) river system marks a 380 km frontier between Ethiopia and Sudan and originates in the Western Ethiopian Highlands. The Baro River is created by the confluence of the Birbir and Gebba Rivers, east of Metu in the Illubabor Zone of the Oromia Region, Ethiopia. It then flows west through the Gambela Region to join with the Pi-bor River from Sudan and Rivers from Northern Uganda to form the Sobat. Other notable tributaries of the Baro include the Alwero and Gilo Rivers. Of the Sobat River tributaries, the Baro River is the largest, contributing 83 % of the total water flowing into the Sobat. During the rainy season, be-tween June and October, the Baro River alone contributes about 14 % of the Nile’s water at Aswan, Egypt. In contrast, these rivers have very low flow during the dry season.
The Tekeze (Atbara), rises in Northern Ethiopia Highlands and have the Angereb and Guang as its major tributaries, it replenishes the main Nile north of Khartoum. The Tekeze joins the Atbara River after entering northeastern Sudan. The climatic pattern and physical environment of the Tekeze sub-system are very similar to those of the Abbay subbasin.
The climate varies from warm, desert-like climate at the Sudan border, to wet in the Ethiopian Highlands. The annual rainfall ranges from 800 mm to 2200 mm with an average of about 1420 mm for the Abbay river basin. The annual rainfall reaches at maximum of 3000 mm over the highlands and a minimum of 600 mm in the lowlands with annual average rainfall of about 1419 for the case of BaroAkobo Basin. In contrast to the Abbay and BaroAkobo river basins, the annual rainfall for Tekeze is much lower, ranging from 600 mm to 1200 mm with an average of about 900 mm. Most of rainfall occurs from June to September for all the three subbasins (MoWR, 2002).
3 Methods and materials
3.1 Model description
We used the physically based, distributed parameter model-SWAT (Soil and Water Assessment tool, version model-SWAT2005) which operates on daily time step and uses physiographical
data such as elevation, land use and soil properties as well as meteorological data and, river discharge data for calibration (Arnold and Allen, 1996).
3.2 Hydrological processes
The hydrological processes included in the model are evap-otranspiration (ET), surface runoff, infiltration, percolation, shallow and deep aquifers flow, and channel routing (Arnold et al., 1998). The effects of spatial variations in topogra-phy, land use, soil and other characteristics of watershed hydrology are incorporated by dividing a basin into several subbasins based on drainage areas of tributaries and is fur-ther divided the subbasins into a number of hydrological response unit (HRUs) within each subbasin, based on land cover and soils. Each HRU is assumed spatially uniform in terms of land use, soil, topography and climate. The subdivi-sion of the watershed enables the model to reflect differences in evapotranspiration for various crops and soils. All model computations are performed at the HRUs level.
The fundamental hydrology of a watershed in SWAT is based on the following water balance equation
∂SW
∂t =Rday−Qsurf−Ea−Wseep−Qgw (1) Where SW is the soil water content (mm),Rdayis the amount
of precipitation on (mm), Qsurf is the amount of surface
runoff (mm),Ea is the amount of evapotranspiration (mm),
Wseepis the amount of water entering the vadose zone from
the soil profile (mm), andQgwis the amount of ground flow
(mm). A detail descriptions of the different model compo-nents can be found in Arnold et al. (1998) and Neitsch et al. (2002a).
3.3 Physiographical data for the three subbasins
A range of spatially distributed data such as topographic fea-tures, soil types, land use and the stream network (optional) are needed for the model. Table 1 summarizes the input data use in the AVSWAT-X interface.
3.3.1 Digital elevation model
A DEM was created using a 1 km2 resolution topographic database obtained from the Ethiopian Ministry of Water Re-sources. The DEM (see Fig. 2) was used to delineate the wa-tershed and the drainage patterns of the surface area analysis. Subbasin parameters such as slope gradient, slope length of the terrain, and the stream network characteristics such as channel slope, length, and width were derived from DEM. 3.3.2 Land use and soil maps
Table 1. Data sources for the Eastern Nile basin.
Data Type Scale Data Descriptions
DEM 1 km×1 km Elevation data from Ethiopia ministry (Topographical data) of water resources
Soil 10 km×10 km Soil texture data from ministry of water resources supplemented by the FAO soil data base
Land use 1 km×1 km Land classification and their attributes from Ethiopia ministry of water resources
Figure 1: map showing an outline of Ethiopia and the water sources of Eastern Nile basin including stream gauges at the major tributaries (dots) and stream gauges for calibration and validation of the model (boxes).
! " " " " ! " " " " " ! " ! !" " " " " " " " ! " " " " !! " #$%$&$ ! '() %(!( '*!! +*,( +$! $& - +( -+ .('*$ +/$! & '$0 1)234 -+ '$! 35) %(!( ,5#676)1% #6761!689 !! "1%:; ! '(1*<67 ! '(1!=7> +$-4 .(/ #$%$&$1/? #$%$&$1$@ #$%$&$1": +/$! 10:A 2<B:6@)>6?>:; " +$!
" $& -
" +$-4 .(/
" ! '(1!=7>
" +$0$'(
" +/$! 10:A
" +/$!
" -+ '$! " ,5#676)1%
" +30 '
" '*!!
" #$%$&$1/?
" .('*$
" ,5#6761)+
" 35) %(!(
" #6761!689
" & '$0
" 0$+$C/
" +( -+
" #$%$&$1":
" ! '(1*<67 !
1)234 -! !! "1)!6 ! !! "1%:; ! ! '(1+6@D !
+*,( ! #$%$&$1$@
,6A:)#676 $<8)E5;8F
GHH H GHH IHH %9J=@:<:B;
! ! "# "# "! "! ! ! $# $# $! $! ! " " " " ! " " " " " ! " ! !" " " " " " " " ! " " " " !! " #$%$&$ ! '() %(!( '*!! +*,( +$! $& - +( -+ .('*$ +/$! & '$0 1)234 -+ '$! 35) %(!( ,5#676)1% #6761!689 !! "1%:; ! '(1*<67 ! '(1!=7> +$-4 .(/ #$%$&$1/? #$%$&$1$@ #$%$&$1": +/$! 10:A 2<B:6@)>6?>:; " +$!
" $& -
" +$-4 .(/
" ! '(1!=7>
" +$0$'(
" +/$! 10:A
" +/$!
" -+ '$! " ,5#676)1%
" +30 '
" '*!!
" #$%$&$1/?
" .('*$
" ,5#6761)+
" 35) %(!(
" #6761!689
" & '$0
" 0$+$C/
" +( -+
" #$%$&$1":
" ! '(1*<67 ! 1)234 -! !! "1)!6 ! !! "1%:; ! ! '(1+6@D !
+*,( ! #$%$&$1$@
,6A:)#676 $<8)E5;8F
GHH H GHH IHH %9J=@:<:B;
! ! "# "# "! "! ! ! $# $# $! $!
Fig. 1. Map showing an outline of Ethiopia and the water sources of
Eastern Nile basin including stream gauges at the major tributaries (dots) and stream gauges for calibration and validation of the model (boxes).
land use map of the study is the Ministry of Water Resources Ethiopia and land use/land cover map was taken from the global Hydro1K dataset (Hansen, 1998) and modified to cor-respond with the SWAT predefined land uses classification (Fig. 3).
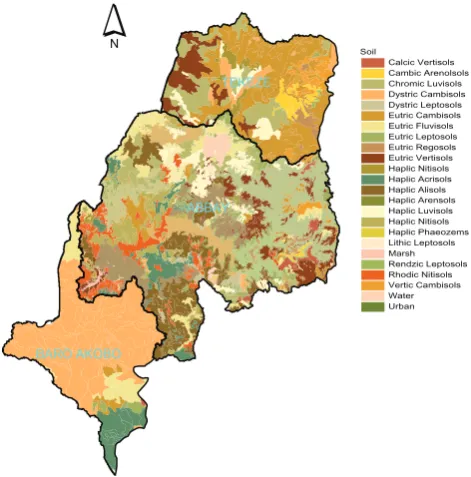
[image:4.595.51.289.194.427.2]More than 50 %, 23 % and 15.7 % of Abbay, Tekeze and BaroAkobo subbasin, respectively, are used for agriculture whereas forest, grass, bush and shrubs cover the rest. For detail see Fig. 3. Land use of the study area has changed over time (Rientjes et al., 2011) due to over increasing population density, changing agricultural practices, urban-ization and water related infrastructure such as irrigation and hydropower production. As no detailed mapping of these changes exists for the whole region it is not taken into account.
Fig. 2. Topography (m) of the eastern Nile basin based on a 1×1 km digital elevation model.
[image:4.595.313.540.224.474.2]D. T. Mengistu and A. Sorteberg: Sensitivity of SWAT simulated streamflow to climatic changes 395
Fig. 3. Map of landuse of the three sub-basins of the Eastern Nile
(Tekeze, Abbay and Baro Akobo).
!! "
! #$% &$!$
'(&()(
!"#
$%#&"&'()*+",!#, $%-."&'/*)0!#,!#, $1*!-"&'234",!#, 56,+*"&'$%-.",!#, 56,+*"&'2)7+!,!#, 83+*"&'$%-.",!#, 83+*"&'9#34",!#, 83+*"&'2)7+!,!#, 83+*"&':);!,!#, 83+*"&'()*+",!#, <%7#"&'="+",!#, <%7#"&'/&*",!#, <%7#"&'/#",!#, <%7#"&'/*)0,!#, <%7#"&'234",!#, <%7#"&'="+",!#, <%7#"&'>1%)!?)-, 2"+1"&'2)7+!,!#, @%*,1
:)0A?"&'2)7+!,!#, :1!A"&'="+",!#, ()*+"&'$%-.",!#, B%+)* C*.%0 /..%6 D%*!'/E!.!F G)E)?) *
Figure 4: Map of soil types of the three sub-basins of the Eastern Nile (Tekeze, Abbay and Baro Akobo).
!! "
! #$% &$!$
'(&()(
!"#
$%#&"&'()*+",!#, $%-."&'/*)0!#,!#, $1*!-"&'234",!#, 56,+*"&'$%-.",!#, 56,+*"&'2)7+!,!#, 83+*"&'$%-.",!#, 83+*"&'9#34",!#, 83+*"&'2)7+!,!#, 83+*"&':);!,!#, 83+*"&'()*+",!#, <%7#"&'="+",!#, <%7#"&'/&*",!#, <%7#"&'/#",!#, <%7#"&'/*)0,!#, <%7#"&'234",!#, <%7#"&'="+",!#, <%7#"&'>1%)!?)-, 2"+1"&'2)7+!,!#, @%*,1 :)0A?"&'2)7+!,!#, :1!A"&'="+",!#, ()*+"&'$%-.",!#, B%+)* C*.%0 /..%6 D%*!'/E!.!F G)E)?) *
Fig. 4. Map of soil types of the three sub-basins of the Eastern Nile
(Tekeze, Abbay and Baro Akobo).
3.3.3 Meteorological data
SWAT requires daily meteorological data, which were col-lected from the Ethiopian National Meteorological Agency (NMSA) for the period 1987–2006. We use 60 and 97 sta-tions with temperature and precipitation, respectively. Fig-ure 5 shows the stations used in this study and Table 2
sum-Figure 5: Main rivers and meteorological stations in the eastern Nile basin. !
! !
!
!
! !
!
! !
! !
! !
! !
! !
!
! !
! ! !
! !
! !
! ! !
! ! !
!! " #$%$&$
! '() %(!(
!! ! !! "!!#$%&'()(*+ *
Temperature stations
Rainfall stations
Fig. 5. Main rivers and meteorological stations in the eastern Nile
basin.
marize the number of stations in each subbasin. The average percentage of missing data in the observed datasets was less than 10 % and 5 % of precipitation and temperature, respec-tively. Missing values were filled using the SWAT built-in weather generator developed by Nicks (1974). The weather generator used a first-order Markov chain model. For each subbasin input to the weather generator was observed pre-cipitation data for the weather station that was nearest the centroid of the subbasin and having a record length from 1967–2006. Given the observed wet and dry days frequen-cies, the model determine stochastically if precipitation oc-curs or not. When a precipitation event ococ-curs, the amount is determined by generating values from a skewed normal daily precipitation distribution or a modified exponential dis-tribution which is calculated based on the observed data. The amount of daily precipitation is partitioned between rainfall and snowfall using average daily air temperature.
3.3.4 River discharge
Hydrological discharge data were collected from the Min-istry of Water Resources of Ethiopia. Table 3 summarizes the number of stream gauges with the date of the record length used for calibration and validation. All the flow data were daily except at Diem (Abbay, Sudan Border) where only monthly data was available.
3.4 Model setup
[image:5.595.311.542.64.261.2] [image:5.595.49.285.335.574.2]Table 2. Meteorological data sources for Eastern Nile basin.
Data type Number of stations Data descriptions
Temperature Abbay; 42 stations Daily data from the Ethiopian (TmaxandTmin) BaroAkobo; 8 stations National Meteorological Agency
Tekeze; 10 stations (NMSA)
Precipitation Abbay; 74 stations Daily data from the Ethiopian BaroAkobo; 12 stations National Meteorological Agency Tekeze; 11station (NMSA)
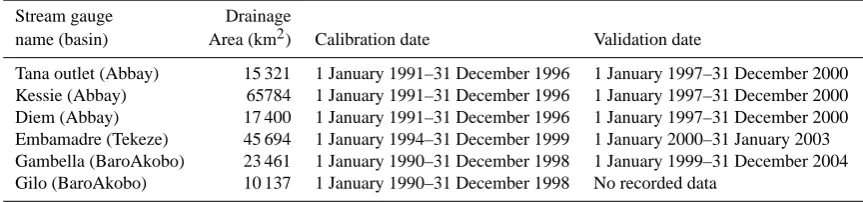
Table 3. Streams gauges and their corresponding drainage area with calibration and validation dates used for model simulations.
Stream gauge Drainage
name (basin) Area (km2) Calibration date Validation date
Tana outlet (Abbay) 15 321 1 January 1991–31 December 1996 1 January 1997–31 December 2000 Kessie (Abbay) 65784 1 January 1991–31 December 1996 1 January 1997–31 December 2000 Diem (Abbay) 17 400 1 January 1991–31 December 1996 1 January 1997–31 December 2000 Embamadre (Tekeze) 45 694 1 January 1994–31 December 1999 1 January 2000–31 January 2003 Gambella (BaroAkobo) 23 461 1 January 1990–31 December 1998 1 January 1999–31 December 2004 Gilo (BaroAkobo) 10 137 1 January 1990–31 December 1998 No recorded data
as a function of 2 % land use and 5 % soil types within a given watershed, respectively were delineated up to the point of outlets for each subbasin. These points constituent of a drainage area of 174 000, 43 906, and 76 343 km2 that drain about 86 %, 60 % and 93 % of the entire Ab-bay (201 340 km2), BaroAkobo (74 102 km2) and Tekeze
(82 350 km2) subbasins, respectively which all are found in Ethiopia.
The Soil Conservation Service (SCS) curve number pro-cedure (USDA-SCS,1972) was applied to estimate surface runoff volumes due to the unavailability of sub daily rainfall data required for the Green and Ampt method that SWAT of-fers a different option to estimate surface runoff. The poten-tial evapotranspiration (PET) estimates and channel routing were performed using Hargreaves and Muskingum methods, respectively.
3.5 Sensitivity analysis
After pre-processing of the data and SWAT model set up, simulation was done for the periods indicated in Table 3 for the three subbasins. The built-in SWAT sensitivity anal-ysis tool that uses the Latin Hypercube One-factor-AT-a-Time (LH-OAT) (Van Griensvenet al., 2002, 2005) was used. Six outlets (Fig. 1) were selected for the sensitivity analy-sis; three of them (Tana outlet, Kessie and Diem) in the Ab-bay, and two in BaroAkobo (Gambella and Gilo) and one in Tekeze (Embamadre).
According to Lenhart et al. (2002) the sensitivity of a flow to a parameter can be categorized into four classes. If the rel-ative sensitivity lies between 0–0.05 and 0.05–0.2, then the parameter are classified as negligible and medium, respec-tively, whereas if it is varying between 0.2–1.0 and greater than 1 then categorized as high and very high class, respec-tively. Out of 28 selected parameters the curve number, avail-able water capacity, average slope steepness, saturated hy-draulic conductivity, soil evaporation compensation factor, soil depth, maximum canopy storage, threshold water depth in the shallow aquifer for flow, and baseflow alpha factor were identified as being parameters to which the flow has medium, high or very high sensitivity. The ranking of the parameters were different at various outlets where sensitiv-ity test was carried out. However the curve number (CN2)
[image:6.595.79.511.236.337.2]D. T. Mengistu and A. Sorteberg: Sensitivity of SWAT simulated streamflow to climatic changes 397
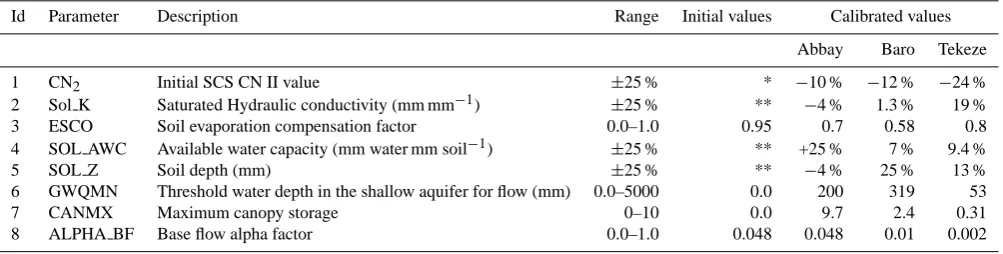
Table 4. List of adjusted parameters with calibrated values after manual and automatic calibration at the selected outlets for three subbasins
of Eastern Nile using SWAT 2005 model.
Id Parameter Description Range Initial values Calibrated values
Abbay Baro Tekeze
1 CN2 Initial SCS CN II value ±25 % * −10 % −12 % −24 %
2 Sol K Saturated Hydraulic conductivity (mm mm−1) ±25 % ** −4 % 1.3 % 19 %
3 ESCO Soil evaporation compensation factor 0.0–1.0 0.95 0.7 0.58 0.8
4 SOL AWC Available water capacity (mm water mm soil−1) ±25 % ** +25 % 7 % 9.4 %
5 SOL Z Soil depth (mm) ±25 % ** −4 % 25 % 13 %
6 GWQMN Threshold water depth in the shallow aquifer for flow (mm) 0.0–5000 0.0 200 319 53
7 CANMX Maximum canopy storage 0–10 0.0 9.7 2.4 0.31
8 ALPHA BF Base flow alpha factor 0.0–1.0 0.048 0.048 0.01 0.002
The ranges are based primarily on recommendations given in the SWAT User’s Manual (Neitsch et al., 2002a).∗SWAT default parameters and SWAT driven parameters were used.
∗∗Field measured and from literature collected parameters.
3.6 Calibration and validation
Watershed models contain many parameters; these parame-ters are classified into two groups: physical and process pa-rameters. A physical parameter represents physically mea-surable properties of the watershed (e.g. areas of the catch-ment, fraction of impervious area and surface area of wa-ter bodies, surface slope etc) while process paramewa-ters rep-resents properties of the watershed which are not directly measurable e.g. average or effective depth of surface soil moisture storage, the effective lateral inflow rate, the coef-ficient of non-linearity controlling the rate of percolation to the groundwater (Sorooshian and Gupta, 1995). Thus, cali-brations against available streamflow observations are often conducted to tune the model. Because automatic calibration relies heavily on the optimization algorithm and the spec-ified objective function we follow the recommendations of Gan (1998) to use both manual and automatic calibration procedures. We first conducted manual calibration of daily stream using the procedure developed by Santhi et al. (2001). Parameters identified from the sensitivity analysis were var-ied in sequence of their relative sensitivity within their ranges (Table 4) until the volume is adjusted to the required quan-tity (Zeray et al., 2007).This process continued till the vol-ume simulated is within±15 % of the gauged volume.The surface runoff adjustment was then followed by that of the baseflow. Here,the same apporach was followed being the adjustment made to the most sensitivity parameters affecting the baseflow. Each time the baseflow calibration is finalized, the surface runoff volume was also checked as adjustment of the baseflow parameters can also affect the surface runoff volume. The same procedure was followed to calibrate the water balance of the monthly flows. After each calibartion, the coefficient of determintation (proportion of the variance in the observations explained by the model,R2)and Nash-Sutcliffe effficeny value (ENS) were checked (R2>0.6 and
ENS>0.5, Santhi et al., 2001). Finally, the automatic cal-ibration algorithm in SWAT is used for fine tuning the cali-bration.This is based on the Shuffled Complex Evolution al-gorithm developed at the University of Arizona (SCE-UA) which is a global search algorithm that minimizes a single objective function for up to 16 model parameters (Duan et al., 1992).
The performance of SWAT was evaluated using the Nash-Sutcliffe efficiency value (ENS) and the coefficient of deter-mination (R2). The difference between the ENS and theR2 is that the ENS can interpret the model performance in the replicating individually observed values while theR2 does not (Rossi et al., 2008). It is only measuring the deviation from the best fit line. In addition systematic difference be-tween the model and observations in the percentage (PBias) and the ratio of the root mean square error between the sim-ulated and observed values to the standard deviation of the observations (RSR) was used. The equations and the inter-pretation of the values are given in Table 5. After manual and automatic calibration the daily, monthly and annual stream-flow were compared against the observed data.
3.7 Climate sensitivity scenarios
Table 5. General reported ratings for Nash-Sutcliffe efficiency (ENS) , Mean relative bias (PBIAS), Root mean square error-standard
deviation ratio (RSR) and Coefficient of determination (R2)for calibration and validation process (adopted from Rossi et al., 2008).
Formulae Value Rating
>0.65 Very good
ENS = 1−
n P
i=1
(xobs(i)−ymod el(i))2
n P
i=1
(xobs(i)−xobs)2
0.54 to 0.65 Adequate
>0.50 Satisfactory
<±20 % Good
PBIAS=
n P
i=1
(xobs(i)−ymod el(i))
n P
i=1
(xobs(i))
·100
±20 % to 40 % Satisfactory
>±40 % Unsatisfactory
0.0≤RSR≤0.5 Very good
0.5<RSR≤0.6 Good
RSR=
"s n P
i=1
(xobs(i)−ymod el(i))2
#
s n P
i=1
(xobs(i)−xobs)2 0.6<RSR≤0.7 Satisfactory
RSR≥0.70 Unsatisfactory
R2=
n
P
i
(xobs(i)−xobs)(ymod el(i)−ymodel)
2
n P
i
(xobs(i)−xobs)2
n P
i
(ymod el(i)−ymod el)2
Satisfactory
−5 %, 0 %, +5, +10 % and +20 % and combination of the above temperature and precipitation perturbations. Climatic variables such as relative humidity, wind speed, cloud cover and solar radiation were considered to be unchanged.
The CMIP3 (Meehl et al., 2007) global coupled climate models (AOGCMs) were also applied to calculate annual mean temperature and precipitation changes from the base period 1980–2000 to 2080–2100 for the three subbasins. A total of 47 climate change simulations were assessed for each subbasin using three different emission scenarios (SRES A2, A1B and B1) and 19 models. Together with the sensitiv-ity tests mentioned above and estimate of the impact of the AOGCMs temperature and precipitation changes on the an-nual streamflow of the different subbasins were conducted. 3.8 Sensitivity of annual streamflow to climate change
The relative sensitivity of the streamflow (1Q1P ,1T)to
ei-ther a precipitation (1P )or a temperature (1T )change or a combination of the two is calculated as:
1Q1P ,1T =
Q1P ,1T−Q1P=0,1T=0
Q1P=0,1T=0
·100 (2)
where Q is the annual or seasonal streamflow calculated using Eq. (1).
To be able to investigate if there is any nonlinearity in the streamflow change when both precipitation and temperature are changed we estimate the linear combination of the two.
1Q1T ,1P=
∂Q ∂P
1P ,1T=0
1P+∂Q
∂T
1T ,1P=0
1T (3)
where the local derivatives for each parameter is calculated as the sensitivity response when the other factor is kept unchanged. For example (∂Q/∂P )|
1P ,1T=0 are the
re-sponses in m3/% of the simulations covering the precipi-tation perturbations ±5, 10 and 20 % and no temperature perturbation. Any deviation from this will indicate nonlin-ear effects that may arise as precipitation and temperature is changed simultaneously.
4 Results and discussion
D. T. Mengistu and A. Sorteberg: Sensitivity of SWAT simulated streamflow to climatic changes 399
Figure 6: Daily observed (blue) and simulated (red) streamflow during the calibration and
validation periods for the (a) Baro Akobo at Gambella and (b) Tekeze at Embamadre.
Ϭ ϱϬϬ ϭϬϬϬ ϭϱϬϬ ϮϬϬϬ
ϭϱ͘Ϭϴ͘ϭϵϵϬ ϭϭ͘Ϭϱ͘ϭϵϵϯ Ϭϱ͘ϬϮ͘ϭϵϵϲ Ϭϭ͘ϭϭ͘ϭϵϵϴ Ϯϴ͘Ϭϳ͘ϮϬϬϭ Ϯϯ͘Ϭϰ͘ϮϬϬϰ
Ă ŝů LJ Z Ƶ Ŷ Ž ĨĨ
;Đ
Ƶ
ŵ
Ğ
ĐƐ
Ϳ
KďƐĞƌǀĞĚ
^ŝŵƵůĂƚĞĚ
sĂůŝĚĂƚŝŽŶƉĞƌŝŽĚ
ĂůŝďƌĂƚŝŽŶƉĞƌŝŽĚ
Ϭ ϱϬϬ ϭϬϬϬ ϭϱϬϬ ϮϬϬϬ ϮϱϬϬ ϯϬϬϬϭϵ͘Ϭϴ͘ϭϵϵϯ Ϭϴ͘Ϭϵ͘ϭϵϵϱ Ϯϳ͘Ϭϵ͘ϭϵϵϳ ϭϳ͘ϭϬ͘ϭϵϵϵ Ϭϱ͘ϭϭ͘ϮϬϬϭ Ϯϱ͘ϭϭ͘ϮϬϬϯ
Ă ŝů LJ ƌ Ƶ Ŷ Ž ĨĨ ;Đ Ƶ ŵ Ğ ĐƐ Ϳ
ĂƚĞ
KďƐĞƌǀĞĚ
^ŝŵƵůĂƚĞĚ
ĂůŝďƌĂƚŝŽŶƉĞƌŝŽĚ
sĂůŝĚĂƚŝŽŶƉĞƌŝŽĚ
Ϭ ϮϬϬϬ ϰϬϬϬ ϲϬϬϬ ϴϬϬϬŶŽǀ͘ϵϬ ĂƉƌ͘ϵϮ ĂƵŐ͘ϵϯ ũĂŶ͘ϵϱ ŵĂŝ͘ϵϲ ƐĞƉ͘ϵϳ ĨĞď͘ϵϵ ũƵŶ͘ϬϬ ŶŽǀ͘Ϭϭ
D Ž Ŷ ƚŚ ůLJ Z Ƶ Ŷ Ž ĨĨ ; ĐƵ ŵ Ğ ĐƐ Ϳ KďƐĞƌǀĞĚ ^ŝŵƵůĂƚĞĚ
ĂůŝďƌĂƚŝŽŶƉĞƌŝŽĚ
sĂůŝĚĂƚŝŽŶƉĞƌŝŽĚ
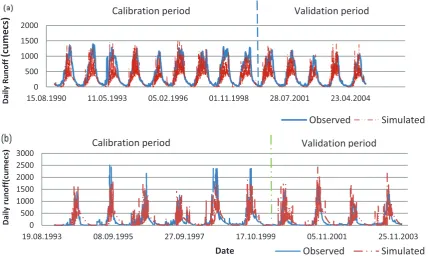
Fig. 6. Daily observed (blue) and simulated (red) streamflow during the calibration and validation periods for the (a) Baro Akobo at Gambella
and (b) Tekeze at Embamadre.
precipitation changes from the CMIP3 coupled climate mod-els to investigate the range of possible streamflow responses given the uncertainty in the global model’s temperature and precipitation change.
4.1 Model calibration and validation
4.1.1 Abbay calibration and validation
The model was calibrated for the Abbay subbasin with one upstream (Tana), one mid-way (Kessie) and one downstream (at the Sudan Border) gauging station. It slightly overes-timated the flow in the upper and middle part of the basin and underestimated it in the lower part (Table 6) during the calibration period (the calibration and validations periods are given in Table 3). The overestimation of these simula-tions was particularly pronounced during extreme events (not shown). However, there were good agreements between sim-ulated and observed flows on both daily and monthly time scale (Fig. 7a) for most of the years except 1995, when little precipitation was recorded at Tana outlet. The ENS andR2 ranged from 0.62 to 0.90 and 0.90 to 0.97, respectively for the monthly calibration (see Table 7 for further details). The daily calibration statistics were lower ranging from 0.62 to 0.65 and 0.77 for ENS andR2, respectively (see Table 6).
In the validation period, the model similarly overestimated the flow at Tana outlet and at Kessie for the year 2000 giving a slightly higher bias than in the validation period. Thus, the daily and monthly ENS simulation efficiency was between 0.55 to 0.57 and. 0.53 to 0.65, respectively.
4.1.2 BaroAkobo calibration and validation
[image:9.595.84.513.64.320.2]400 D. T. Mengistu and A. Sorteberg: Sensitivity of SWAT simulated streamflow to climatic changes
Figure 6: Daily observed (blue) and simulated (red) streamflow during the calibration and validation periods for the (a) Baro Akobo at Gambella and (b) Tekeze at Embamadre.
Ϭ ϱϬϬ ϭϬϬϬ ϭϱϬϬ
ϭϱ͘Ϭϴ͘ϭϵϵϬ ϭϭ͘Ϭϱ͘ϭϵϵϯ Ϭϱ͘ϬϮ͘ϭϵϵϲ Ϭϭ͘ϭϭ͘ϭϵϵϴ Ϯϴ͘Ϭϳ͘ϮϬϬϭ Ϯϯ͘Ϭϰ͘ϮϬϬϰ
Ă
ŝů
LJ
Z
Ƶ
Ŷ
Ž
ĨĨ
;Đ
Ƶ
ŵ
Ğ
KďƐĞƌǀĞĚ ^ŝŵƵůĂƚĞĚ
Ϭ ϱϬϬ ϭϬϬϬ ϭϱϬϬ ϮϬϬϬ ϮϱϬϬ ϯϬϬϬ
ϭϵ͘Ϭϴ͘ϭϵϵϯ Ϭϴ͘Ϭϵ͘ϭϵϵϱ Ϯϳ͘Ϭϵ͘ϭϵϵϳ ϭϳ͘ϭϬ͘ϭϵϵϵ Ϭϱ͘ϭϭ͘ϮϬϬϭ Ϯϱ͘ϭϭ͘ϮϬϬϯ
Ă
ŝů
LJ
ƌ
Ƶ
Ŷ
Ž
ĨĨ
;Đ
Ƶ
ŵ
Ğ
ĐƐ
Ϳ
ĂƚĞ KďƐĞƌǀĞĚ ^ŝŵƵůĂƚĞĚ
ĂůŝďƌĂƚŝŽŶƉĞƌŝŽĚ sĂůŝĚĂƚŝŽŶƉĞƌŝŽĚ
Ϭ ϮϬϬϬ ϰϬϬϬ ϲϬϬϬ ϴϬϬϬ
ŶŽǀ͘ϵϬ ĂƉƌ͘ϵϮ ĂƵŐ͘ϵϯ ũĂŶ͘ϵϱ ŵĂŝ͘ϵϲ ƐĞƉ͘ϵϳ ĨĞď͘ϵϵ ũƵŶ͘ϬϬ ŶŽǀ͘Ϭϭ
D
Ž
Ŷ
ƚŚ
ůLJ
Z
Ƶ
Ŷ
Ž
ĨĨ
;
ĐƵ
ŵ
Ğ
ĐƐ
Ϳ
KďƐĞƌǀĞĚ ^ŝŵƵůĂƚĞĚ
ĂůŝďƌĂƚŝŽŶƉĞƌŝŽĚ sĂůŝĚĂƚŝŽŶƉĞƌŝŽĚ
Figure 7: Monthly observed (blue) and simulated (black) streamflow for the calibration and
validation periods at (a) Diem (Abbay), (b) Gambella (Baro Akobo) and (c) Embamadre
(Tekeze).
Ϭ ϮϱϬ ϱϬϬ ϳϱϬ ϭϬϬϬ ϭϮϱϬ ϭϱϬϬ
ĂƉƌͲϭϵϴϵ ĚĞƐͲϭϵϵϭ ƐĞƉͲϭϵϵϰ ũƵŶͲϭϵϵϳ ŵĂƌͲϮϬϬϬ ĚĞƐͲϮϬϬϮ ƐĞƉͲϮϬϬϱ
D
Ž
Ŷ
ƚŚ
ůLJ
Z
Ƶ
Ŷ
Ž
ĨĨ
;Đ
Ƶ
ŵ
Ğ
ĐƐ
Ϳ
KďƐĞƌǀĞĚ ^ŝŵƵůĂƚĞĚ
ĂůŝďƌĂƚŝŽŶƉĞƌŝŽĚ sĂůŝĚĂƚŝŽŶƉĞƌŝŽĚ
Ϭ ϰϬϬ ϴϬϬ ϭϮϬϬ ϭϲϬϬ ϮϬϬϬ
ĂƵŐ͘ϵϯ ũĂŶ͘ϵϱ ŵĂŝ͘ϵϲ ƐĞƉ͘ϵϳ ĨĞď͘ϵϵ ũƵŶ͘ϬϬ ŶŽǀ͘Ϭϭ ŵĂƌ͘Ϭϯ
D
Ž
Ŷ
ƚŚ
ůLJ
Z
Ƶ
Ŷ
Ž
ĨĨ
;Đ
Ƶ
ŵ
Ğ
ĐƐ
Ϳ
KďƐĞƌǀĞĚ ^ŝŵƵůĂƚĞĚ
;ĐͿ
DŽŶƚŚ
ĂůŝďƌĂƚŝŽŶWĞƌŝŽĚ sĂůŝĚĂƚŝŽŶƉĞƌŝŽĚ
Fig. 7. Monthly observed (blue) and simulated (black) streamflow for the calibration and validation periods at (a) Diem (Abbay), (b) Gambella (Baro Akobo) and (c) Embamadre (Tekeze).
Table 6. Summary of daily streamflow statistics for the calibration and validation simulations for the Eastern Nile subbasins: ENS:
Nash-Sutcliffe efficiency, PBIAS: mean relative bias, RSR: root mean square error-standard deviation ratio andR2: coefficient of determination (see Table 5 for details).Dates for calibration and validation period is given in Table 3.
Location name (basin) Calibration Validation
ENS RSR PBIAS R2 ENS RSR PBIAS R2
[image:10.595.114.487.62.474.2] [image:10.595.121.478.573.669.2]D. T. Mengistu and A. Sorteberg: Sensitivity of SWAT simulated streamflow to climatic changes 401
Figure 8: Annual streamflow changes (%) to precipitation change (%) holding temperature fixed for the three basins.
Figure 9: Annual streamflow changes (%) to temperature change (°C) holding precipitation fixed for the three basins.
ͲϲϬ ͲϰϬ ͲϮϬ Ϭ ϮϬ ϰϬ ϲϬ ϴϬ
ͲϯϬ͕Ϭ ͲϮϬ͕Ϭ ͲϭϬ͕Ϭ Ϭ͕Ϭ ϭϬ͕Ϭ ϮϬ͕Ϭ ϯϬ͕Ϭ
^ ƚƌ Ğ Ă ŵ Ĩ ůŽ ǁ Đ Ś Ă Ŷ Ő Ğ ;й Ϳ WƌĞĐŝƉŝƚĂƚŝŽŶĐŚĂŶŐĞ;йͿ
ůƵĞEŝůĞ ĂƌŽŬŽďŽ dĞŬĞnjĞ
Ͳϴ͕Ϭ Ͳϲ͕Ϭ Ͳϰ͕Ϭ ͲϮ͕Ϭ Ϭ͕Ϭ Ϯ͕Ϭ
Ϭ ϭ Ϯ ϯ ϰ ϱ
^ ƚƌ Ğ Ă ŵ Ĩ ůŽ ǁ Đ Ś Ă Ŷ Ő Ğ ;й Ϳ dĞŵƉĞƌĂƚƵƌĞĐŚĂŶŐĞ;ϬĐͿ
ůƵĞEŝůĞ ĂƌŽŬŽďŽ dĞŬĞnjĞ
Fig. 8. Annual streamflow changes (%) to precipitation change (%)
holding temperature fixed for the three basins.
4.1.3 Tekeze calibration and validation
Calibration and validation of the Tekeze subbasin were car-ried out at Tekeze River near Embamadre and the predicted streamflow closely followed the measured flows, with an ENS of 0.8 and 0.5, and with a R2 of 0.81 and 0.60 for monthly and daily values during the calibration and valida-tion periods (Tables 7 and 6), respectively. Further, a bias of 2 % in the calibration period also indicated a good agreement between measured and simulated monthly flows (Table 7). 4.2 The annual water balance of the eastern Nile
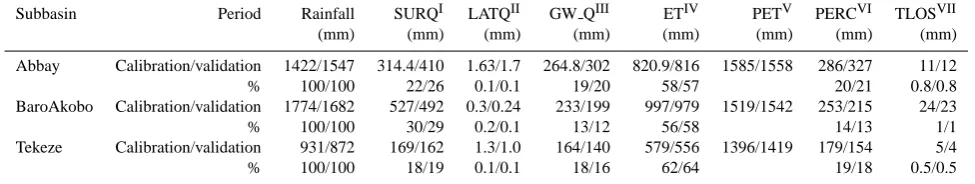
Table 8 illustrates the average annual water balance compo-nents of the Eastern Nile Basin during the calibration and val-idation periods. 58/57 percent (calibration period/valval-idation period), 56/58 percent and 62/64 percent of the average annual rainfalls were lost through evaporation in Abbay, BaroAkobo and Tekeze subbasin of the Eastern Nile dur-ing calibration and validation period, respectively. The av-erage runoff coefficients were estimated to be 0.24, 0.30 and 0.18 for Abbay, BaroAkobo and Tekeze subbasins respec-tively. Surface runoff carried 55/58.5 percent, 71.6/74 per-cent and 51/54 perper-cent of the water yield during the cali-bration and validation process for Abbay, BaroAkobo and Tekeze subbasins respectively. While, the groundwater con-tributions were 46/43 percent for Abbay, 31.7/30 percent for BaroAkobo and 50/47 percent for Tekeze during calibration and validation period respectively.
4.3 Sensitivity of annual Eastern Nile streamflow to climate change
[image:11.595.51.284.70.211.2]The impact of the perturbed temperature and precipitation scenarios on annual streamflows in the three subbasins are shown in Table 9 and details are given in the sections below.
Figure 8: Annual streamflow changes (%) to precipitation change (%) holding temperature fixed for the three basins.
Figure 9: Annual streamflow changes (%) to temperature change (°C) holding precipitation fixed for the three basins.
ͲϲϬ ͲϰϬ ͲϮϬ Ϭ ϮϬ ϰϬ ϲϬ ϴϬ
ͲϯϬ͕Ϭ ͲϮϬ͕Ϭ ͲϭϬ͕Ϭ Ϭ͕Ϭ ϭϬ͕Ϭ ϮϬ͕Ϭ ϯϬ͕Ϭ
^ ƚƌ Ğ Ă ŵ Ĩ ůŽ ǁ Đ Ś Ă Ŷ Ő Ğ ;й Ϳ WƌĞĐŝƉŝƚĂƚŝŽŶĐŚĂŶŐĞ;йͿ
ůƵĞEŝůĞ ĂƌŽŬŽďŽ dĞŬĞnjĞ
Ͳϴ͕Ϭ Ͳϲ͕Ϭ Ͳϰ͕Ϭ ͲϮ͕Ϭ Ϭ͕Ϭ Ϯ͕Ϭ
Ϭ ϭ Ϯ ϯ ϰ ϱ
^ ƚƌ Ğ Ă ŵ Ĩ ůŽ ǁ Đ Ś Ă Ŷ Ő Ğ ;й Ϳ dĞŵƉĞƌĂƚƵƌĞĐŚĂŶŐĞ;ϬĐͿ
ůƵĞEŝůĞ ĂƌŽŬŽďŽ dĞŬĞnjĞ
Fig. 9. Annual streamflow changes (%) to temperature change (◦C) holding precipitation fixed for the three basins.
4.3.1 Sensitivity to precipitation changes
Sensitivity of annual streamflow to changes in precipitation, holding the temperatures fixed (Eq. 2) was different among the three subbasins. As a first approximation, a linear re-gression analysis of the streamflow responses for the vari-ous scenarios indicated that a 10 % change in precipitation would produce a 19 %, 17 %, and 26 % change in streamflow for Abbay, BaroAkobo and Tekeze river basin respectively (Fig. 8). Table 9 and Fig. 10 shows that the Abbay subbasin is equally sensitive to a reduction and increase in precipitation and the sensitivity is changing linearly with the precipitation change. This was not the case for Tekeze. The sensitivity to a precipitation increase was larger than to a decrease in pre-cipitation (−42 % and 63 % change for a−20 % and +20 % precipitation changes, respectively). For the BaroAkobo sub-basin, this was the opposite. Sensitivity was stronger to a de-cline in precipitation (−38 % and 29 % for−20 and +20 % precipitation change, respectively). See Table 9 and Fig. 10 for details. The change in sensitivity was likely due to the difference in topography and catchment characteristics of the subbasins. In the case of Tekeze basin, most of the region is categorized with a gentle slope, where a sheetflow change is dominating during an increase in precipitation. This is in contrast to BaroAkobo where 2/3 of the total drainage area is a plain. The land use and soil types of the two basins are also quite different. The depth of the soil in the Tekeze subbasin is shallower than BaroAkobo subbasin. Therefore, with an increase in precipitation, the response of the catchment gen-erating direct streamflow will be smaller since more water infiltrated down to recharge the groundwater in the case of BaroAkobo subbasin. Thus, the sensitivity of BaroAkobo to an increase in precipitation will be smaller.
4.3.2 Sensitivity to temperature change
402 D. T. Mengistu and A. Sorteberg: Sensitivity of SWAT simulated streamflow to climatic changes
a.)
b.)
c.)
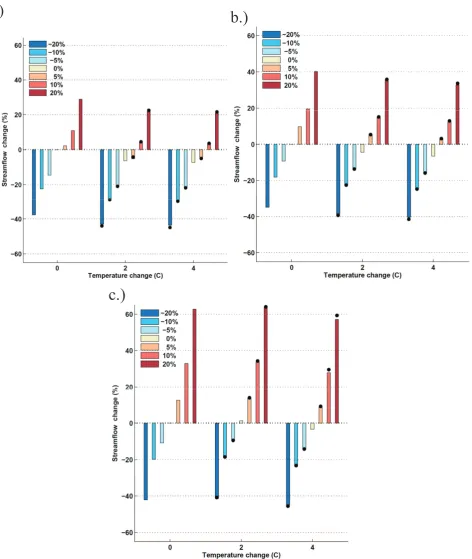
Figure 10: Change in annual streamflow (%) for different temperature and precipitation
scenarios. a) Baro Akobo, b) Abbay and c) Tekeze. Black dots indicate the linear sensitivity
a.)
b.)
c.)
Figure 10: Change in annual streamflow (%) for different temperature and precipitation
scenarios. a) Baro Akobo, b) Abbay and c) Tekeze. Black dots indicate the linear sensitivity
estimate based on equation 3.3.
b.)
c.)
Figure 10: Change in annual streamflow (%) for different temperature and precipitation
scenarios. a) Baro Akobo, b) Abbay and c) Tekeze. Black dots indicate the linear sensitivity
estimate based on equation 3.3.
Fig. 10. Change in annual streamflow (%) for different temperature and precipitation scenarios. (a) Baro Akobo, (b) Abbay and (c) Tekeze.
Black dots indicate the linear sensitivity estimate based on Eq. (3).
[image:12.595.68.541.90.650.2]D. T. Mengistu and A. Sorteberg: Sensitivity of SWAT simulated streamflow to climatic changes 403
Table 7. Summary of monthly streamflow statistics for the calibration and validation simulations for the Eastern Nile subbasins. ENS:
Nash-Sutcliffe efficiency, PBIAS: mean relative bias, RSR: root mean square error-standard deviation ratio andR2: coefficient of determination (see Table 5 for details). Dates for calibration and validation period are given in Table 3.
Location Calibration Validation
ENS RSR PBIAS R2 ENS RSR PBIAS R2
Tana outlet 0.85 0.32 7.2 0.90 0.53 0.71 21 0.86
Kessie 0.62 0.58 28 0.90 0.54 0.80 37 0.86
Diem 0.90 0.31 −11.3 0.97 0.65 0.39 8.2 0.92
Embamadre 0.80 0.45 2.2 0.81 0.83 0.42 −13.9 0.88 Gambella 0.90 0.31 −3.8 0.92 0.81 0.44 −23.0 0.89
Gilo 0.93 0.40 −2.4 0.91 – – – –
Table 8. Annual averaged calibrated/validated hydrological balances and percent contribution of water balance components for the Eastern
Nile basin SURQI: surface runoff, LATQII: lateral flow into stream, GW QIII: groundwater in the shallow aquifer, ETIV: evapotanspi-ration, PETV: potential evapotranspiration (Hargreaves method is used), PERCVI: percolation below root zone (groundwater recharge), TLOSVII: transmission losses.
Subbasin Period Rainfall SURQI LATQII GW QIII ETIV PETV PERCVI TLOSVII
(mm) (mm) (mm) (mm) (mm) (mm) (mm) (mm)
Abbay Calibration/validation 1422/1547 314.4/410 1.63/1.7 264.8/302 820.9/816 1585/1558 286/327 11/12
% 100/100 22/26 0.1/0.1 19/20 58/57 20/21 0.8/0.8
BaroAkobo Calibration/validation 1774/1682 527/492 0.3/0.24 233/199 997/979 1519/1542 253/215 24/23
% 100/100 30/29 0.2/0.1 13/12 56/58 14/13 1/1
Tekeze Calibration/validation 931/872 169/162 1.3/1.0 164/140 579/556 1396/1419 179/154 5/4
% 100/100 18/19 0.1/0.1 18/16 62/64 19/18 0.5/0.5
streamflow for Abbay, BaroAkobo and Tekeze river basin respectively (Fig. 9). However, the sensitivity was not lin-ear. Two of the subbasins (Abbay and BaroAkobo) showed a larger sensitivity from 0 to +2◦C than from +2◦C to +4◦C. The reason was mainly due to the evaporation losses from the soil. When the temperature rises, the available water at the top surface of the soil gets lost easily whereas it is difficult to evaporate water from the deeper layers of the soil. Thus, a small change in temperature dries out the upper soil layer while a larger change will be less efficient in changing evapo-ration as the upper soil is already tried out. The Tekeze basin was less sensitive to temperature change compared to the other basins because the basin already had limited moisture for approximately 2/3 of the year with today’s temperatures. 4.3.3 Sensitivity to the combined effect of temperature
and precipitation
Comparing the relative sensitivities of the streamflows when both temperature and precipitation were changed with the linear combination of sensitivities for the separate temper-ature and precipitation changes (Eq. 3) revealed that all re-gions shows a combined response that is very similar to the linear combination of the separate temperature and
precipita-tion response (Fig. 10). The only hint of a non-linear effect is in the Tekeze basin where combining a 4◦C temperature in-crease with a positive precipitation inin-crease gave a response that was around 2 % smaller than the linear combination of the sensitivities (Fig. 10c).
4.4 Estimation of future streamflow using CMIP3 simulations
To assess the uncertainty in future streamflow changes for the Eastern Nile we calculated the temperature and precipi-tation changes in the CMIP3, global coupled climate models (AOGCMs) with three different emission scenarios (SRES A2, A1B and B1). A total of 47 simulations with 19 differ-ent models were conducted. As the AOGCMs often have, large biases when it comes to reproducing the regional cli-matic features (e.g. Elshamy et al., 2009), they are not well suited to force hydrological models without extensive bias corrections. An alternative approach is to use the combined temperature and precipitation changes of the AOGCMs, with the sensitivities of the above simulations 1Q1P ,1T
(Eq. 2), where1P and1T are taken from the AOGCMs
and1Q1P ,1T is the linearly interpolated results of the
[image:13.595.55.543.301.393.2]Table 9. Percentage change in simulated average annual streamflow for each of twenty climate change scenarios compared with the baseline
scenario (Eq. 2).
Precipitation change (%)
Temp.
change Abbay BaroAkobo Tekeze
(◦C) −20 −10 −5 0 5 10 20 −20 −10 −5 0 5 10 20 −20 −10 −5 0 5 10 20
0 −34.9 −18.2 −9.3 0.0 9.8 19.6 40.3 −37.6 −22.5 −14.6 0.0 2.2 10.9 28.9 −42.1 −19.9 −10.8 0.0 12.6 33.0 62.7 +2 −38.6 −22.3 −13.5 −4.4 5.2 14.9 35.4 −43.0 −28.4 −20.6 −6.4 −5.3 4.2 21.8 −41.4 −19.1 −9.5 1.3 13.9 33.8 63.5 +4 −40.4 −24.4 −15.7 −6.6 2.9 12.5 32.8 −43.5 −29.1 −21.4 −7.3 −4.3 3.3 20.8 −44.9 −23.5 −14.0 −3.4 8.8 27.9 57.0
Figure 11: Change in temperature (°C) and precipitation (%) for the period 2081-2100
compared to 1981-2000 from 19 AOGCMs and three emission scenarios (totally 47
simulations). Red square indicates the mean change over all simulations.
Fig. 11. Change in temperature (◦C) and precipitation (%) for the period 2081–2100 compared to 1981–2000 from 19 AOGCMs and three emission scenarios (totally 47 simulations). Red square indi-cates the mean change over all simulations.
is 3.1◦C and precipitation change is 18 %;1Q
1P ,1T is the
linear interpolation for the four sensitivity simulations +2◦C
and +10 %, +2◦C and +20 %, +4◦C and +10 % and +4◦C
and +20 %. The results revealed that all models agreed on a temperature rise, but they disagreed on the direction of pre-cipitation change (Fig. 11).The large uncertainty in the mod-els precipitation change translated into large uncertainties in the streamflow changes (Fig. 12). Around 60 %, 40 % and 55 % of the estimates indicated an increased annual flow in the Abbay, BaroAkobo and Tekeze, respectively and the en-semble mean changes were modest in all three basins (5 %,
−1 %, and 12 % the Abbay, BaroAkobo and Tekeze, respec-tively). However, the extremes ranged from a 152 % increase in streamflow in the Tekeze basin using the CCSM 3.0 SRES A2 scenario changes to a 55 % reduction in the same basin using the same scenario, but the values were from the GFDL CM2.0 model (Fig. 12c). This is in line with the large spread found for the Abbay in Elshamy et al. (2009).
5 Summary and conclusion
This study report on a first attempt to use a physically based, distributed hydrological model (SWAT) run with daily station based precipitation and temperature data and calibrated with daily streamflow measurements to simulate the Eastern Nile streamflow.
SWAT2005 adequately simulated monthly variability in flows for the Eastern Nile basin. The total simulated monthly streamflow ranged from good (0.65< ENS<0.75 to very
good (ENS>0.75). The average daily and monthly
differ-ence between the observed and simulated flow (PBIAS) was good (PBIAS≤ ±20 %) for the calibration period with the exception of the Abbay subbasin where it was only satisfac-tory (±20 %<PBIAS≤ ±40 %). In summary, good perfor-mance of the model in the validation period indicate that the fitted parameters during calibration period listed in Table 4 can be taken as a representative set of parameters for the Eastern Nile watershed and further simulation and evalua-tion of alternative scenario analysis for other periods using the SWAT model. The model simulated monthly flows better than daily flows and the model was probably not adequate for studies of single sever events in small catchments.
Sixty percent of the average annual rainfalls were esti-mated to be lost through evaporation. The simulations es-timated the runoff coefficients to be 0.24, 0.30 and 0.18 for Abbay, BaroAkobo and Tekeze subbasin respectively. Sur-face runoff carried around 55 % of the streamflow in the Abbay and Tekeze while in BaroAkobo the percentage was about 72. The remaining contribution was from groundwater. The streamflow sensitivity to changes in precipitation and temperature differed among the basins and depended on the strength of the changes. The annual streamflow re-sponses to a 10 % change in precipitation with no temper-ature change were on average 19 %, 17 %, and 26 % for Ab-bay, BaroAkobo and Tekeze river basin respectively. How-ever, the responses to a reduction and increase in precipita-tion were not the same. While BaroAkobo was more sensi-tive to a reduction in precipitation, Tekeze showed a larger sensitivity to an increase.
The streamflow sensitivity to temperature was moderate. The average annual streamflow responses to a 1◦C change in temperature and no precipitation change were −4.4 %,
[image:14.595.51.331.100.390.2]D. T. Mengistu and A. Sorteberg: Sensitivity of SWAT simulated streamflow to climatic changes 405
−30 −20 −10 0 10 20 30 40 50
Streanflow change (%)
BCCR−BCM2.0 CCCma−CGCM3.1
CNRM−CM3 CSIRO−Mk3.0 GFDL−CM2.0 GFDL−CM2.1 GISS−AOM GISS−EH IAP−FGOALS1.0g
INM−CM3.0 IPSL−CM4 MIROC3.2(HI) MIROC3.2(MED)
ECHAM5/MPI−OMMRI−CGCM2.3.2a CCSM3.0 PCM1
UKMO−HadCM3 UKMO−HadGEM1
SRES A2 SRES A1B SRES B1
−20 0 20 40 60 80
Streanflow change (%)
BCCR−BCM2.0 CCCma−CGCM3.1
CNRM−CM3 CSIRO−Mk3.0 GFDL−CM2.0 GFDL−CM2.1 GISS−AOM GISS−EH IAP−FGOALS1.0g
INM−CM3.0 IPSL−CM4 MIROC3.2(HI) MIROC3.2(MED)
ECHAM5/MPI−OMMRI−CGCM2.3.2a CCSM3.0 PCM1
UKMO−HadCM3 UKMO−HadGEM1
SRES A2 SRES A1B SRES B1
−60 −40 −20 0 20 40 60 80 100 120 140 160
Streanflow change (%)
BCCR−BCM2.0 CCCma−CGCM3.1
CNRM−CM3 CSIRO−Mk3.0 GFDL−CM2.0 GFDL−CM2.1 GISS−AOM GISS−EH
IAP−FGOALS1.0g INM−CM3.0 IPSL−CM4 MIROC3.2(HI)
MIROC3.2(MED) ECHAM5/MPI−OMMRI−CGCM2.3.2a
CCSM3.0 PCM1
UKMO−HadCM3 UKMO−HadGEM1
[image:15.595.61.540.115.606.2]SRES A2 SRES A1B SRES B1
Fig. 12. Change in annual streamflow (%) for the (a) Baro Akobo, (b) Abbay and (c) Tekeze basins using the calculated combined
river basin respectively. The very low sensitivity of the Tekeze basin indicated that flows were moisture limited for a large part of the year.
The overall assessment made by coducting 20 hypotheti-cal climate sensitivity scenarios is that the annual streamflow of the Eastern Nile is very sensitive to variations in precip-itation and moderately sensitive to temperature changes. In addition, we showed that the modelled response of a com-bined temperature and precipitation change was very similar to adding the responses from the temperature change only and precipitation change only simulations.
Applying the combined temperature-precipitation sensi-tivities and 47 temperature and precipitation scenarios from 19 AOGCMs participating in CMIP3, we estimated the fu-ture streamflow change to be very uncertain and strongly de-pendent on the choice of climate model. The reason was the disagreement between the different climate models on both the strength and the direction of future precipitation changes. Thus, based on the state of the art climate models little can be said about future changes in Eastern Nile stream-flow. However, our analysis emphasis the need for doing en-semble runs using different climate models in this type of as-sessment. This uncertainty may have implications for long-term water resource planning, estimation of the future hy-dropower potential, reservoir design and to which extent de-velopment of agriculture should utilize river or groundwater based irrigation systems.
Finally we note a few of the weaknesses of this analysis. The first is that it tried to address the climate change impact with only one hydrological model and two forcing variables (precipitation and temperature), neglecting all other variables (such as vegetation or radiation changes) which might affect the runoff generation. In our sensitivity studies, we multi-plied the precipitation with a fraction. This means that we as-sumed the wet-day frequency was unchanged and the whole precipitation change was given as a change in intensity. For temperature, we added a constant for the whole year and thereby assuming that the changes were not depending on season. Finally, we used a rather simple procedure to link the CMIP3 climate change scenarios to changes in streamflow. These were all crude assumptions. However, we feel that given the huge uncertainty in the future precipitation changes partly justifies this crude treatment.
Acknowledgements. This work has been carried out with support from the Ethiopian Malaria Prediction System (EMaPS) project funded by the Norwegian Programme for Development, Research and Education (NUFU) and the University of Bergen.
We acknowledge the modelling groups, the Program for Climate Model Diagnosis and Intercomparison (PCMDI) and the WCRP‘s Working Group on Coupled Modelling (WGCM) for their roles in making available WCRP CMIP3 multi-model dataset. Support of this dataset is provided by the Office of Science, US Department of Energy.
Edited by: A. Opere
References
Arnell, N. W., Liu, C., Compagnucci, R., da Cunha, L., Hanaki, K., Howe, C., Mailu, G., Shiklo-manov, I., and Stakhiv, E.: Im-pacts, Adaptation, and Vulnerability, in: Climate Change 2001, edited by: McCarthy, J. J., Canziani, O., Leary, N. A., Dokken, D. J., and White, K. S., Cambridge University Press, Cambridge, United Kingdom, Hydrol. Water Resour., Chapter 4, 191–233, 2001.
Arnold, J. G. and Allen, P. M.: Estimating hydrologic budgets for three Illinois watersheds, J. Hydrol., 176, 57–77, 1996. Arnold, J. G., Srinivasan, R., Muttiah, R. S., and Williams, J.
R.: Large area hydrologic modelling and assessment, Part 1: Model development, J. Am. Water Resour. Assoc., 7389, 73–89 doi:10.1111/j.1752-1688.1998.tb05961.x, 1998.
Arsano, Y.: Ethiopia and the Nile: The Dilemma of National and Regional Hydro-politics, PhD dissertation, Zurich, Switzerland, University of Zurich, 2004.
Arsano, Y.: Ethiopia and the Eastern Nile basin, Aquat. Sci., 67, 16–17, doi:10.1007/s00027-004-0766-x, 2005.
Barrett, C. B.: The development of the Nile Hydrometeorological forecast system, JAWRA J. Am. Water Resour. Ass., 29, 933– 938, doi:10.1111/j.1752-1688.1993.tb03254.x,1993.
Checkol, D. A.: Modeling of Hydrology and Soil Erosion of Upper Awash River Basin, Cuvillier, G¨ottingen, 2006.
Conway, D.: A water balance model of the upper Blue Nile in Ethiopia, Hydrol. Sci. J., 42, 5265–286, 1997.
Duan, Q., Sorooshian, S., and Gupta, V.: Effective and efficient global optimisation for con-ceptual rainfall-runoff models, Water Resour. Eng., 28, 1015–1031, doi:10.1029/91WR02985, 1992. Dugale, G., Hardy, S., and Milford, J. R.: Daily catchment
rain-fall estimated from METEOSAT, Hydrol. Process., 5, 261–270, 1991.
Elshamy, M. E., Seierstad, I. A., and Sorteberg, A.: Impacts of cli-mate change on Blue Nile flows using bias-corrected GCM sce-narios, Hydrol. Earth Syst. Sci., 13, 551–565, doi:10.5194/hess-13-551-2009, 2009.
FAO: Soils of EAST Africa, SEA, Food and Agriculture Organiza-tion of the United NaOrganiza-tions, ACD-Rom Data, Rome, 1995. FAO: The Soil and Terrain Database for Northeaster n Africa
(CD-ROM), FAO, Rome, 1998.
Gan, T. Y.: Application of scientific modelling of hydrological re-sponses from hypothetical small Catchments to access a complex conceptual rainfall runoff model, Water Resources Series Tech. Rept. 111, University of Washington, Seattle, Washington, 1988. Hansen, M., Defries, R., Townshend, J. R. G., and Sohlberg, R.: UMD Global Land Cover Classication, Specify 1 Degree, 8 Kilo-metre, or 1 Kilometre (1.0), Department of Geography, Univer-sity of Maryland, College Park, Maryland, 1981–1994, 1998. Jha, M., Arnold, J. G., Gassman, P. W., Giorgi, F., and Gu, R.
R.: Climate change sensitivity assessment on Upper Mississippi River Basin Streamflows using SWAT, J. Am. Water Res. Ass., 42, 997–1015, doi:10.1111/j.1752-1688.2006.tb04510.x, 2006. Johanson, P. A. and Curtis, P. D.: Water balance of Blue Nile River
basin in Ethiopia, J. Irrigat.Drain. Eng., 120, 573–590, 1994. Lenhart, T., Eckhardt, K., Fohrer, N., and Frede, H. G.: Comparison
of two different approaches of sensitivity analysis, Phys. Chem. Earth, 27, 645–654, 2002.
D. T. Mengistu and A. Sorteberg: Sensitivity of SWAT simulated streamflow to climatic changes 407
CMIP3 multi-model dataser: A new era in climate change re-search, B. Am. Meteorol. Soc., 88, 1383–1394, 2007.
Mohamed, Y. A., van den Hurk, B. J. J. M., Savenije, H. H. G., and Bastiaanssen, W. G. M.: Hydroclimatology of the Nile: results from a regional climate model, Hydrol. Earth Syst. Sci., 9, 263– 278, doi:10.5194/hess-9-263-2005, 2005.
MoWR: Ethiopian water sector strategy, Ministry of Water Re-sources, Addis Abeba, 2002.
Neitsch, S. L., Amold, J. G., Kinir y, J. R., Srinivasan, R., and Williams, J. R.: Soil and Water Assessment Tool User’s Manual, Version 2000, Temple, Tx. USDA Agricultural Research Service and Texas A&M Blackland Research Center, 2002a.
Neitsch, S. L., Arnold, J. G., Kiniry, J. R., Srinivasan, R., and Wil-iams J. R.: Soil and Water Assessment Tool User’s Manual Ver-sion 2000. GSWRL Report 02-02, BRC Report 02-06, TR-192, College Station, TX: Texas Water Resources Institute, 2002b. Neitsch, S. L., Amold, J. G., Kiniry, J. R., Srinivasan, R., and
Williams, J. R.: Soil and Wa-ter Assessment Tool SWAT Theory, Version 2000, Temple, Tx.USDA Agricultural Research Service and Texas A&M Blackland Research Center, 2005.
Nicks, A .D.: Stochastic generation of the occurrence, pattern, and location of maximum amount of daily rainfall, in: Proceed-ings Symposium on Statistical Hydrology, United States Depart-ment of Agriculture, Misc. Publication No. 1275, Tucson, AZ, 31 August-2 September 1971, 1974.
Rientjes, T. H. M., Haile, A. T., Kebede, E., Mannaerts, C. M. M., Habib, E., and Steenhuis, T. S.: Changes in land cover, rain-fall and stream flow in Upper Gilgel Abbay catchment, Blue Nile basin Ethiopia, Hydrol. Earth Syst. Sci., 15, 1979–1989, doi:10.5194/hess-15-1979-2011, 2011.
Rossi, C. G., Dybala, T. J., Moriasi, D. N., Arnold, J. G., Amonett, C., and Marek, T.: Hydrologic calibration and validation of the soil and water assessment tool for the Leon River watershed, Soil Water Conserv., 6, 533–541, 2008.
Santhi, C., Arnold, J. G., Williams, J. R., Dugas, W. A., Srinivasan, R., and Hauck, L. M.: Validation of the SWAT Model on large River Basin with point and Nonpoint sources, J. Am. Water. Re-sour. Ass., 37, 1169–1188, 2001.
Schaake, J. C.: GIS structure for the Nile River forecast project, in: Application of Geographic Information Systems in Hydrol-ogy and Water Resources Management, edited by: Kovar, K. and Nachtnebel, H. P., IAHS publication, No. 211, Wallingford, 1993.
Setegen, S. G., Srinivasan, R., and Dargahi, B.: Hydrological mod-elling in the Lake Tana basin, Ethiopia using SWAT model, Open Hydrol. J., 2, 49–62, 2008.
Sorooshian, S. and Gupta, V. K.: Model calibration, in: Computer Models of Watershed Hydrology, edited by: Singh, V. P., Water Resources Publications, Colorado, USA, 1995.
Sutcliffe, J. V., Dugdale, G., and Milford, J. R.: The Sudan floods of 1988, Hydrol. Sci. J., 31,355–364, 1989.
Swain, A.: Ethiopia, the Sudan, and Egypt: the Nile River dispute, J. Mod. African Stud., 35, 675–694, 1997.
Taye, M. T., Ntegeka, V., Ogiramoi, N. P., and Willems, P.: Assess-ment of climate change impact on hydrological extremes in two source regions of the Nile River Basin, Hydrol. Earth Syst. Sci., 15, 209–222, doi:10.5194/hess-15-209-2011, 2011.
Todd, M. C., Barrett, E. C., Beaumont, M. J., and Green, J. L.: Satellite identification of rain days over the upper Nile River basin using an optimum infrared rain/no-rain thresh-old temperature model, J. Appl. Meteorol., 34, 2600–2611, doi:10.1175/15200450(1995)034<2600:SIORDO>2.0.CO;2, 1995.
USDA: Soil Taxonomy, 2nd Edn., US Agriculture, Edn., US Gov-ernment Printing Office, Washington, DC, 1999.
USDA-SCS: Hydrology, in: National Engineering Hand Book Sect. 4, Washington, DC, USDA-SCS, 1972.
Van Griensven, A. and Bauwens, W.: Application and evaluation of ESWAT on the Dender basin and the Wrister lake basin, Hydrol. Process., 19, 827–838, 2005.
Van Griensven, A., Francos, A., and Bauwens, W.: Sensitivity anal-ysis and auto-calibration of an integral dynamic model for river water quality, Water Sci. Technol., 45, 321–328, 2002.
Wambeke, A.: Proper ties and management of soils of the tropics, FAO Land and Water Digital Media series, Rome, 2003. Williams, J. R.: The EPIC model, in: Computer Models of
Wa-tershed Hydrology, Water Re-Sources Publications, Highlands Ranch, CO, 909–1000, 1995.